Bold Reports Designer: Query Builder Quick Overview

The Bold Reports designer provides an interactive SQL query builder that helps you create queries to feed data to a report in less time. It’s an interface between the actual database and the end user. The queries will not affect the actual database; they only fetch data from it.
This blog post takes you through the process and options involved in building queries with this interface.
Getting to the Query Builder
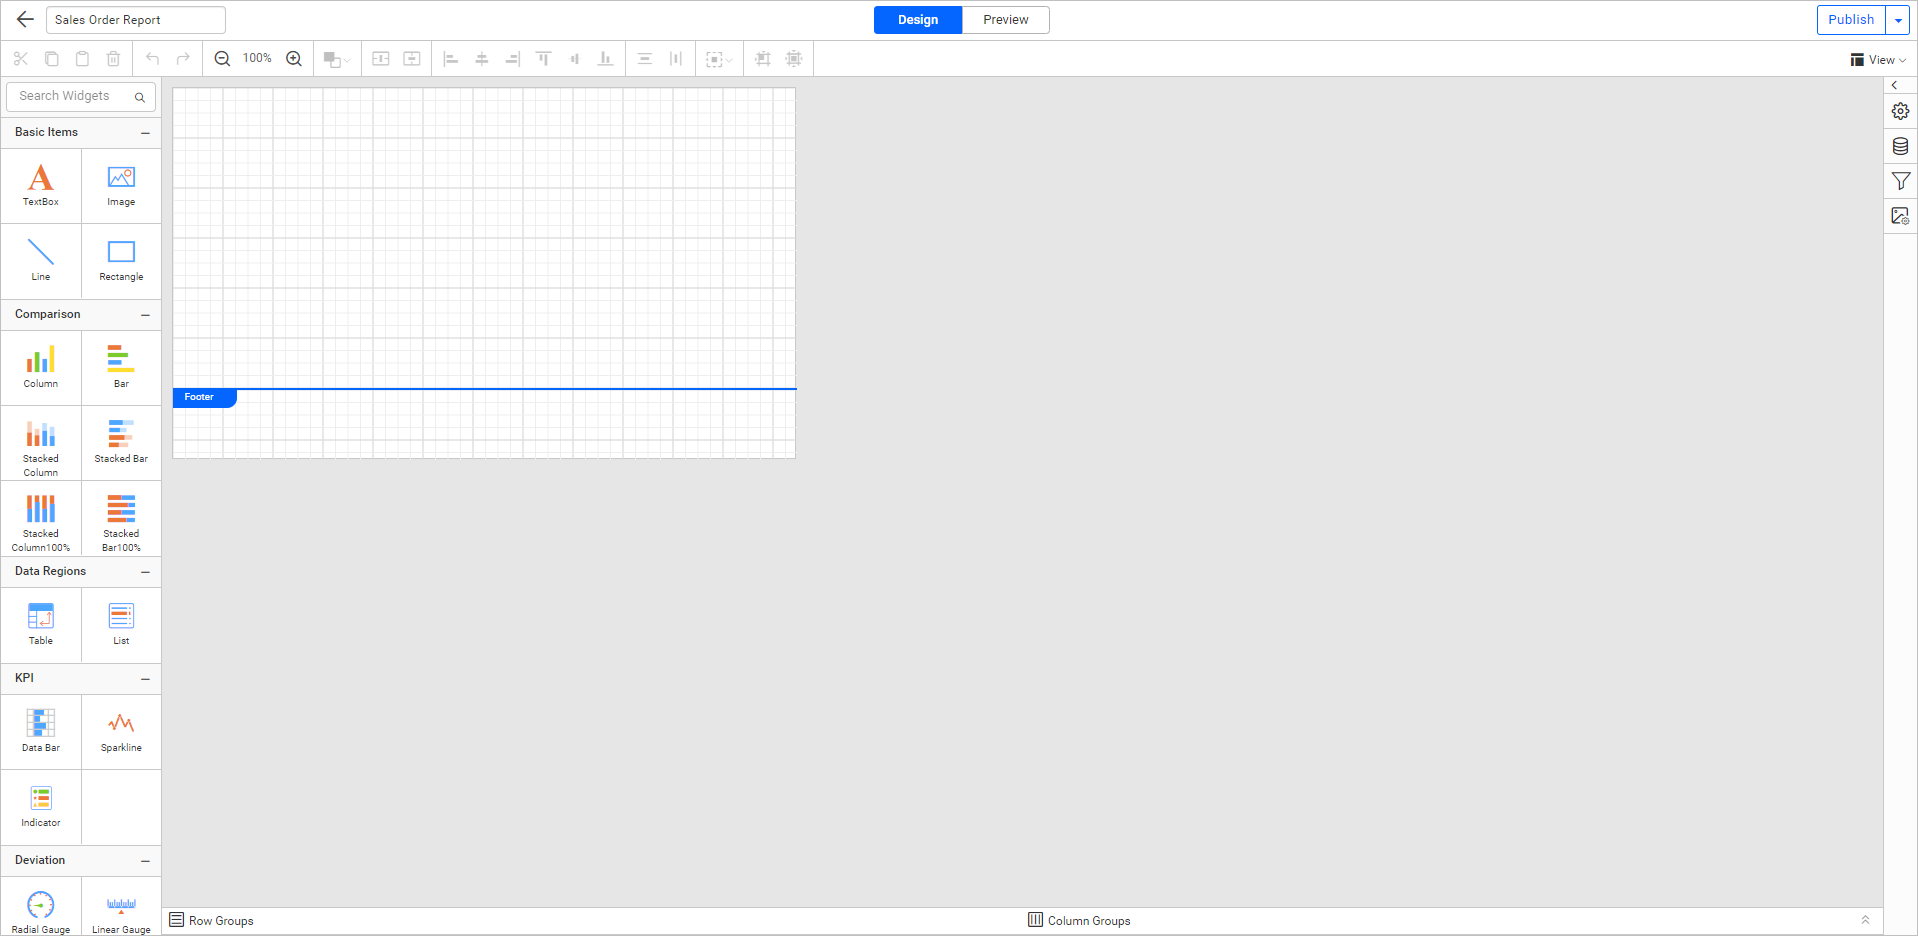
First, launch the Bold Reports on-premise server demo site, refer to the “Steps to create a report” article, and create a new report.
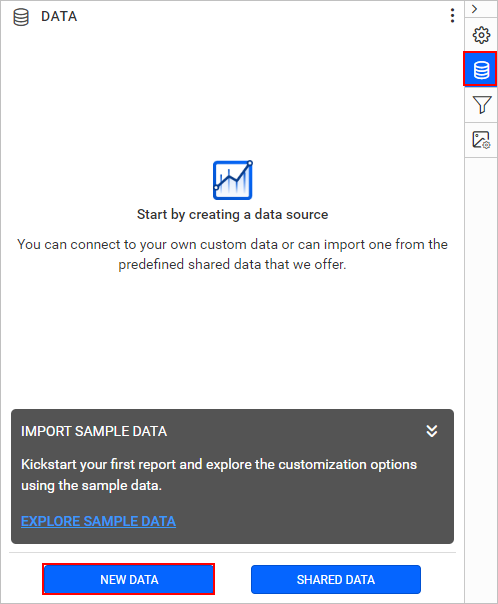
To access the query builder in the Report Designer, you must connect a report to a data source.
In the data pane, click the New Data button.
From the supported data-source connection types, choose the SQL connection.
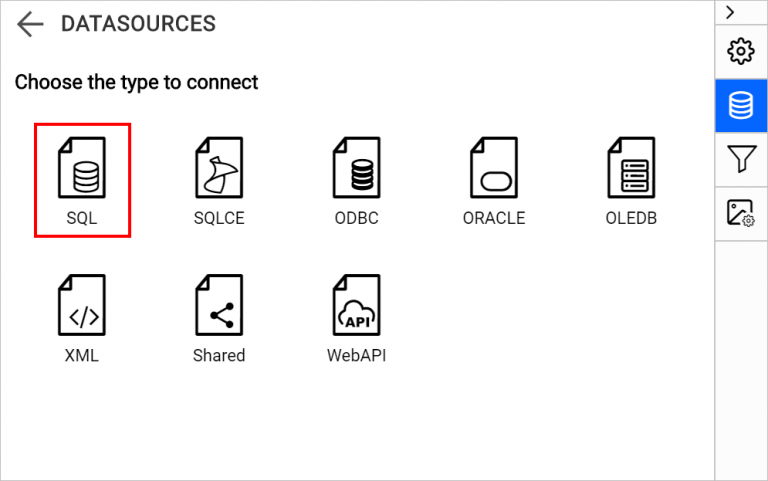
Choosing Connection Type
Provide the necessary connection information and click the Connect button.
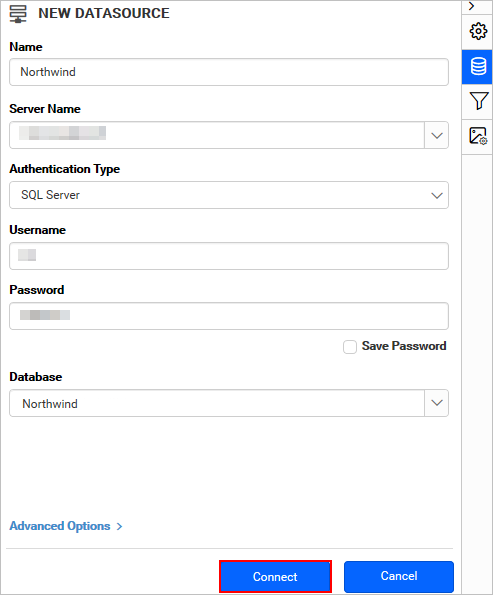
Data Source Connection Panel
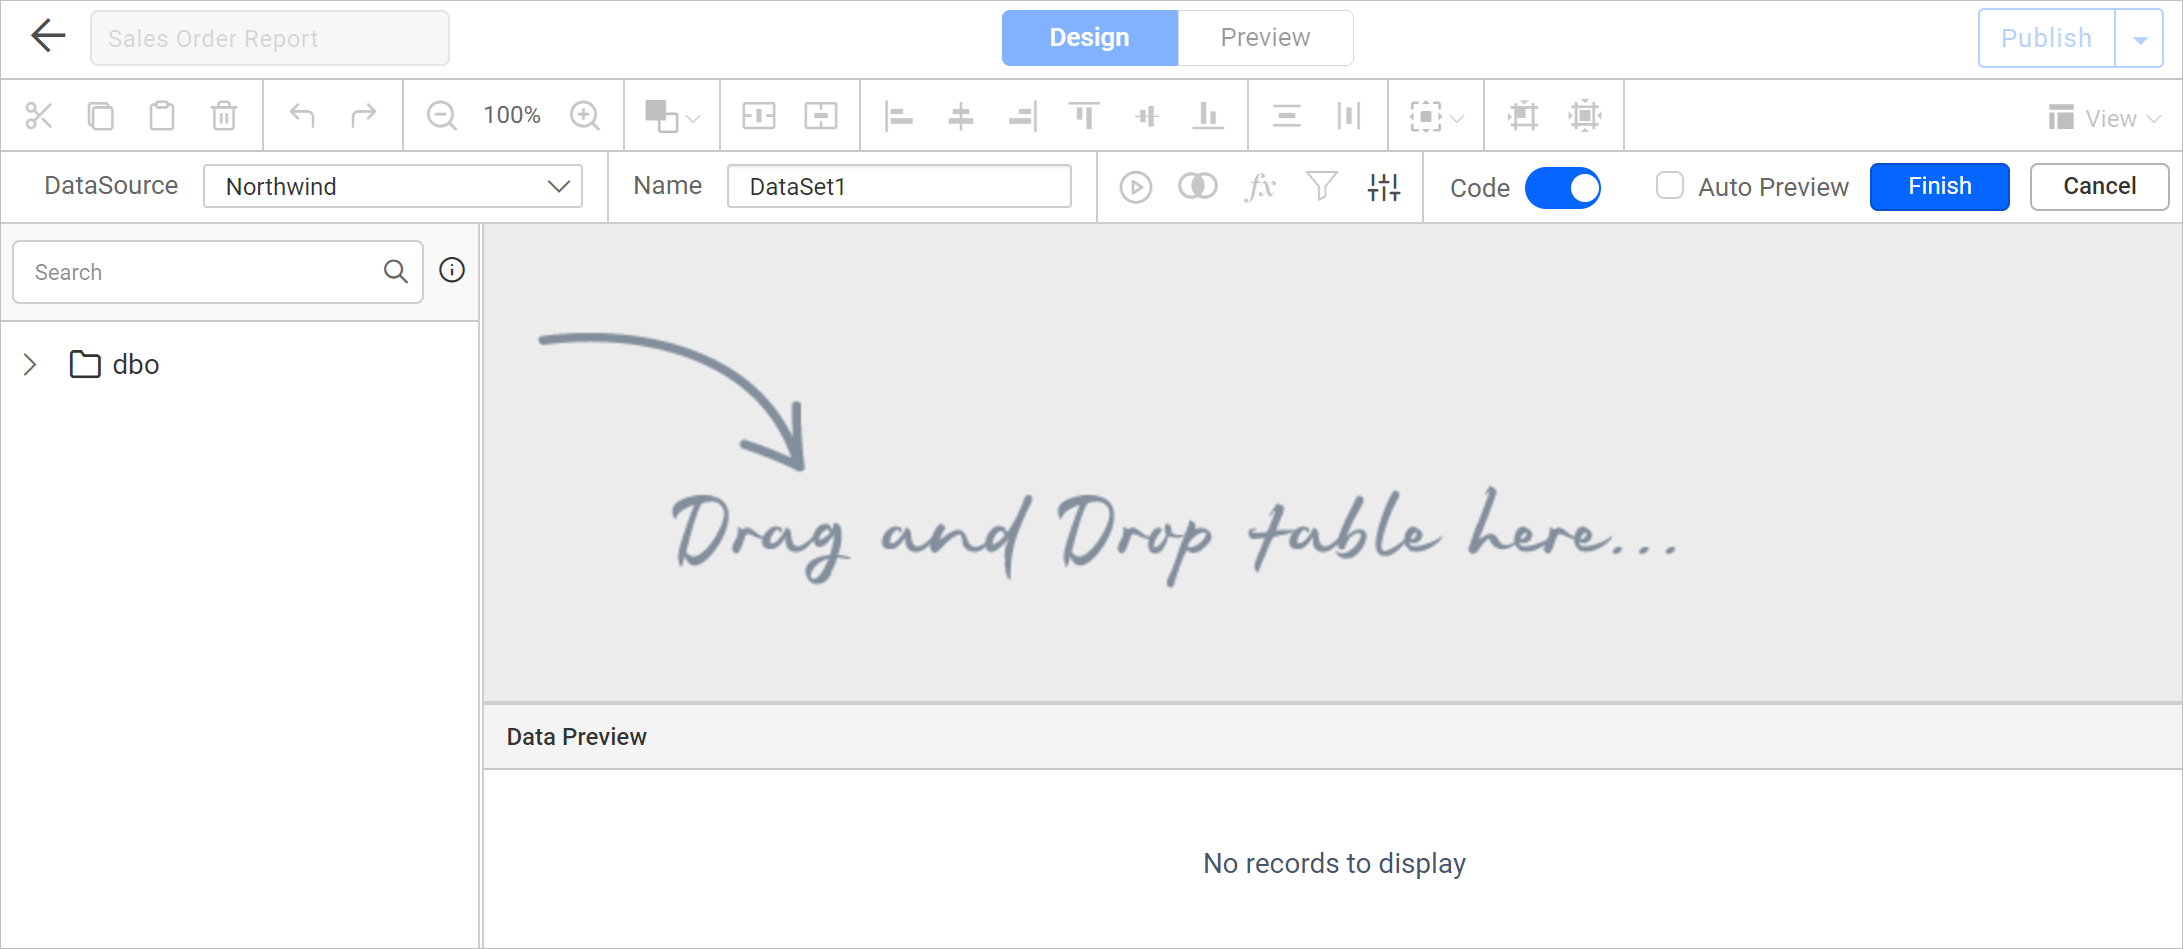
This opens the query builder in the Report Designer, which provides both graphical and query editor support for a SQL data-source connection. For other data-source connection types, it provides a query editor only.
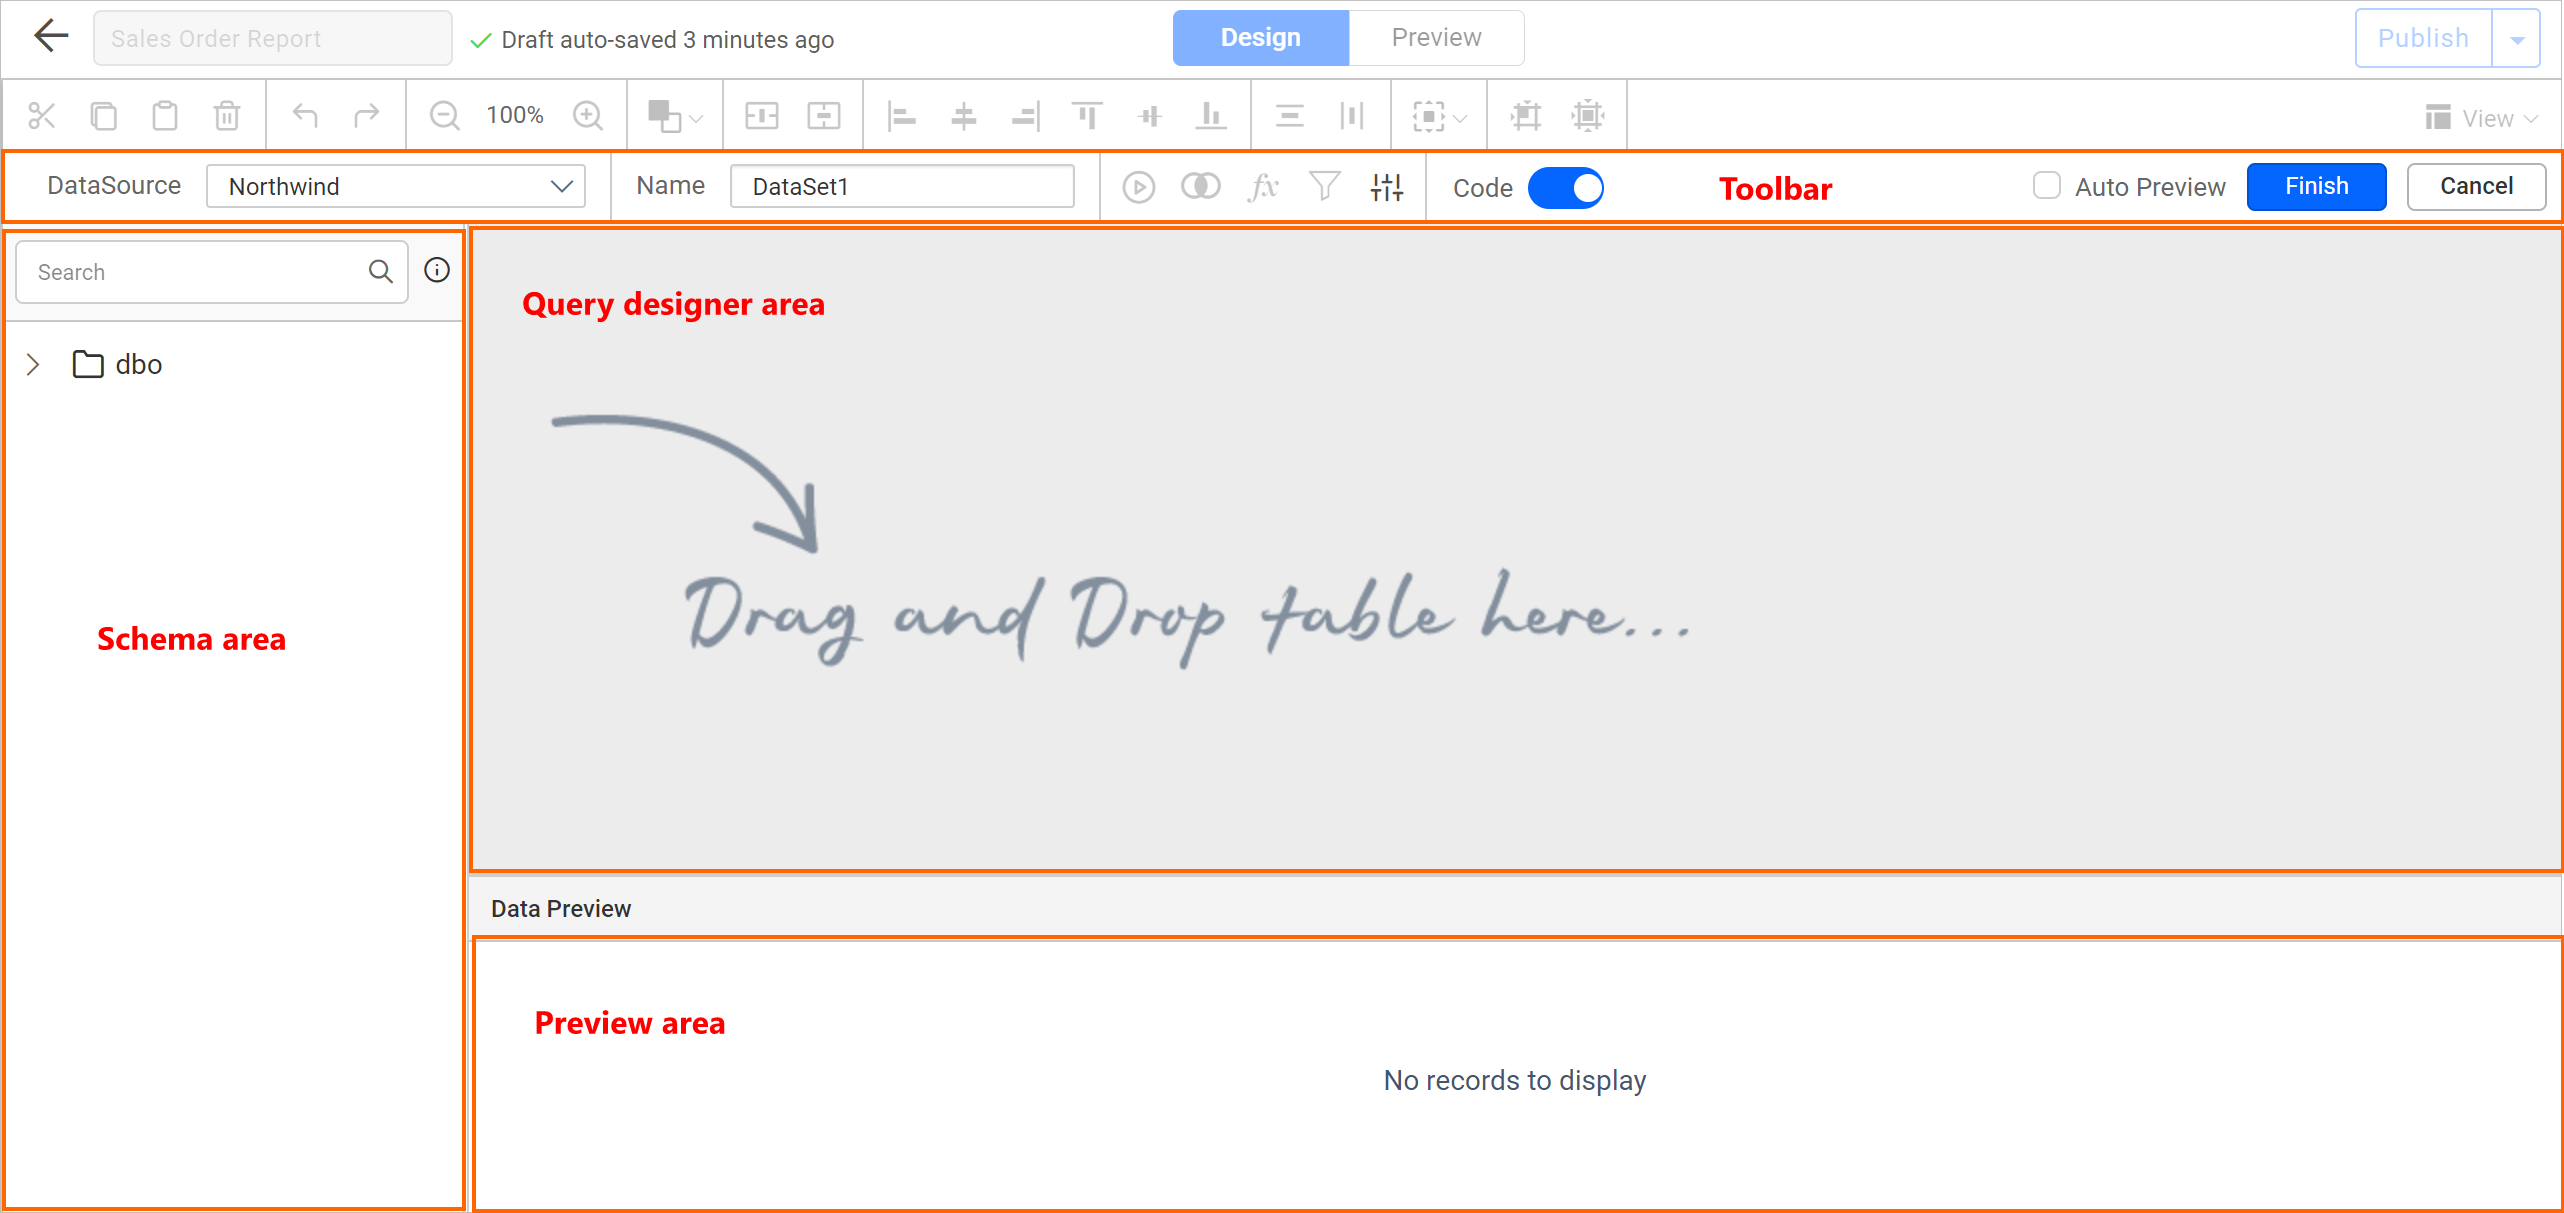
Parts of the Query Designer
The query designer interface is divided into four sections:
- Toolbar
- Schema area
- Query designer area
- Preview area
Toolbar Options
| Option | Description |
| DataSource | Allows users to switch data sources. |
| Name | Allows users to edit the name of a data set. |
| Run | Executes the query and displays the results in the preview area. |
| Join | Opens the Joiner dialog. |
| Expression | Opens the Query Expression dialog. |
| Filter | Opens the Query Filter dialog. |
| Parameters | Opens the Parameters dialog. |
| Switcher button | Switches between graphical and text-based design views. |
| Auto preview checkbox | Automatically displays table data in the preview area, if checked, when changing a query. |
| Finish | Saves the query to a data set in the report. |
| Cancel | Cancels the data set create or edit action. |
Schema Area
Based on a given SQL connection string, the schema area displays a hierarchical view of tables, views, and procedures available in the respective database. It also contains a search field so that you can easily search for a table.
Query Designer Surface
The query designer surface is where you set up queries. It contains both a graphical and query editor to create SQL queries.
Graphical editor
In the graphical editor, drag-and-drop tables from the schema area onto the design surface to generate queries for your data set. You can rename columns and hide columns from the query in the graphical editor. To remove a table from the design surface, click the close icon.
Query editor
The query editor lets you write queries in a query syntax that is supported by the SQL data source. You can write a SQL query directly or modify a SQL statement created by the graphical editor. When you switch to the query editor from the graphical editor, the table structure is automatically converted into SQL statements. The query editor automatically formats the query with highlighted keywords.
Preview Area
The preview area displays results of the query execution in the grid layout (limited to the first 100 data records). To load more records, you can use the Load more option provided in the grid header. When designing the query, you can click the Run icon in the toolbar anytime to preview the records.
Transforming data
In the query builder, you can transform data after retrieving it from the data source with the following options:
Query Filter
Filter out specific data from a database using the query filter option. To specify the filter condition, click the Filter button in the toolbar. This action will open the Query Filters dialog.
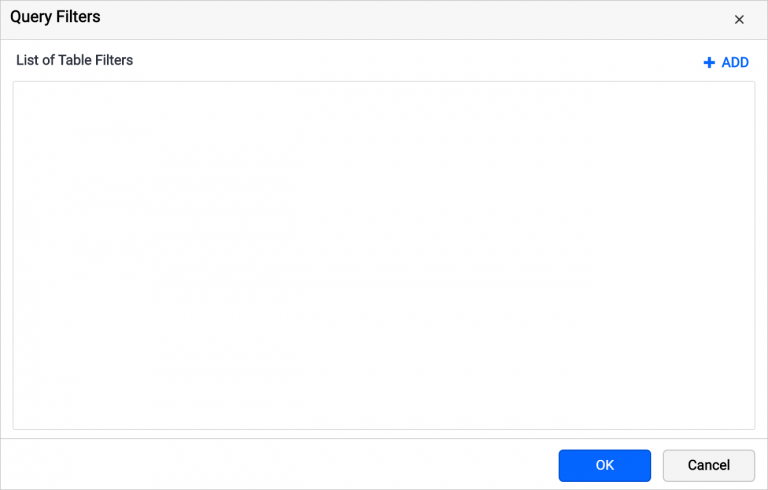
Filter conditions are used to generate a SQL WHERE clause. Refer to the “Query Filters” documentation to create, edit, and delete filters in query builder.
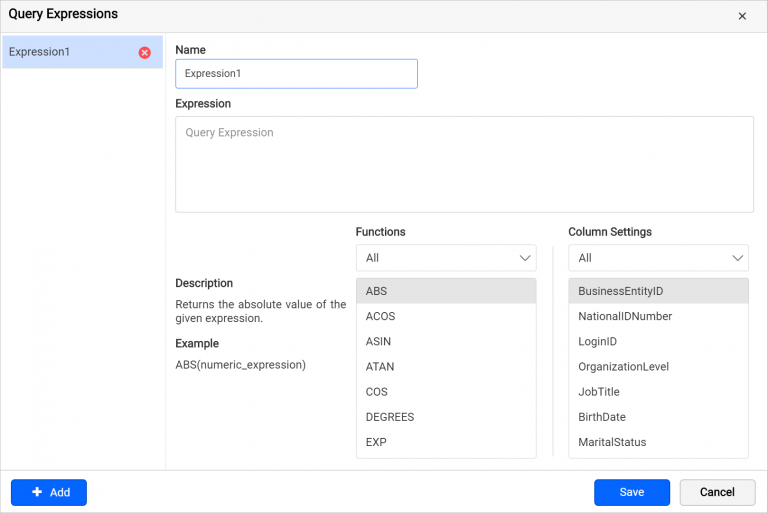
Query Expression
Use the query expression option to manipulate existing data columns using operators and built-in functions to create a new calculated measure field. Refer to the “Query expression” documentation to create, edit, and delete query expressions in the query builder.
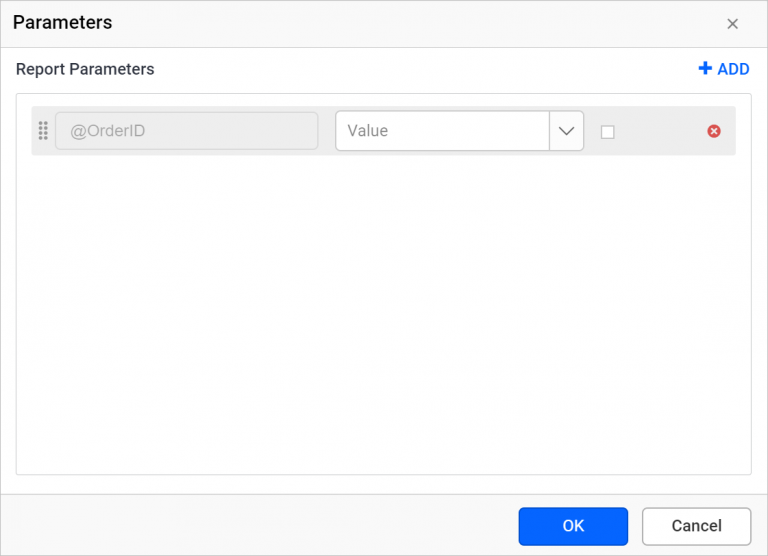
Parameters
In the query builder, you can build a parameterized query. A parameterized query generally prompts a user to enter a value before the query is executed to determine the type of data to be displayed in the result set. Data set parameters are created based on the query parameters provided in the data set query. You can set parameters in the query by using both graphical and query editors. Refer to the “Define query parameters” documentation to create, edit, and delete query parameters in the query builder.
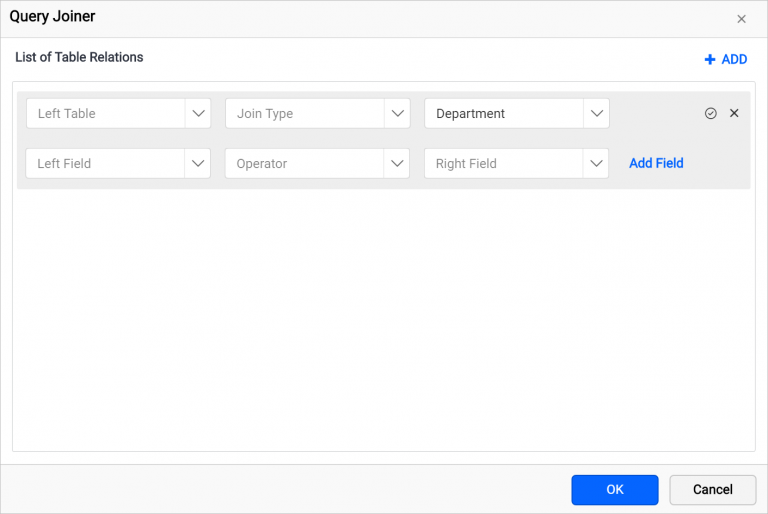
Join Tables
Joining tables is required when the query design of the data set demands more than one table. While dropping a table on the design surface, the query builder joins tables automatically based on foreign-key relationships, or they can be joined manually. The query builder provides a dialog interface to manage relationships between tables.
Refer to the “Join Tables” documentation for more information on joining tables.
Designing a SQL Query
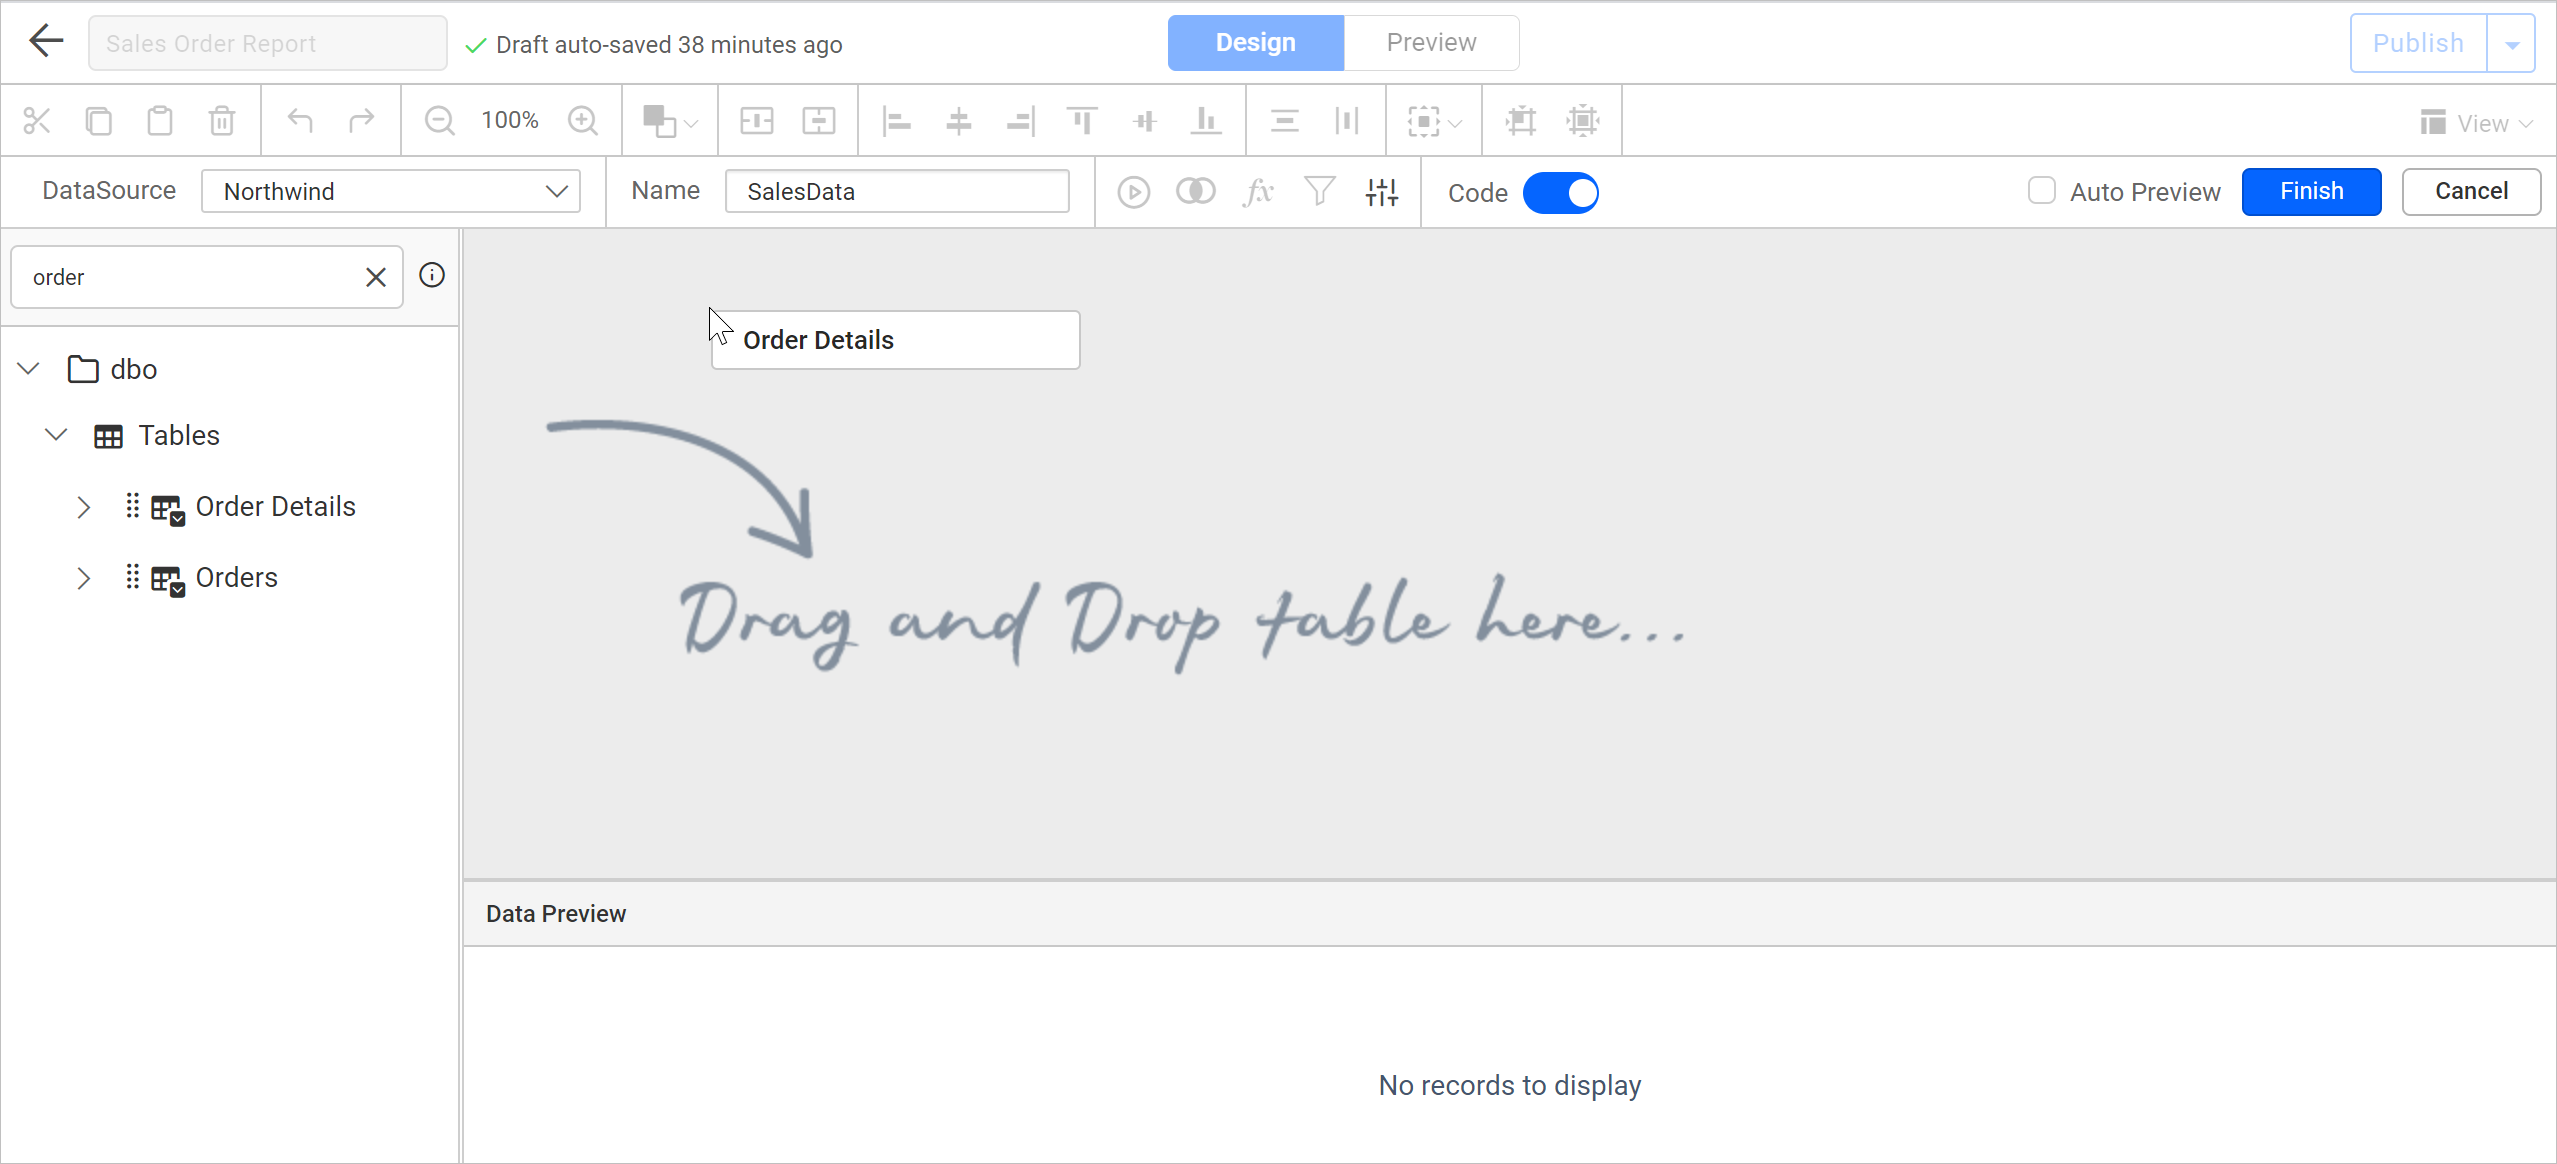
Now that you’re well-versed with the query builder interface, start building Sales data. To do so, you’re going to use the Order Details and Products tables from the Northwind database.
Drag the Order Details table from the dbo schema to the graphical query designer surface.
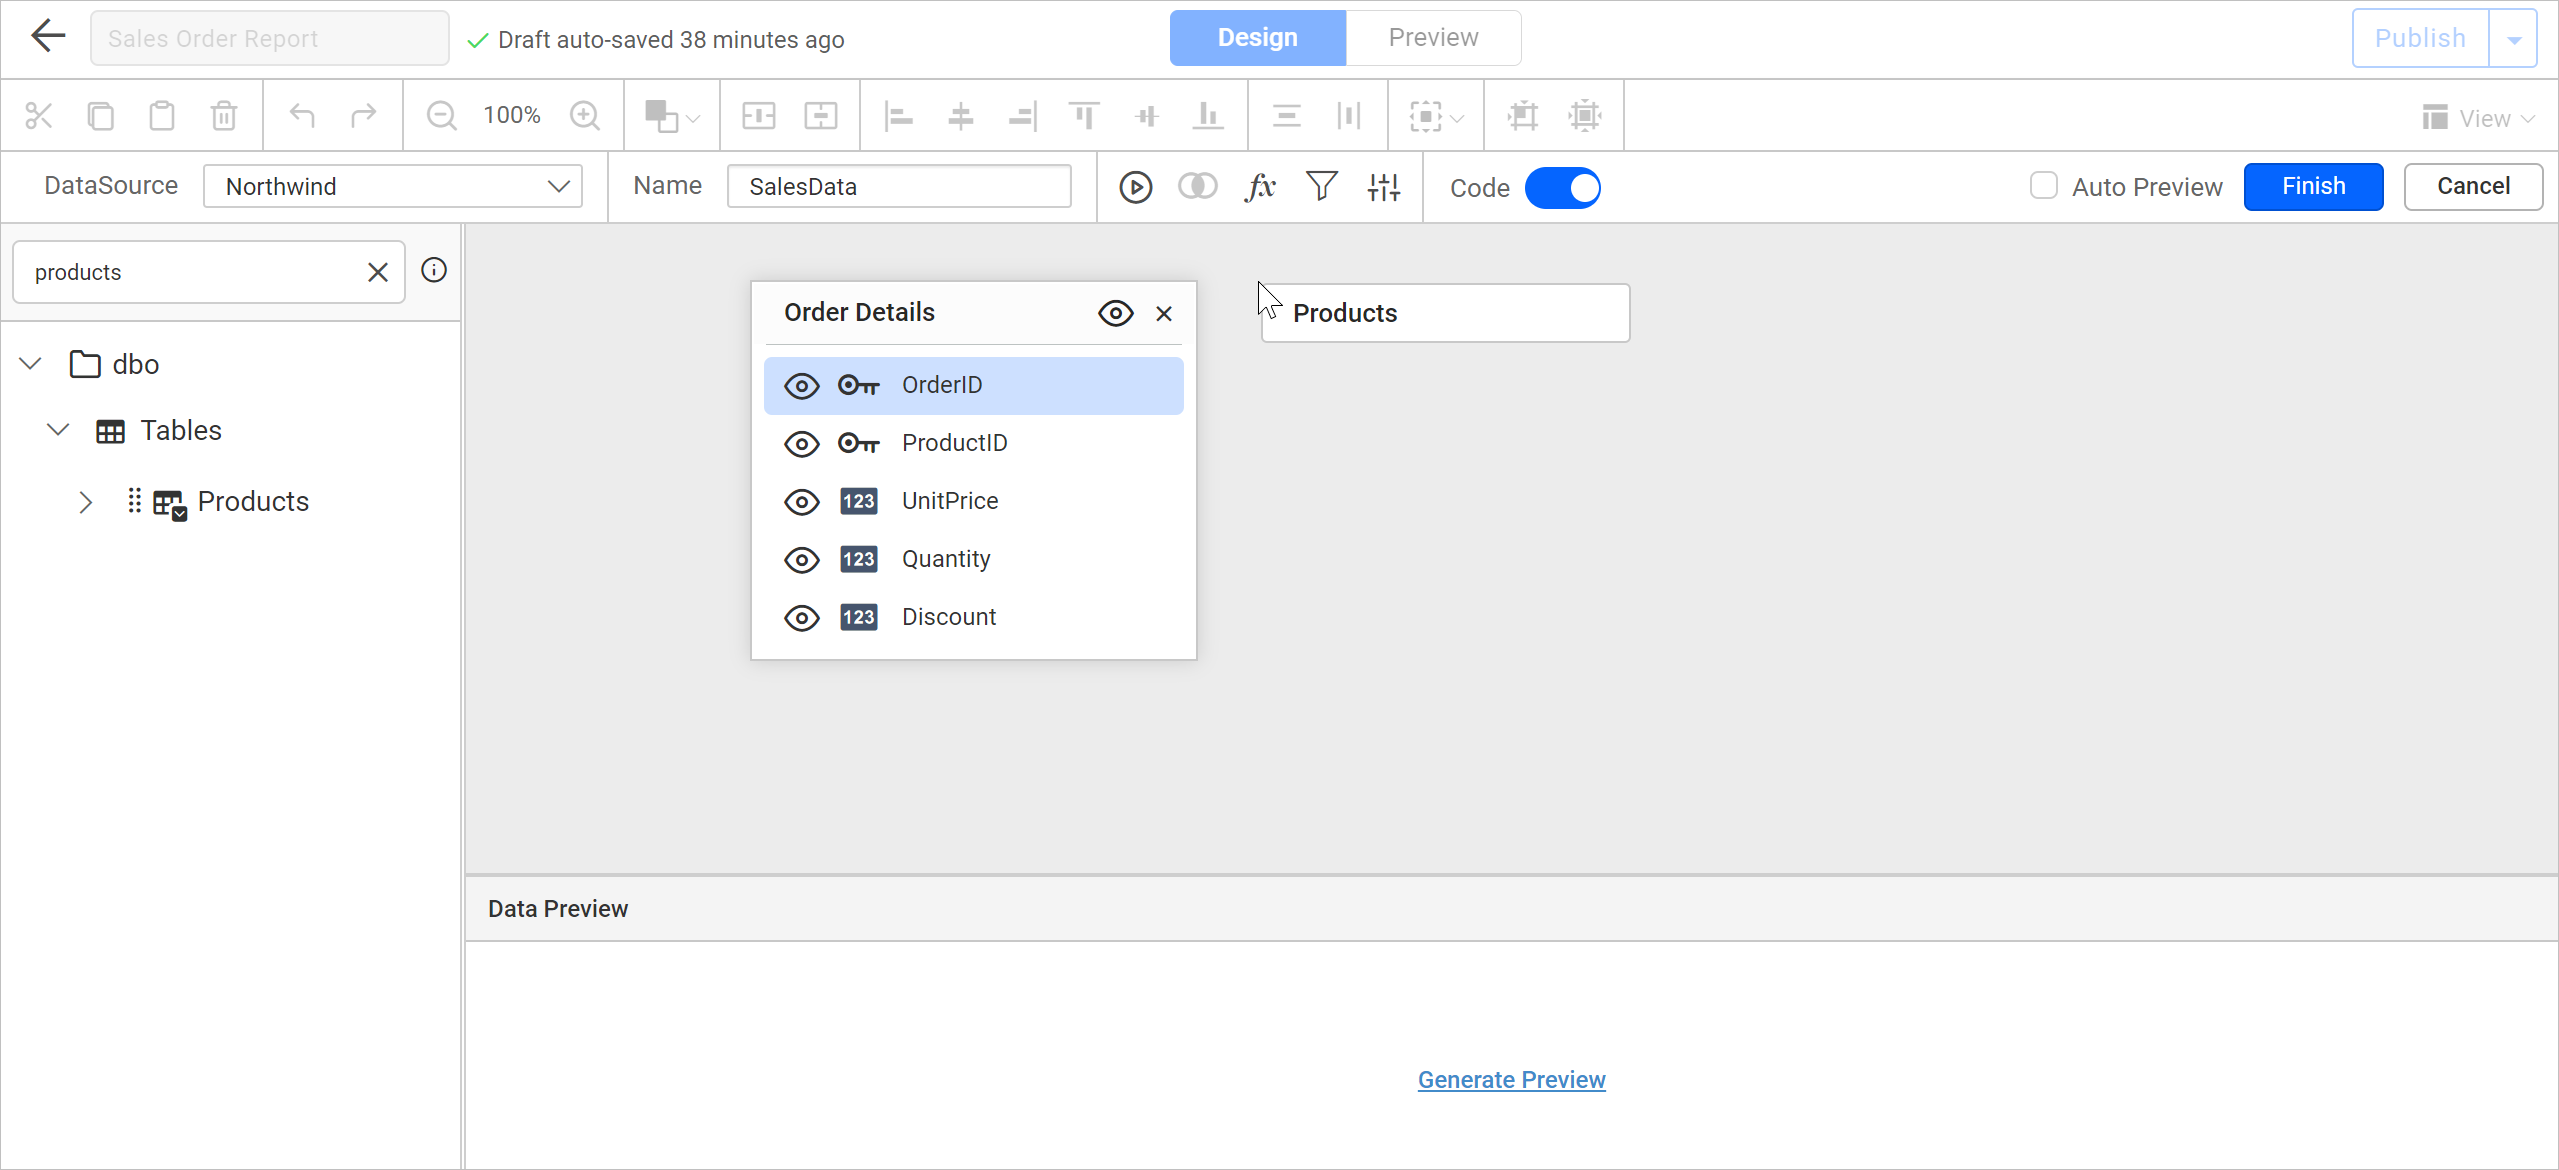
Similarly, drag the Products table from the dbo schema to the graphical query designer surface. As you can see, the query builder automatically joined the two tables by using the ProductID column.
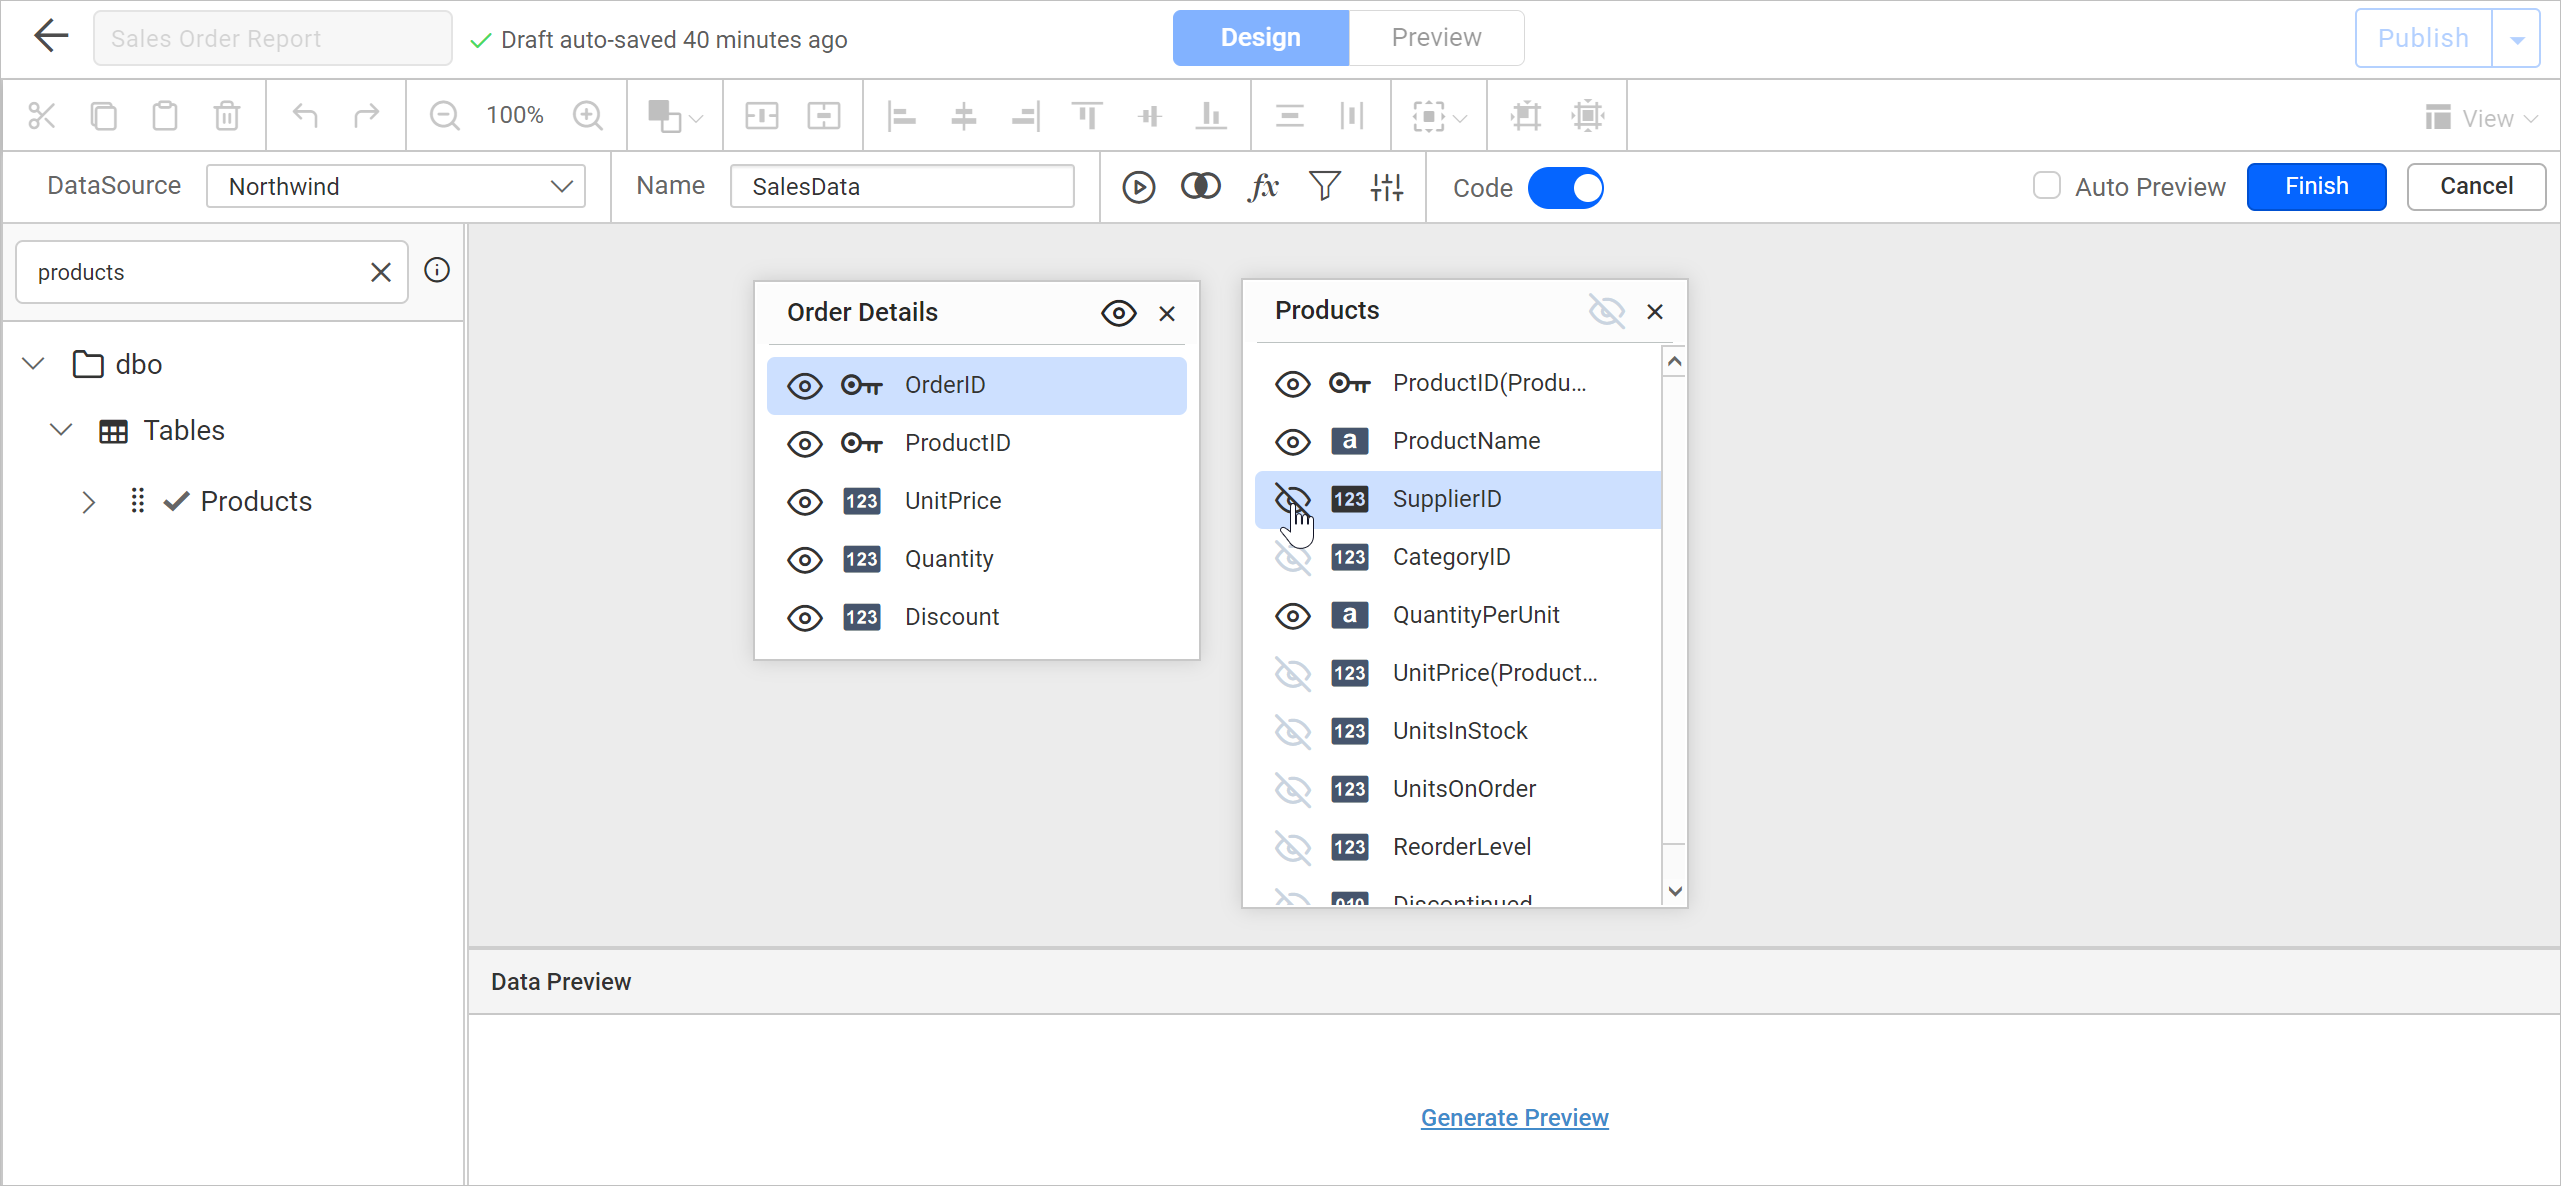
Now, hide the unnecessary columns from both tables. To do that, click the eye icon in each column name on the table surface.
Execute to see the results in the preview area.
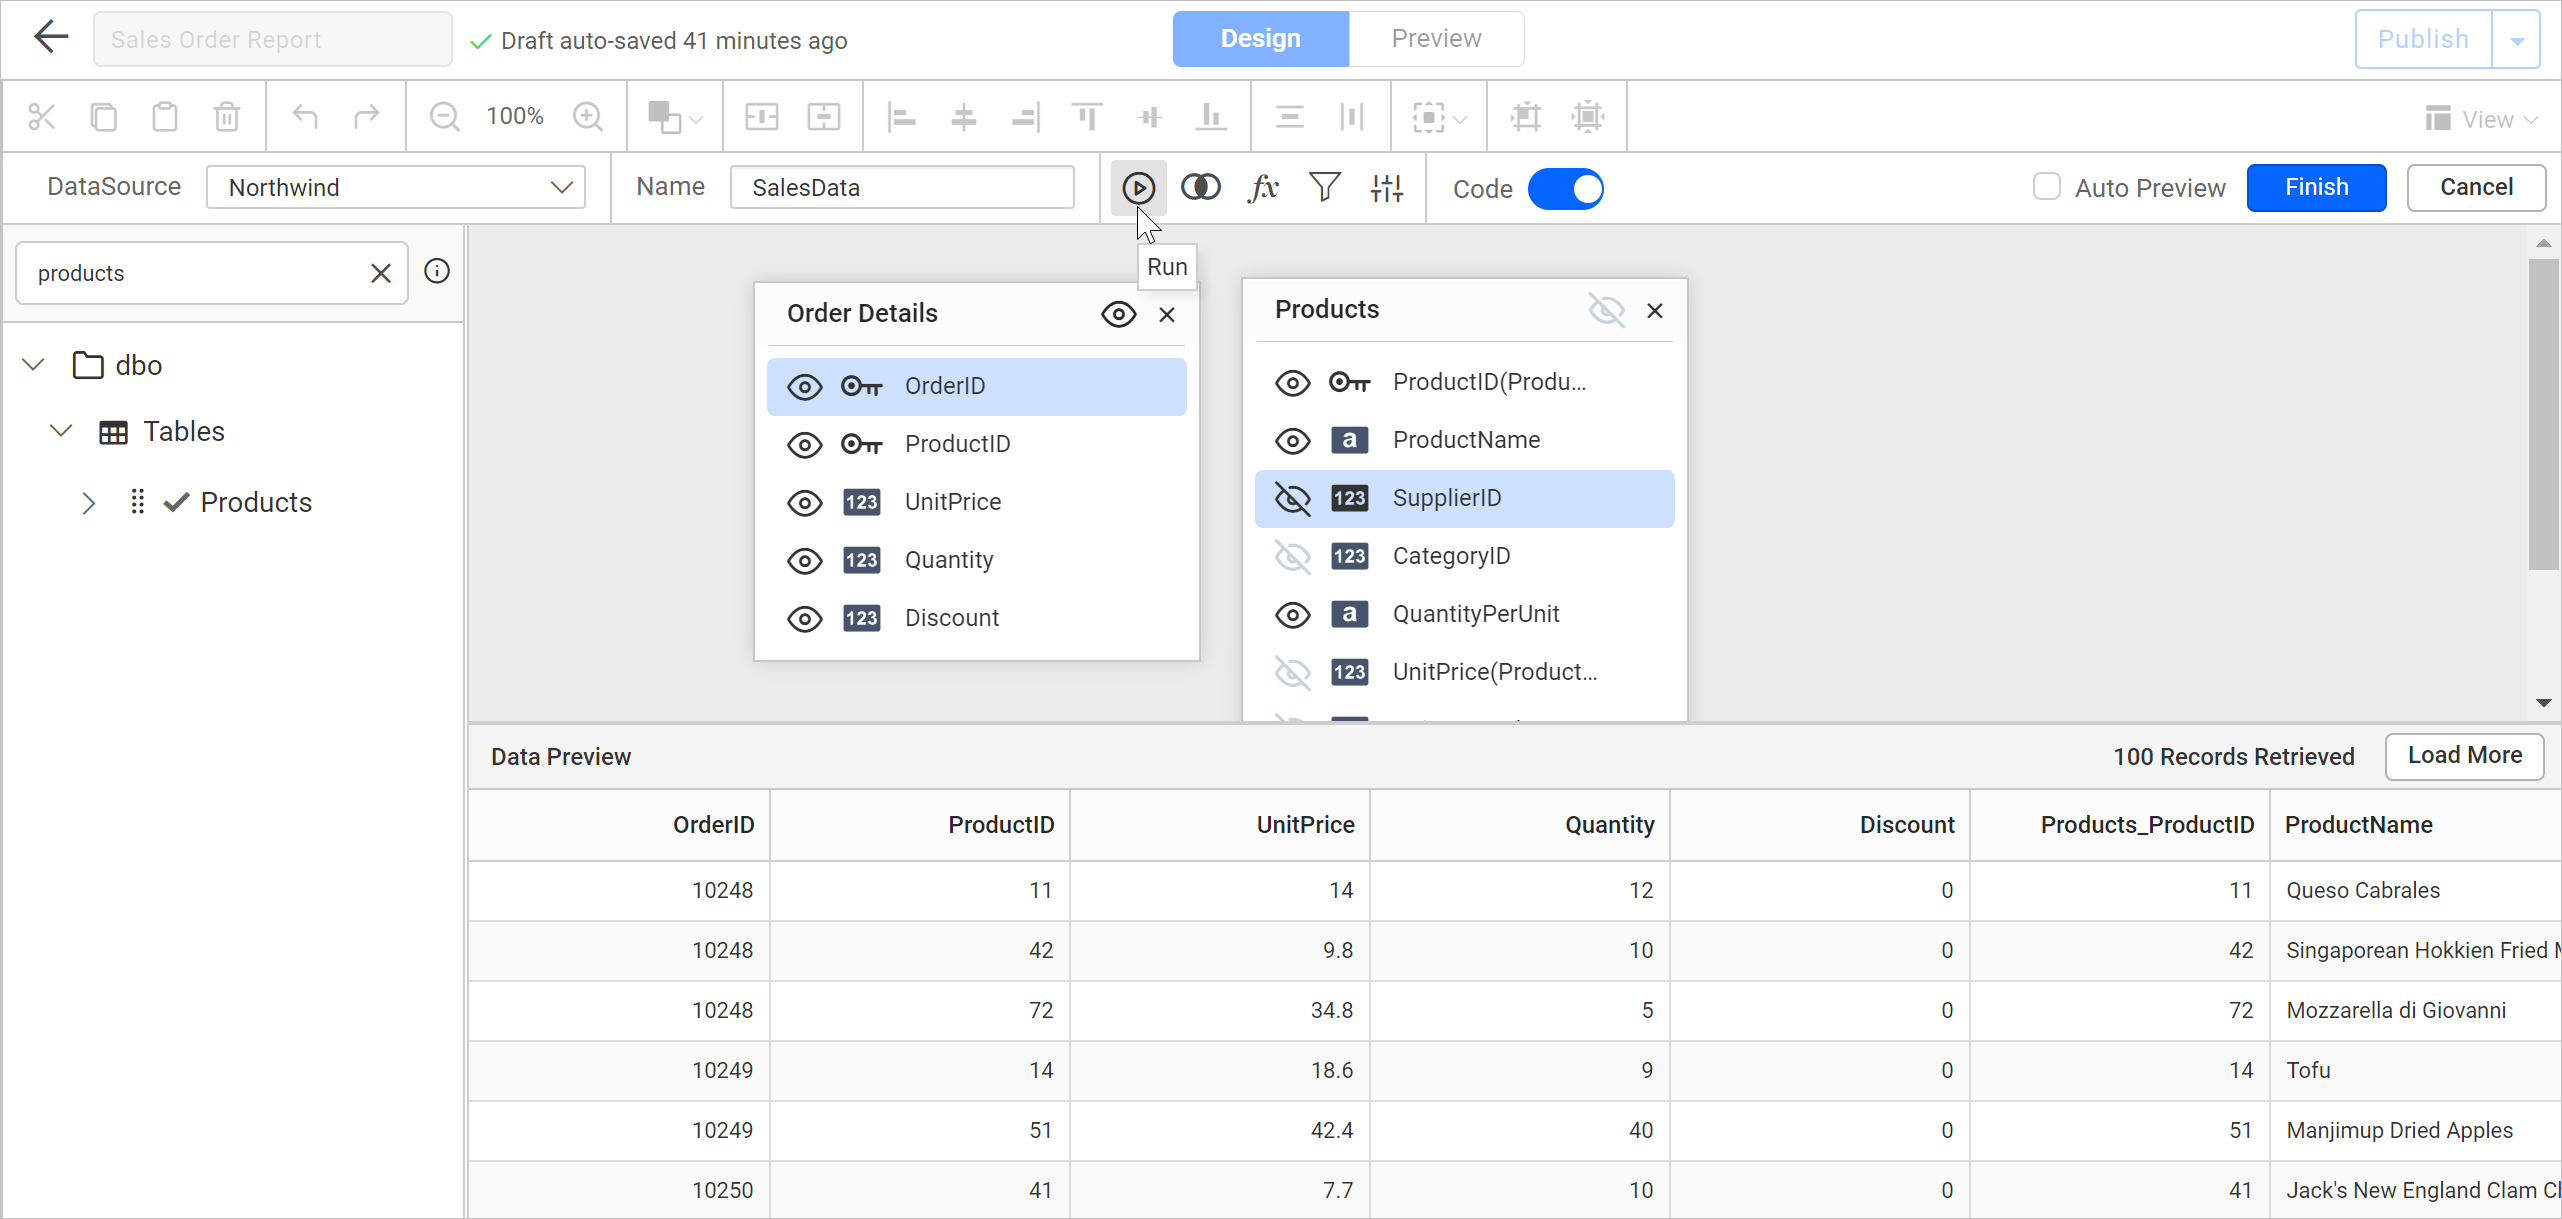
Click the Finish button; the query will be saved as a data set in the report.
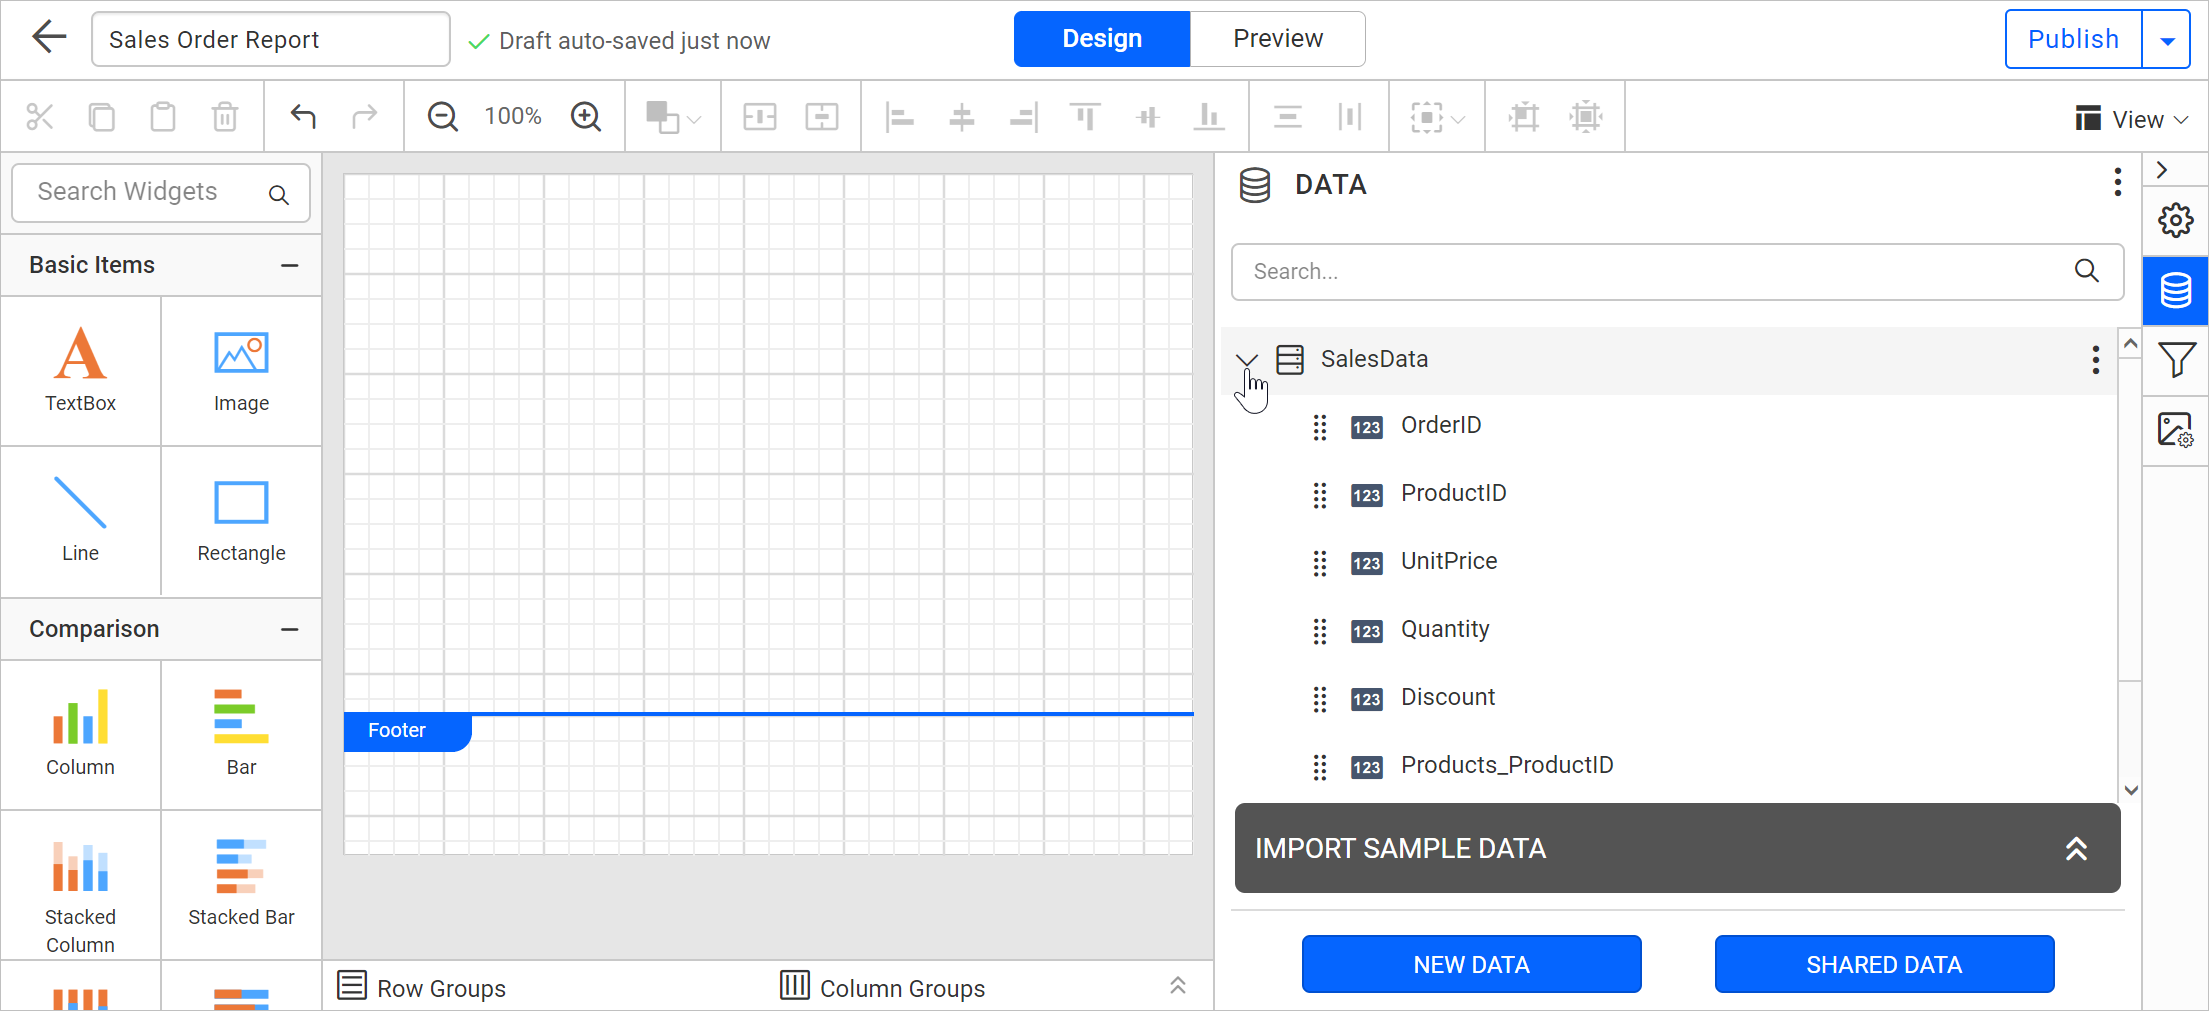
You can use this data to create stylish and interactive reports with a rich set of report items, making it easy to collaborate with colleagues.
Conclusion
I hope this blog provided a clear overview about the query builder and how to build a query using it in the Report Designer. To explore further, go through our sample reports and Bold Reports documentation.
If you have any questions, please post them in the comments section. You can also contact us by submitting your queries through our contact page, or if you already have an account, you can log in to submit your support query.
Bold Reports now comes with a 15-day free trial with no credit card information required. We welcome you to start a free trial and experience Bold Reports for yourself. Give it a try and let us know what you think!
Stay tuned to our official Twitter, Facebook, LinkedIn, Pinterest, and Instagram pages for the announcement about the release.