The JavaScript Report Viewer efficiently accesses, displays, and interacts with SSRS RDL and RDLC reports from diverse data sources. It supports localization, multiple export formats (PDF, Excel, CSV) and customizable printing. Interactive features like drill-down, drill-through, hyperlinks and subreports enrich user experience. Seamlessly integrates with applications, offering role-based access control for security.
What you can do with JavaScript Report Viewer
Reports from anywhere
Effortlessly access and view SSRS RDL and RDLC reports with the JavaScript Report Viewer. With or without a report server, the viewer allows easy access to reports from Microsoft SSRS, SSRS SharePoint, as well as applications, cloud storages, and databases.
Create data models with an easy-to-use query builder
Consume data from a wide variety of data providers that are in local or server databases:
Built-in data sources:Microsoft SQL Server, Microsoft SQL Azure, SQL CE, XML, Microsoft Access, Oracle, OLEDB, and ODBC.
Business object data sources:IList, DataSet, and DataTable.
Custom data processing extensions:MySQL, SQLite, PostgreSQL, and more.
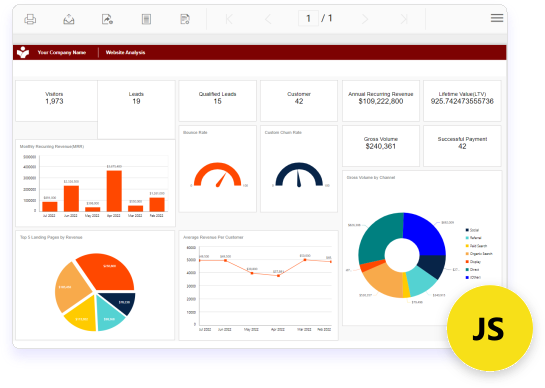
Visualize your information with unmatched clarity by highlighting data on demand using the JavaScript Report Viewer. Supported data customization options include:
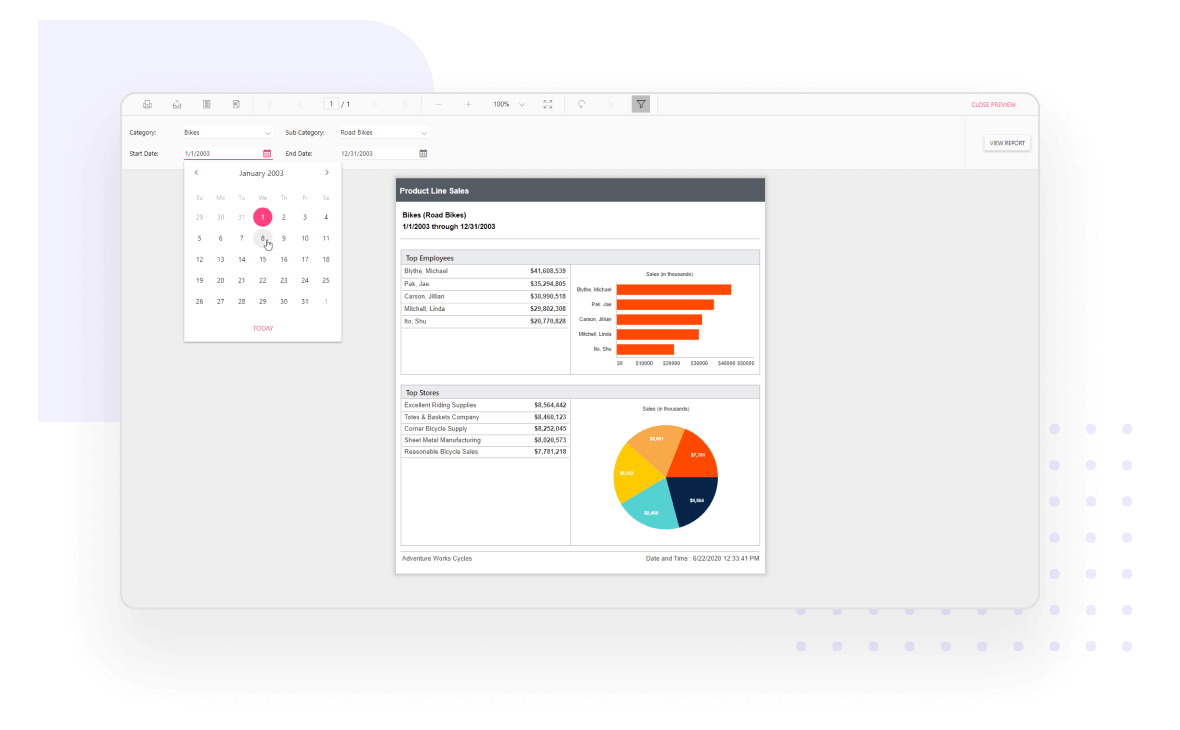
Parameters are the most widely used functionalities to interact with RDL/RDLC reports at runtime. The following parameter types allow you to modify the data presentation to provide an enhanced user experience:
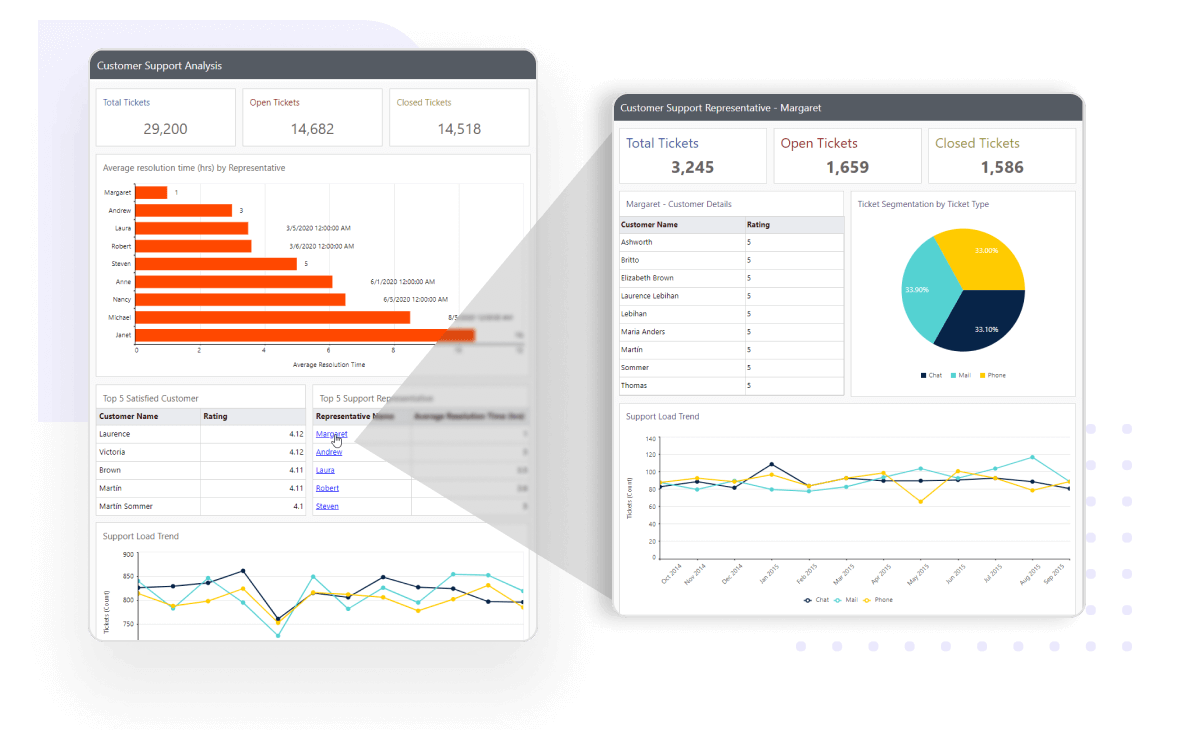
The JavaScript Report Viewer displays data in data regions that support user interactions at runtime with features like drill down, drill through, hyperlinks, bookmarks or anchors, document map, sub-reports, and nested data regions.
Effortlessly print and export report contents by just clicking the print/export option in the toolbar. The most popular file formats such as PDF, Word, Excel, CSV, PowerPoint, XML, and HTML are supported.
Pixel-perfect built-in themes are available in Material, Bootstrap, and Fabric designs. In addition, the library comes with an accessible high-contrast theme.
Developer-friendly APIs
You have control over all UI elements (toolbar, parameter block, page, and dialogs) and behaviors of the HTML5/JavaScript Report Viewer. It provides the best user experience to users through a rich set of developer-friendly APIs.
HTML5/JavaScript Report Viewer will adaptively render itself with optimal user interfaces for phone, tablet, or desktop form factors. This allows your application to scale elegantly on all kinds of devices.
Bold Reports helps you meet key security and compliance standards. All activity logs are safely stored, can’t be changed, and are easy to export when needed.
Bold Reports helps you meet key security and compliance standards. All activity logs are safely stored, can’t be changed, and are easy to export when needed.