
Extract, Transform, Load: Simplify Data Integration for Reporting
Bring all your data together into one clean, streamlined ETL pipeline. Bold Data Hub is the built-in ETL tool for reporting: it extracts data from 25+ sources, transforms it with SQL scripts or visual rules, and loads it into your destination database, so your data is always accurate, fresh, and ready.
Data Hub
ETL Automation
Cloud Integration








25+
Data sources supported
17
Destination database types
Billions
of rows loaded via Parquet
No
Extra ETL tools needed
An ETL Tool for Reporting, Built for Every Workflow
From raw inputs to refined insights, Bold Data Hub empowers teams to extract, model, transform, and deliver data optimized for reporting across any environment, using a built-in ETL pipeline with no separate tooling required.

Effortless Data Extraction
Extract data from 25+ sources, including files, web APIs, SQL databases, and NoSQL systems, configure each connector via a YAML pipeline file or pre-built template, and load the results directly into Bold Reports or Bold BI. Once the pipeline completes, Bold Reports automatically creates a live data source connected to your destination, ready for report design with no manual setup.

Flexible Loading Options
Load transformed data into your data warehouse of choice, Apache Doris, SQL Server, PostgreSQL, MySQL, Snowflake, Google BigQuery, Amazon Redshift, Azure Synapse, ClickHouse, Oracle, StarRocks, MinIO, and more. Configure multiple destinations of the same type (e.g. separate PostgreSQL databases for dev, staging, and production) and load different pipelines into each independently.

Custom Extraction
Schedule recurring ETL jobs at defined intervals or trigger on-demand runs with the "Run Now" button. Each pipeline execution is logged, check the Schedule History and Logs tabs to view run status, row counts, and debug failures.
Bold Data Hub Architecture
Connect data from different sources in one place to make reporting easier, no need for extra tools. Bold Data Hub follows a Source → Staging (DuckDB) → Destination flow. Extracted data lands in DuckDB for data transformation and preview, then moves to your chosen destination database. For large datasets, Parquet-based bulk upload is used for fast, reliable loading.
Automate Your ETL Workflows End to End
Bold Data Hub helps you automate ETL workflows, manage large data volumes, and bring everything into one efficient pipeline for reporting. With built-in data pipeline automation, set up recurring jobs, move billions of rows from large files, and connect 25+ sources, all from a single, integrated interface inside Bold Reports.
Automation and Scheduling
Configure interval-based ETL scheduling via the Schedule tab to keep your data up to date automatically. Trigger on-demand refreshes anytime with the "Run Now" button, and review full execution history and logs after every run.
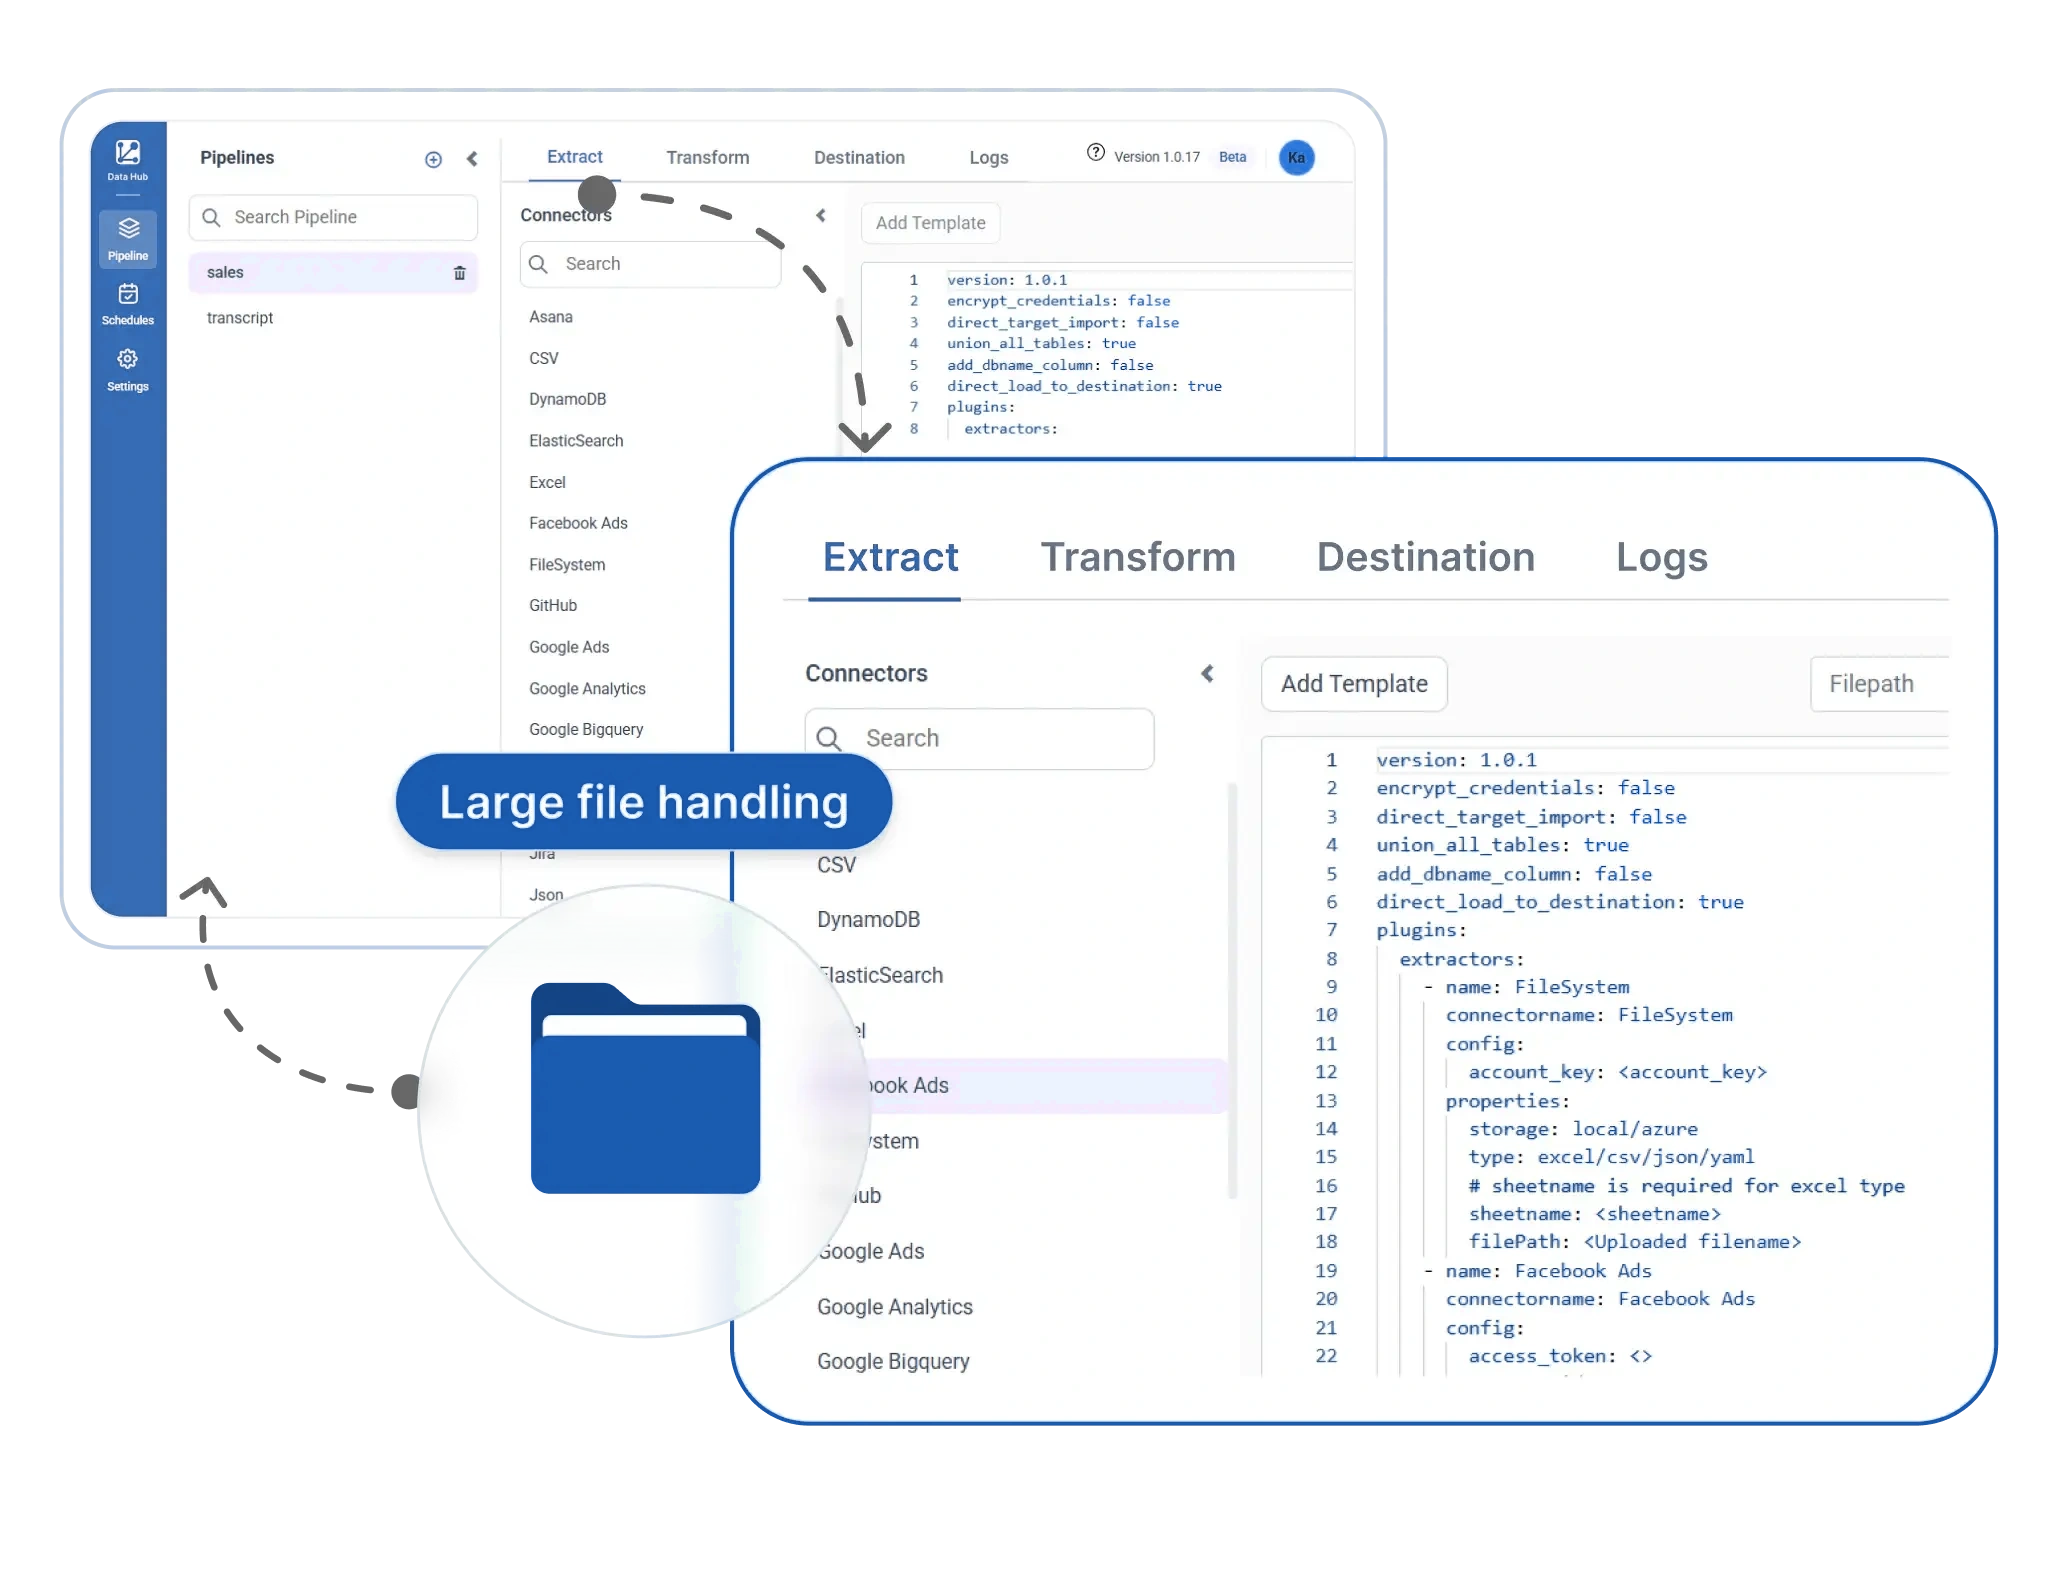
Large File Handling
Move billions of rows from large CSV files quickly and reliably without slowing down your reporting server.Bold Data Hub stages data in DuckDB and bulk-loads it into the destination for fast, reliable transfers.
Connect Multiple Sources in One Pipeline
Bring in data from 25+ sources, including files, web APIs, and SQL and NoSQL databases, in a single pipeline flow. Each connector is configured via a YAML extractor with a select list and optional primary_keys for upsert control.
Prepare Your Data for Reporting with Ease
With Bold Data Hub, you can get your data ready for reporting quickly and without coding. The Transform tab provides a SQL transformation layer for data preparation: write queries against staged DuckDB tables, preview results before saving, and move only clean, structured data to your destination. Have more questions about using Bold Data Hub as your ETL tool for reporting?

Filter and sort your data.
Write SELECT queries with WHERE and ORDER BY clauses to keep only the rows your reports need. Quickly organize, refine, and prioritize relevant information.

Combine sources into one view.
Join tables from multiple databases, files, and services loaded into the same pipeline schema, for example, combining MySQL order records with a CSV product list.

Calculate totals, averages, and more.
Use SQL aggregation functions like SUM, AVG, COUNT, and date_part() to pre-compute KPIs directly in the pipeline, so reports run against summarized data.

Change formats like text to date.
Convert and standardize data types, text to date, integer to decimal, inconsistent strings to normalized values, before data reaches the report layer.

Add new fields with formulas.
Create custom columns using flexible SQL-based formula logic. When primary keys are included in the query, Bold Data Hub upserts existing rows instead of duplicating them.

Use rules to reshape your data.
Drag and drop transform tables to reorder execution sequence and reuse logic across pipelines. Use isDropTable to control whether tables are recreated or preserved.
Flexible Connections. Unified Reporting.
25+ Data Connectors for ETL and Reporting
Connect to 25+ data sources, from files and databases to web services, ready for reporting. Load transformed data into 17 destinations, including data warehouses like Snowflake, Google BigQuery, and Amazon Redshift, plus PostgreSQL, SQL Server, MySQL, and more.
Frequently Asked Questions
Bold Data Hub is the built-in ETL layer inside Bold Reports. It lets you unify data from 25+ sources into one pipeline, transform it using SQL scripts on a staged DuckDB layer, and load clean, structured data into your destination database. Once the pipeline completes, Bold Reports automatically creates a live data source connected to that destination, so report designers can start building immediately, with no manual data source configuration.
No. Bold Reports can connect directly to many data sources. However, using Data Hub helps you prepare and organize your data more efficiently before reporting, particularly when you need to join data from multiple sources, pre-compute aggregations, handle large file ingestion, or schedule automated data refreshes.
Bold Data Hub supports 25+ sources including SQL databases (MySQL, PostgreSQL, SQL Server, Oracle), file formats (CSV, Excel, JSON), REST/Web APIs, and NoSQL data sources. Each source is configured in a YAML pipeline file using a connector template with a select list specifying which tables or endpoints to extract.
You can write SQL queries against staged data in DuckDB, including filters, joins, aggregations using SUM, AVG, COUNT, date_part(), type conversions, and derived column logic. The Transform tab supports multiple transform tables per pipeline, drag-and-drop reordering, primary key configuration for upsert behavior, a live preview, and Save as Draft to preserve work across sessions.
You can store the data in your own environment, whichever destination you configure in the Data Store settings. Supported destinations include Bold IMDB Datastore, PostgreSQL, SQL Server, MySQL, Apache Doris, Snowflake, Oracle, Google BigQuery, Amazon Redshift, ClickHouse, Azure Synapse, StarRocks, MinIO, SAP HANA Cloud, IBM DB2, Firebolt, and Teradata. You can configure multiple destinations of the same type for different environments.
Creating a pipeline in Bold Data Hub automatically creates a data source in Bold Reports, a live connection to the destination database used in the pipeline. Once loaded, the data is accessible in Bold Reports and is ready for use in report design immediately, with no additional configuration required.
Your data is encrypted both in transit and at rest. Pipeline YAML files support credential encryption (encrypt_credentials: true) so passwords are never stored in plain text. Access control, user roles, and audit logs inherited from Bold Reports add extra layers of security. For Windows on-premises deployments, ETL scripts run in a dedicated Python 3.13 environment configured via appsettings.json for isolated execution.
No. The platform is built with a visual pipeline designer and pre-built connector templates, so anyone can build pipelines without writing code. Advanced users can edit YAML configurations and SQL transformation scripts directly for greater control. Python 3.13 is required server-side for on-premises Windows deployments, but this is a one-time setup by IT.
Yes. Bold Data Hub includes interval-based ETL scheduling, on-demand "Run Now" execution, full run history and logs, large file handling (billions of rows via Parquet bulk upload), multi-source pipeline support (25+ connectors), multi-destination loading (17 destination types), primary key and upsert configuration, DuckDB-based staging for transformation preview, and shared single sign-on across Bold Data Hub, Bold Reports, and Bold BI.
Try Bold Data Hub Today
Build smarter reports with structured, high-quality data delivered exactly when and where you need it. Set up your first ETL pipeline in minutes, extract from 25+ sources, transform with SQL, and load into your reporting environment automatically.
No credit card required.