JavaScript Report Designer, also known as JavaScript Report Builder, is a feature-rich component for creating SSRS RDL and RDLC reports effortlessly. Connect to data sources, and create datasets, queries, interactive parameters, and subreports. Using report items like charts, grids, and more, create visually appealing paginated reports without coding. Access control allows tailored permissions for secure reporting.
What you can do with JavaScript Report Designer
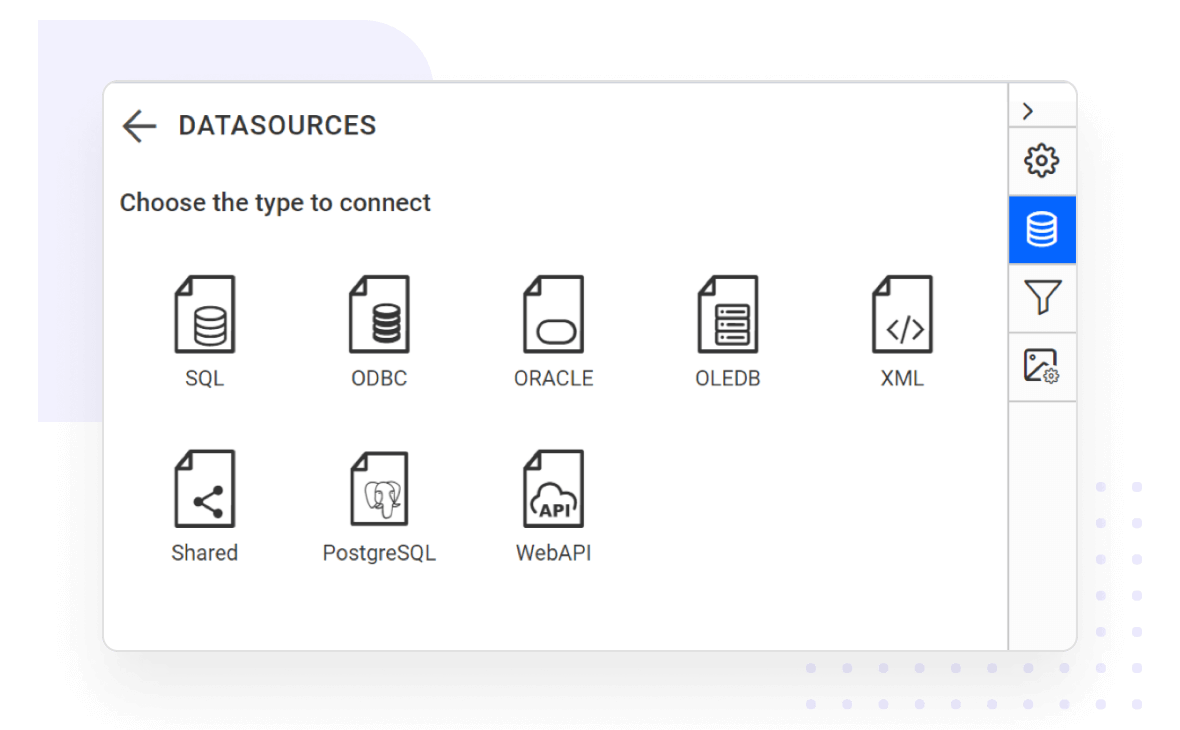
Connect to any data source
Consume data from a wide variety of data providers in local or server databases:
Built-in data sources:Microsoft SQL Server, Microsoft SQL Azure, Web API, OData, PostgreSQL, MySQL, MariaDB, MemSQL, JSON, XML, CSV, Excel, Oracle, OLEDB, and ODBC.
Business object data sources:IList, DataSet, and DataTable.
Custom data processing extensions:MySQL, SQLite, PostgreSQL, and more.
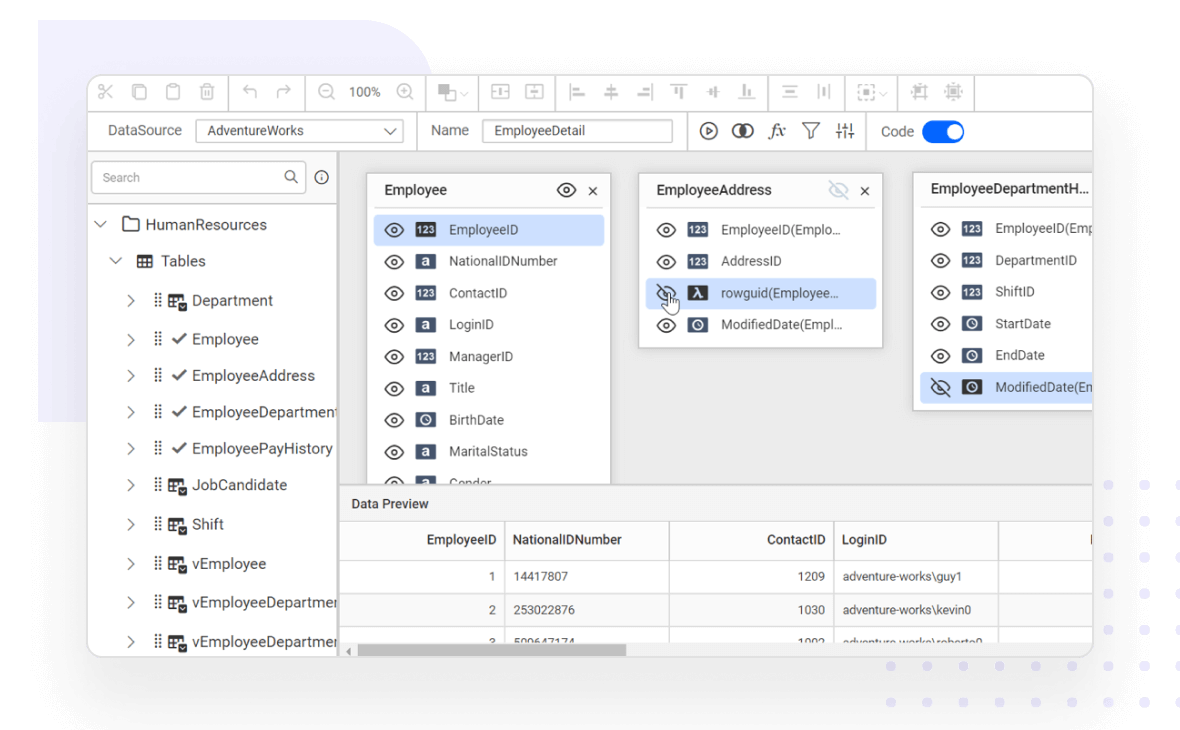
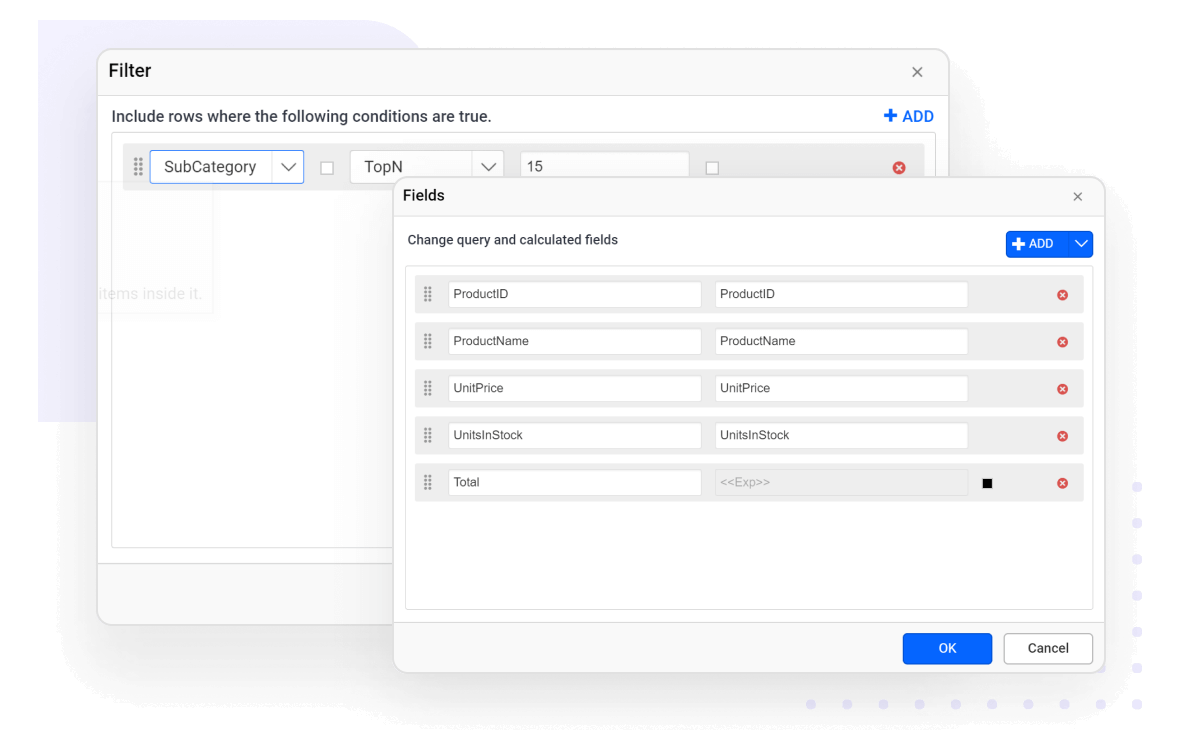
Create data models with an easy-to-use query builder
Data query preparation is time consuming , but with our JavaScript Report Designer, query generation can be done with a few clicks. The easy-to-use drag-and-drop query builder helps both technical and nontechnical users to create and view relationships between tables.
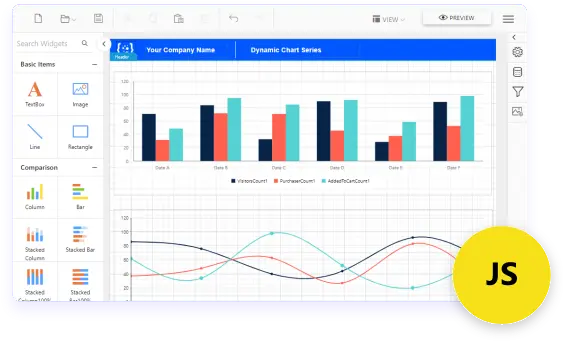
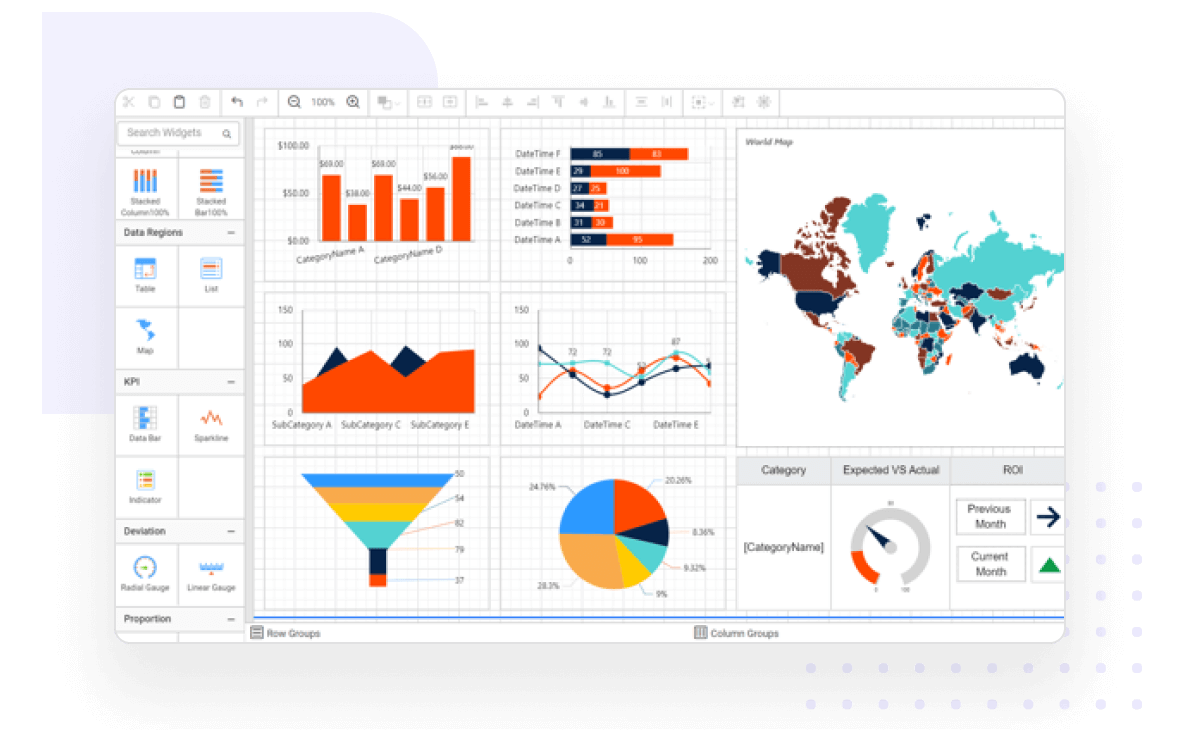
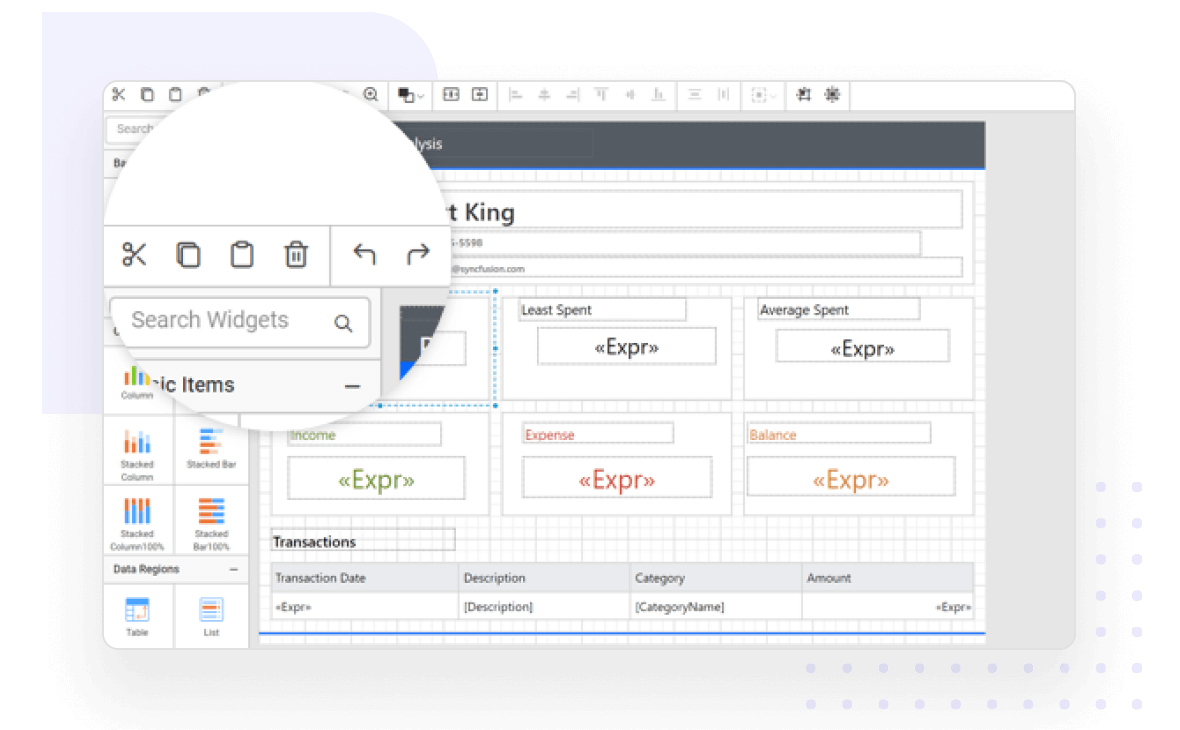
The JavaScript Report Designer allows you to easily transform your data into beautiful reports. The WYSIWYG user interface allows the report to be edited in the same form it is printed or displayed. Furthermore, you can easily edit a report with mouse, touchscreen, or keyboard interfaces.
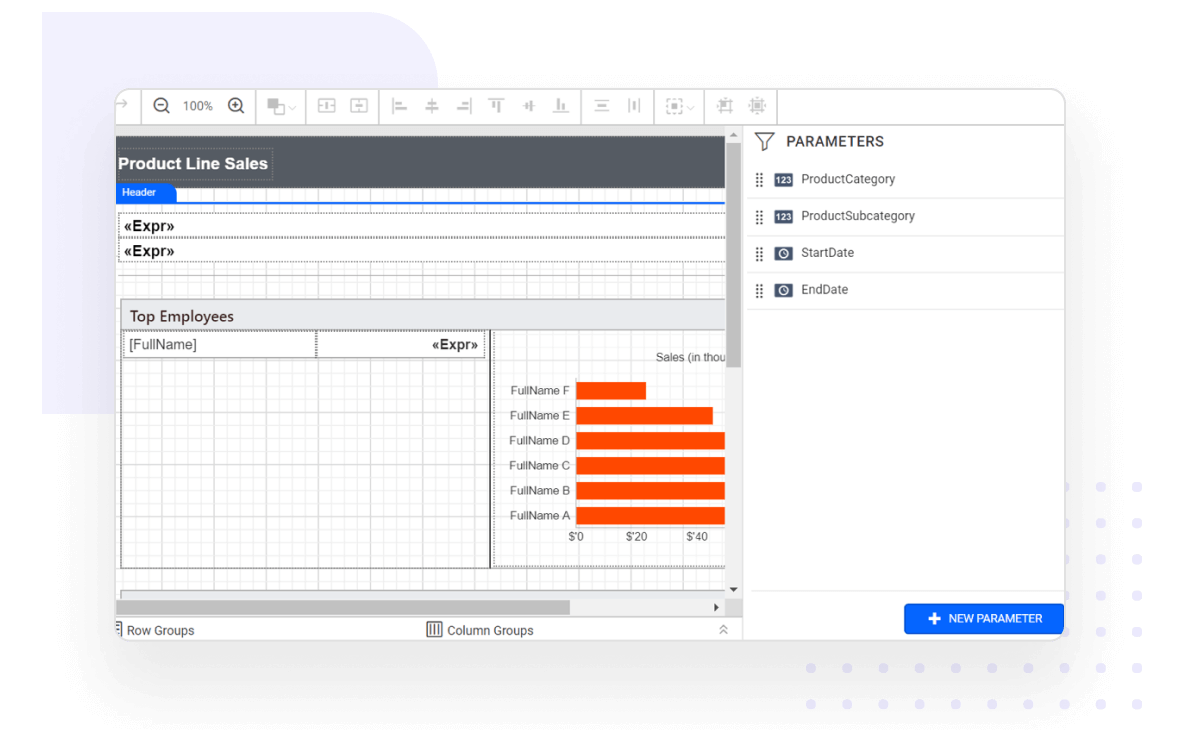
Parameters are the most widely used functionalities to interact with an RDL/RDLC report at runtime. The following parameter types allow you to modify the data presentation to provide an enhanced user experience:
Display data in data regions that support user interactivity at runtime with features like drill down, drill through, hyperlinks, bookmarks or anchors, document map, subreports, and nested data regions.
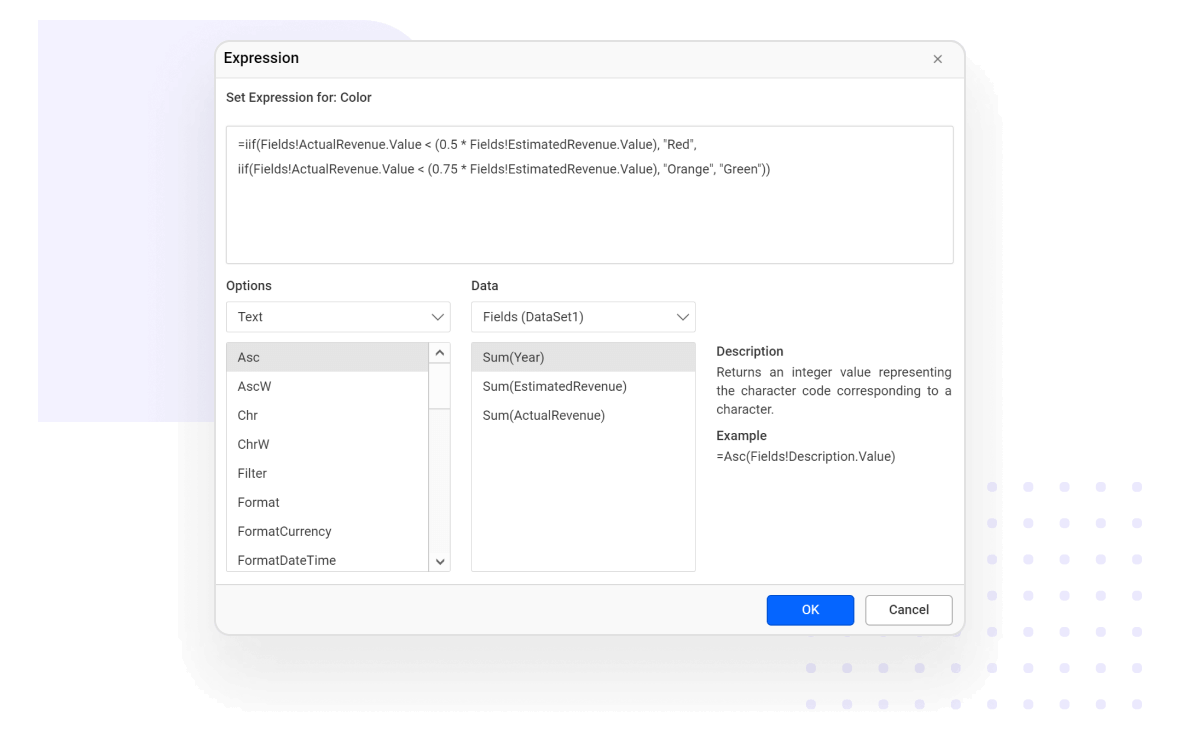
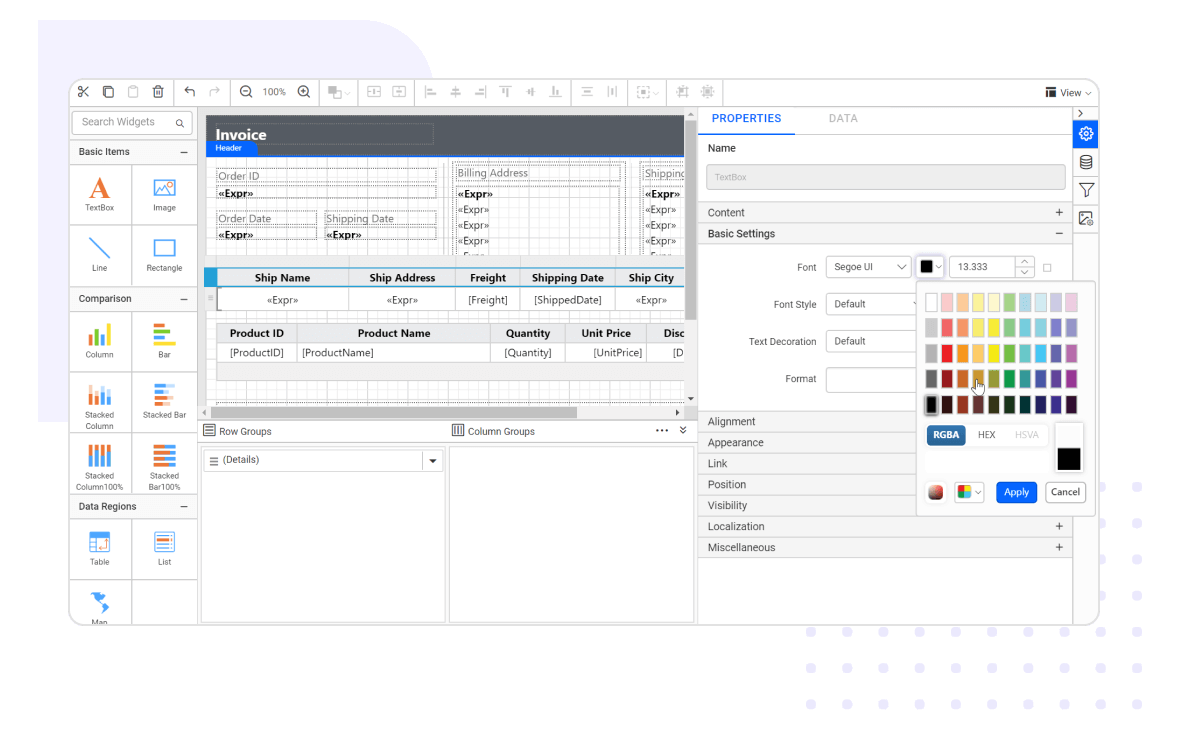
The JavaScript Report Designer provides an expression builder that allows you to create simple and complex RDL expressions. Expressions are used throughout report definition to control the content or appearance of a report.
Set dynamic values to any properties such as color, font, and more.
Create additional operations such as mathematical computations, conditional formatting, conversions, and more.
Use constants, built-in fields, parameters, fields, data sets, variables, operators, common functions, and more.
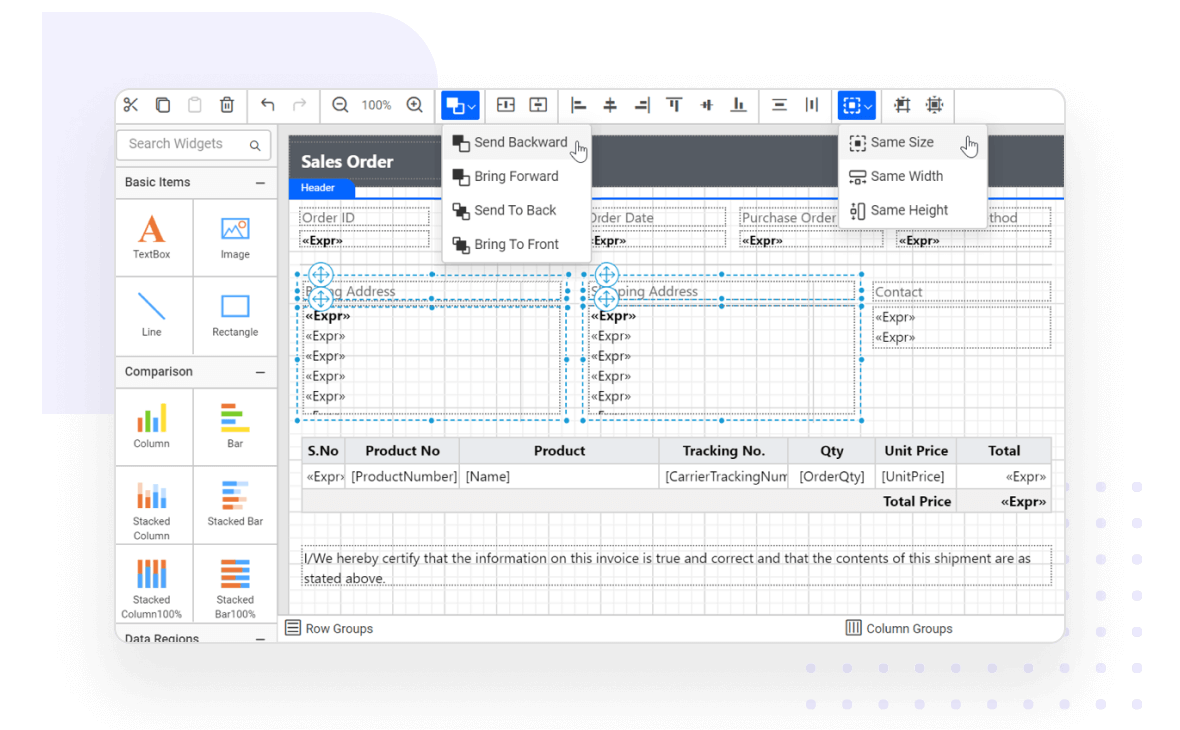
Editing a report and its report items is simple with support for basic editing operations such as cut, copy, paste, undo, and redo.
View reports
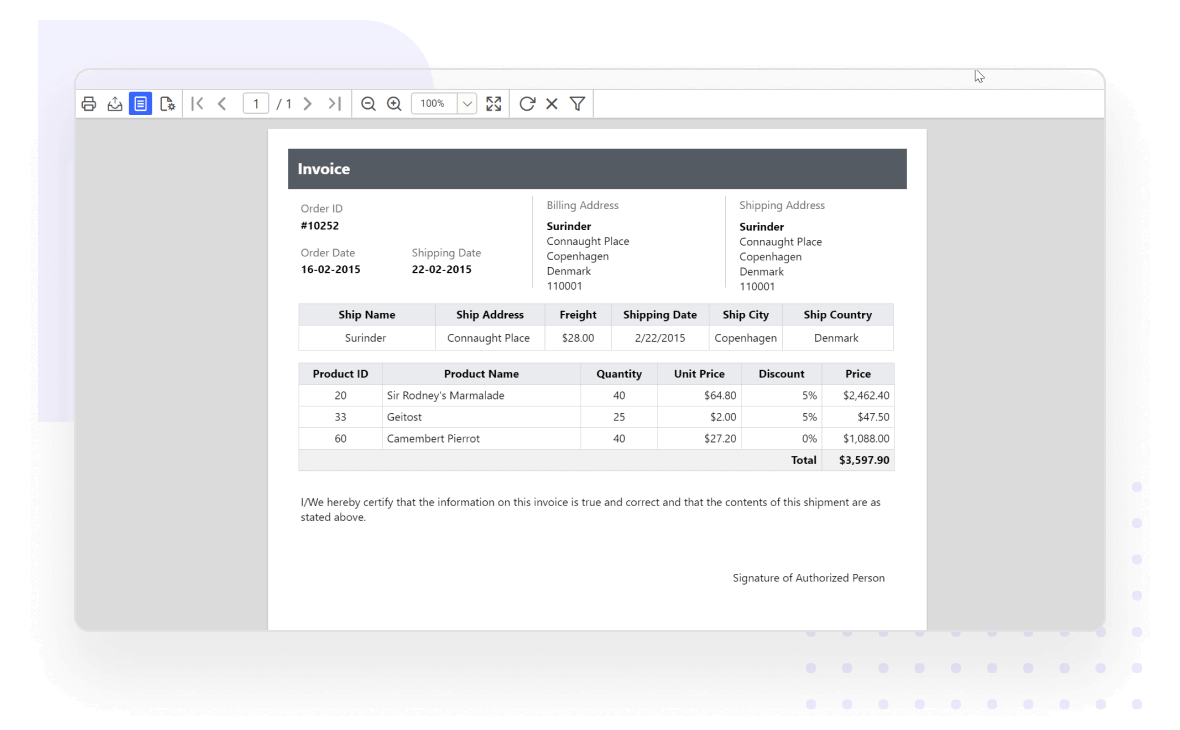
The WYSIWYG Report Designer provides an option to preview reports and verify whether the created report displays what you require. The reports are displayed using the HTML5/JavaScript Report Viewer.
Provides support to set up print options like paper size, margins, and orientation of the printable output and preview the result.
Print and export
Effortlessly print and export report contents by just clicking the print/export option in the toolbar. The most popular file formats are supported, including PDF, Word, Excel, CSV, PowerPoint, XML, and HTML.
Save and share reports
The HTML5/JavaScript Report Designer allows you to save reports to Bold Report Server or SSRS Report Server, and to your computer in the Microsoft RDL standard. Publishing a report to the server allows other users who have permission to access the server to view it.
Users can open and edit any SSRS RDL/RDLC report that is already created. The edited report can be previewed and saved to the same or a different location.
You have control over all UI elements—toolbar, widget panel, parameter block, page, and dialogs—and behaviors of the HTML5 JavaScript Report Designer. It provides the best user experience through a rich set of developer-friendly APIs.
Pixel-perfect built-in themes are available in Material, Bootstrap, and Fabric designs. In addition, the library comes with an accessible high-contrast theme.
Globalization and localization
Easily build applications to be used by a global audience in various languages using culture settings and by localizing static text.
Bold Reports helps you meet key security and compliance standards. All activity logs are safely stored, can’t be changed, and are easy to export when needed.
Bold Reports helps you meet key security and compliance standards. All activity logs are safely stored, can’t be changed, and are easy to export when needed.