Overview of Basic SSRS Report Items

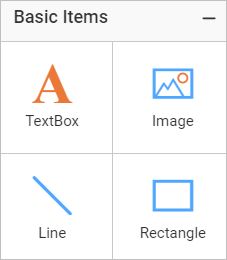
Report items are used to display visual information to the end user in reports. When we design a report, we use report items to convert the raw data into meaningful visual information. Each report item has a unique way of representing data visually. You can drag and drop the report items directly from the item panel into the design surface in the Bold Reports Designer. Another way is to right-click inside the design surface and use the Insert option to add the desired report items directly to the design surface.
The basic report items in the Reports Designer help you design reports with better visualizations, even though they are quite simple. In this blog post, we are going to walk through the basic SSRS report items in the Report Designer.
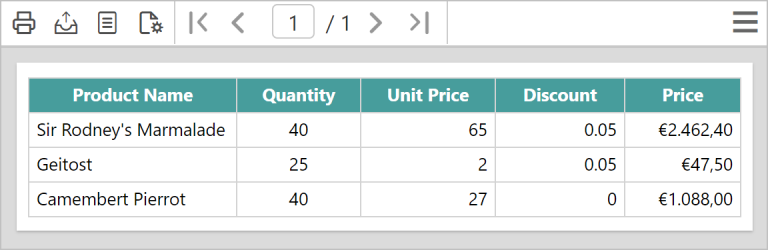
Text box
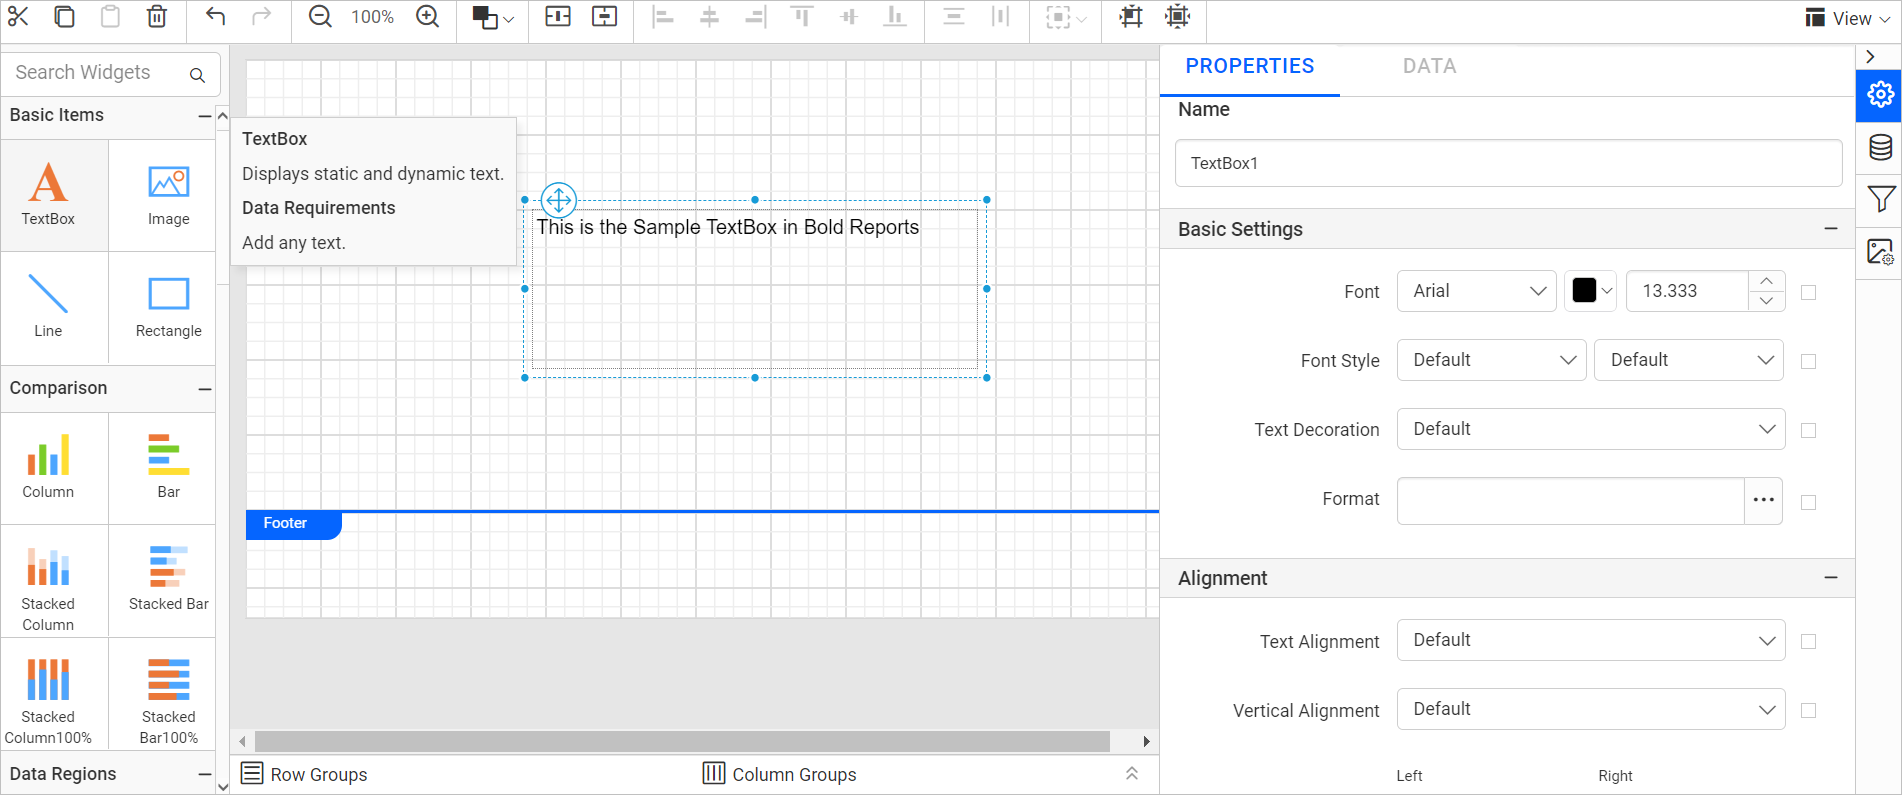
The text box report item is used to display text on a report. The text can be either static or dynamic. Static text can be a title, description, or label. Dynamic text is based on an expression. Every cell in a tablix or matrix is also a text box. Additionally, you can format the text in stand-alone text boxes.
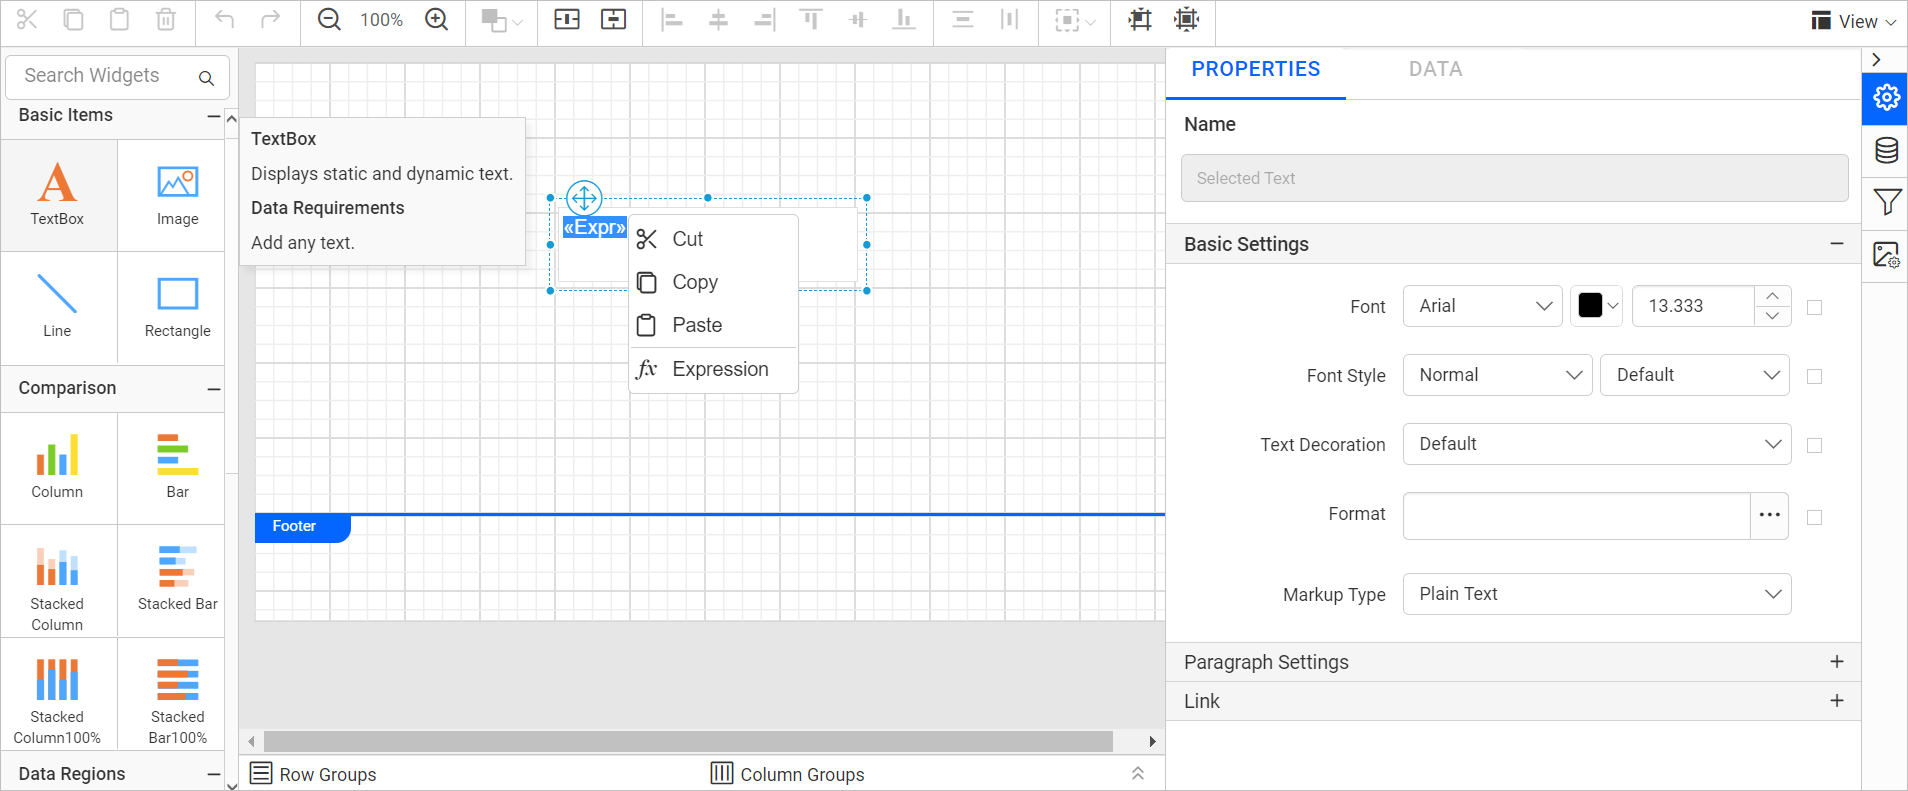
You can add an expression inside a text box by right-clicking inside of it and selecting Expression from the context menu as shown in the following screenshot.
Note: This article provides a step-by-step demonstration on how to use expressions in Report Designer.
Text formatting
You can use text formatting to enhance the presentation of information and improve the report design. You can also format an entire text box or specific fields within a text box. Refer to this documentation to learn more about formatting data in the designer.
Note: For more information about formatting options, refer to this blog post.
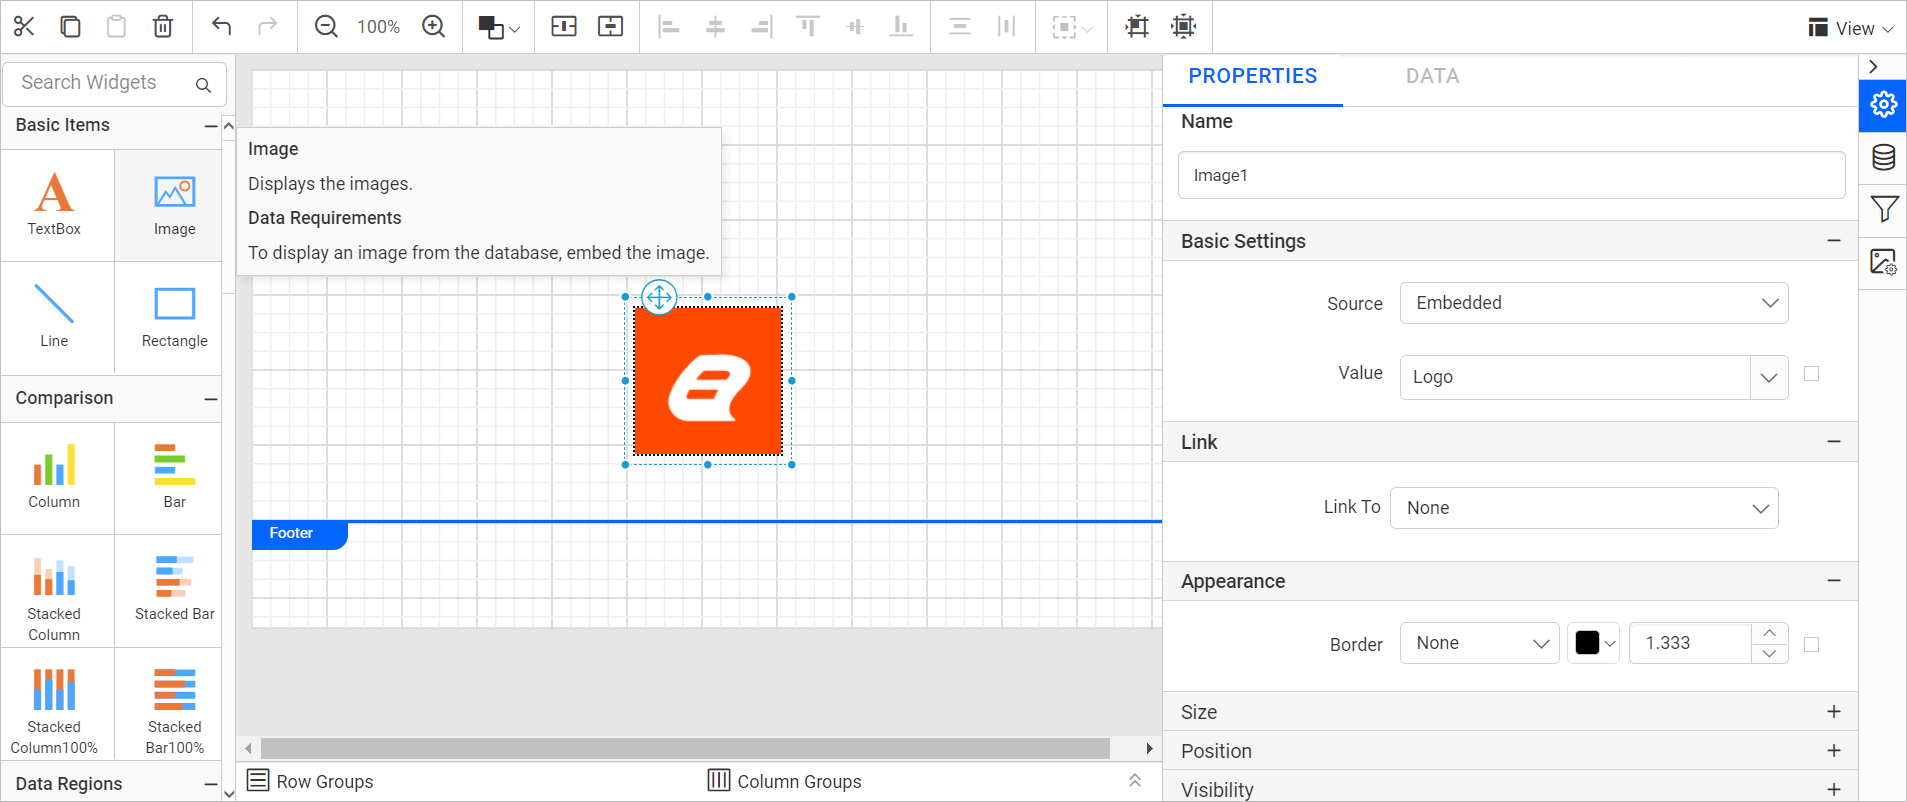
Image
The image report item is used to display images in a report. Images are most commonly used to include a logo in a report. The image in the report item can be displayed directly from a database, link, or an embedded image. You can also use an image as a background for certain reports.
You can display embedded images from the Image Manager, which allows you to embed local images in a report.
We have published a separate blog post that goes into detail about adding the image report item, and you can check it out here.
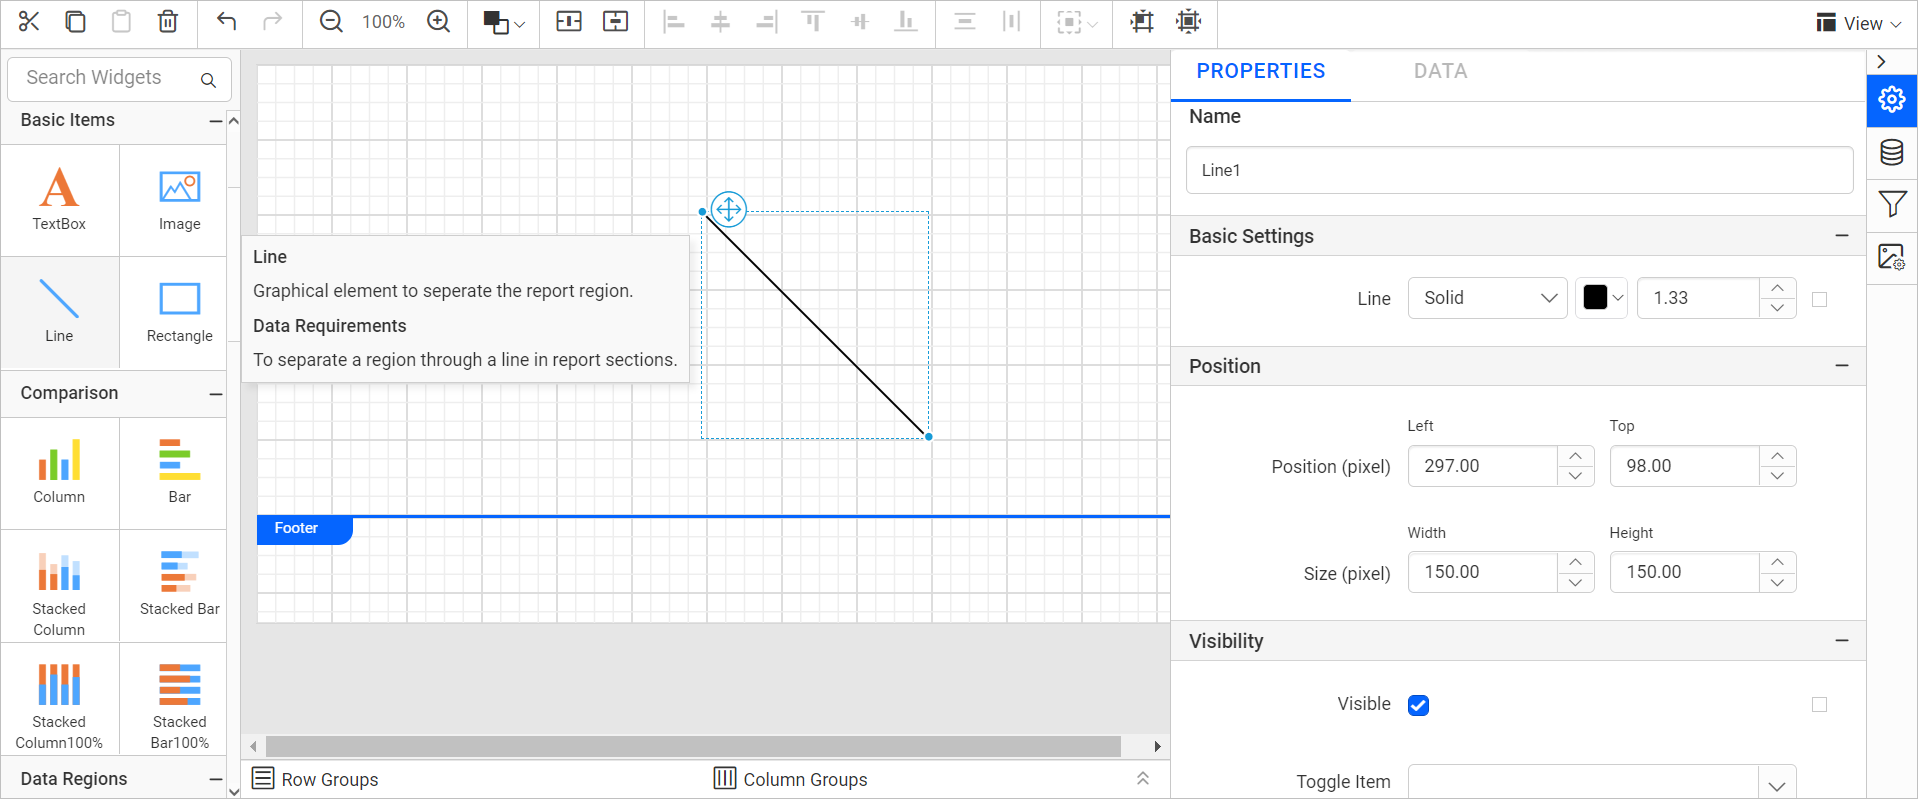
Line
The line report item is a graphical element defined by start and end points that can have various styles assigned to it. It allows the report sections to be separated horizontally, vertically, or diagonally.
The line report item cannot have any data or values assigned to it. Because the line report item is flexible, you can alter the line’s direction by moving the start and end points.
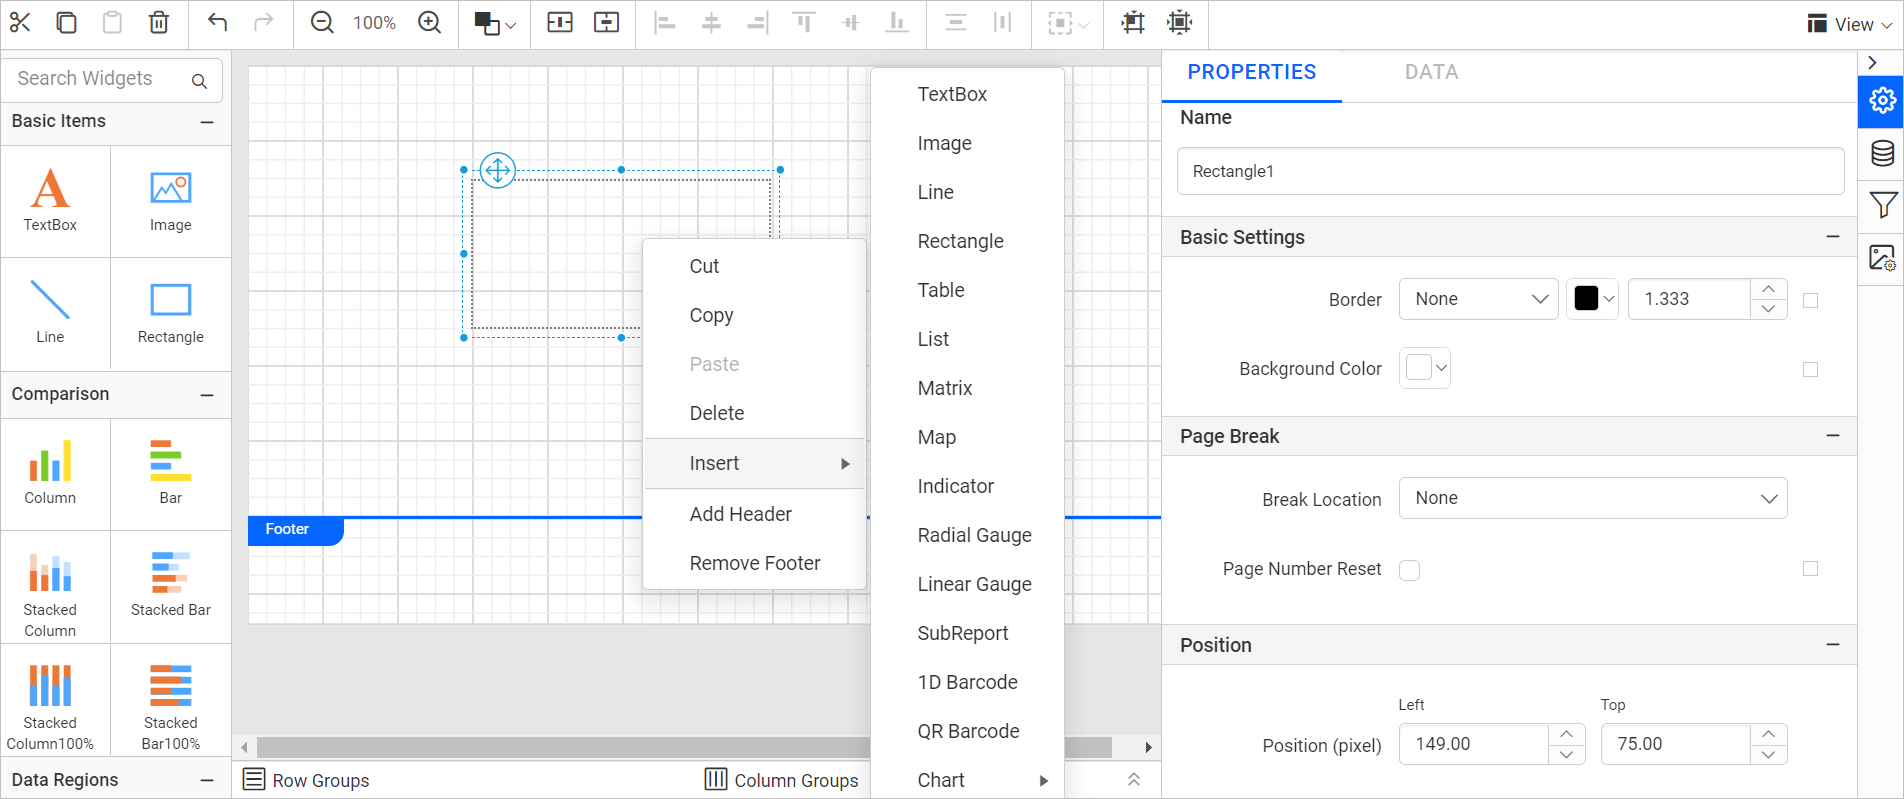
Rectangle
The rectangle report item is a graphical container element that acts as a parent container for other report items. You can drag and drop the rectangle report item from the item panel into the design surface and add report items like text box, chart, table, or image inside of it. In addition, you can customize the border and background colors for the rectangle report item using Properties panel under Basic Settings category.

You can use the Insert option to add report items inside the rectangle as shown in the following screenshot.
Conclusion
In this blog post, we discussed the basic items in the Bold Reports Designer. We hope this blog provided you a clear idea of the purposes of the basic report items and the ways they can be used to display information. To explore the items further, check out our sample reports and Bold Reports® Documentation.
If you have any questions, please post them in the comments section below. You can also submit questions through our Contact Us page, or if you already have an account, you can log in to submit them. Bold Reports now comes with a 30-day free trial with no credit card information required. We welcome you to start a free trail and experience Bold Reports for yourself. Give it a try and let us know what you think!
Stay tuned to our official Twitter, Facebook, LinkedIn, Pinterest and Instagram pages for announcements about upcoming releases.