
Pixel-Perfect Reporting Software
Pixel-Perfect Paginated Reporting Software for Modern Enterprises
Bold Reports is pixel-perfect paginated reporting software for enterprises and application developers. Pixel-perfect reporting produces fixed-page documents in which every element appears exactly as designed. Create, automate, embed, and distribute pixel-perfect reports, invoices, financial statements, customer statements, and operational documents. Every report appears exactly as designed, across PDF, print, web, and export formats. New to the term? Read what a paginated report is.
Trusted for document-quality reporting by enterprise teams
Companies using Bold Reports








Understand the challenge
Why do pixel-perfect reports lose formatting when exported?
Business reports often lose formatting when exported, printed, or shared across systems. Misaligned tables, inconsistent page breaks, and broken layouts can impact readability, compliance, and professionalism.
The industry reality
40%+
of enterprise reporting still requires pixel-perfect paginated formats
Finance, healthcare, government, and manufacturing sectors depend on precise, print-ready document output, not dashboards.
Time wasted
Hours Lost
fixing report layouts manually every reporting cycle
Reformatting, realigning, and re-exporting reports that should have been right the first time.
The real risk
Loss of Trust
in report accuracy when formatting errors go unnoticed
Misaligned data, broken tables, and inconsistent layouts erode confidence in business-critical reports.
Common reporting problems
Reports lose formatting when exported to PDF or Excel
Page breaks appear in wrong places on print
Different output on screen vs print vs email
Manual reformatting required every reporting cycle
No consistent branding across all report types
Compliance documents fail audit due to layout errors
Bold Reports solution
Pixel-perfect formatting preserved across PDF, print, and web
Full control over page breaks, margins, and pagination
Identical output across every format and device
Reusable templates eliminate manual reformatting
Brand-consistent layouts with custom logos, fonts, and colors
Audit-ready documents with complete version history
Build your solution
Build Pixel-Perfect Reports Your Way
Bold Reports gives you full control over every aspect of your reporting, from connecting your data and designing pixel-perfect layouts to embedding reports directly into your applications.
Connect to your business data
Connect pixel-perfect reports to multiple data sources. Complex queries, parameter-driven reports, and dynamic data bindings are supported for business reporting.
- SQL Server
- Oracle
- PostgreSQL
- MySQL
- Azure SQL
- BigQuery
- Snowflake
- MongoDB
- REST APIs
- Amazon RDS
Create pixel-perfect reports
Build highly formatted reports with an intuitive WYSIWYG designer. Customize layouts, typography, colors, logos, charts, and branding. No coding required. Real-time preview included.
- Tables & Matrices
- Charts & Graphs
- KPIs & Indicators
- Barcodes & QR Codes
- Maps & Geo Visuals
- Subreports
- Pixel-Level Positioning
- Interactive Parameters
Embed pixel-perfect reports in any app
Integrate pixel-perfect reports directly into business applications, customer portals, and internal tools. Users view and interact with reports without leaving the application.
Export-ready formats
- PDF (exact layout preserved)
- Excel (editable, formatted)
- Word (editable document)
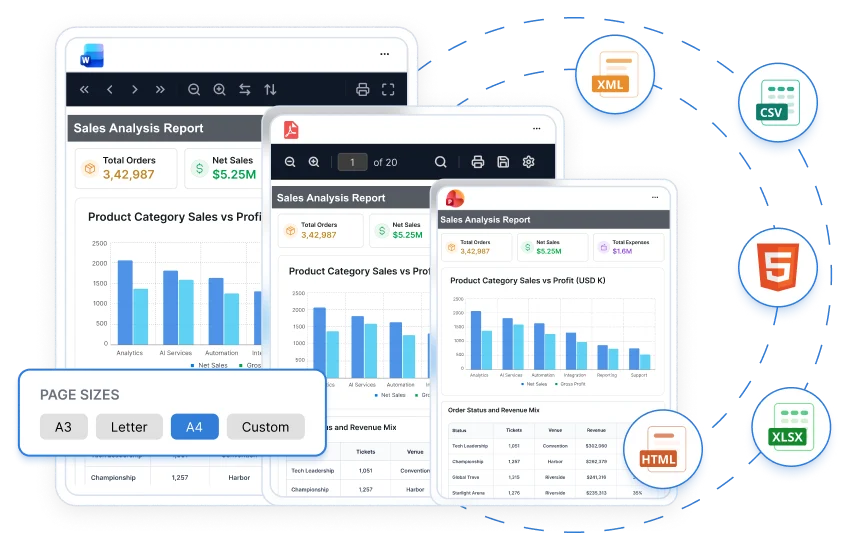
- PowerPoint, CSV, XML, HTML
Eliminate manual processes
Replace manual Excel workflows with pixel-perfect reporting automation
Stop spending hours on spreadsheets. Bold Reports automates your entire reporting cycle, from generation and scheduling to delivery and archiving.
Many organizations still spend valuable time updating spreadsheets, formatting reports manually, and distributing files every reporting cycle. Bold Reports replaces spreadsheet-driven processes with centralized pixel-perfect report generation, reusable templates, and automated scheduling.
- Reduce manual reporting effort- less time spent building and fixing reports by hand
- Eliminate repetitive Excel work- no more copy-paste, formatting
- Improve reporting accuracy- no manual data entry errors
- Maintain consistent report layouts- every report looks professional
- Scale reporting across teams- handle growing report volume without adding headcount
- Schedule reports automatically- daily, weekly, monthly, or by trigger
- Deliver via email, FTP, or cloud storage- SharePoint, OneDrive, AWS S3
- Personalized reports per recipient- each user sees their own data
- Audit logs and compliance tracking- complete trail for every report
Old way: manual Excel
- Significant analyst time spent every cycle
- Multiple versions circulating
- Formula errors and manual mistakes
- No version history
- Customers complain about delays
Bold Reports way
- Fast initial setup, minimal upkeep after that
- Consistent formatting every time
- Zero manual errors
- Complete audit trail and version history
- Reports delivered on a set schedule
7
Export formats - PDF, Excel, Word, PPT, CSV, XML & HTML
4+
Standard page sizes - A4, A3, Letter, Legal, plus custom
99.9%
Uptime SLA for enterprise-grade pixel-perfect reporting
Use cases
Pixel-perfect reporting across every industry
Bold Reports is a complete pixel-perfect reporting platform that supports internal business reporting and customer-facing reporting experiences across financial services, healthcare, manufacturing, government, and SaaS industries.
Financial reporting
Generate pixel-perfect P&L statements, balance sheets, account summaries, audit reports, and regulatory filings with complete layout control.
Operational reporting
Monitor business performance using structured pixel-perfect reports for inventory, production metrics, resource utilization, and operational KPIs.
Customer reporting
Deliver pixel-perfect invoices, account statements, billing summaries, and usage reports with consistent branding and professional presentation.
Compliance reporting
Create standardized pixel-perfect compliance reports for governance, audits, and regulatory requirements with complete version history.
Healthcare reporting
Generate pixel-perfect reports for patient records, billing documents, and operational summaries, with role-based access controls to restrict who can view them.
Manufacturing reporting
Create pixel-perfect production reports, inventory reports, shipping documents, and quality control reports with exact specifications.
Make your choice
How Bold Reports compares to other reporting approaches
Organizations evaluating reporting approaches need modern deployment options, embedded reporting, report automation, and enterprise scalability. The table compares categories of tools, not named products, as of October 2026. Capabilities vary by product and edition; check each vendor's current documentation. Bold Reports delivers all of this in a single platform, unlike legacy desktop reporting tools or basic BI dashboard tools.
| Feature | Legacy Desktop Reporting Tools | Basic BI Dashboard Tools | Bold Reports |
|---|---|---|---|
| Pixel-perfect reporting | Full | — | Full |
| Paginated reports | ✓ | — | ✓ |
| RDL format support | Partial | — | Full |
| Web-based designer | — | ✓ | Included |
| Cloud deployment | Limited | ✓ | Supported |
| Linux deployment | — | Limited | Supported |
| Embedded reporting | Limited | Limited | Full |
| React / Angular support | — | Limited | ✓ |
| Multi-tenant reporting | — | Custom | Built in |
| White-label support | — | Limited | Built in |
| Report automation | Limited | Limited | Included |
| Modern REST APIs | — | ✓ | ✓ |
| No per-developer licensing | — | — | ✓ |
| Active development | Maintenance | Continuous | Continuous |
Get answers
Frequently Asked Questions
What is pixel-perfect reporting?
Pixel-perfect reporting creates highly formatted reports where every element, text, images, charts, tables, margins, page breaks, appears exactly as designed across print, PDF, and digital formats. Bold Reports delivers this with a WYSIWYG designer, real-time preview, pixel-level accuracy, and zero formatting loss across all export formats.
What is a paginated report?
A paginated report is organized into fixed pages with defined layouts, headers, footers, page numbers, and controlled page breaks. Bold Reports provides drag-and-drop paginated report design, multi-page document support, print-ready output, and automated scheduling for professional document distribution.
How is pixel-perfect reporting different from dashboards?
Pixel-perfect reports focus on formatted document output for printing, archiving, and compliance. Dashboards focus on interactive visualizations and real-time monitoring. Bold Reports handles the pixel-perfect reporting layer, while dashboards are served by platforms like Power BI or Tableau.
Can I migrate SSRS reports to Bold Reports?
Yes. Bold Reports provides native RDL and RDLC support, and most reports need little to no rework. It includes a web-based designer, modern REST APIs, and cloud, on-premises, and hybrid deployment. Embedded reporting is available for React, Angular, and Blazor, and SSRS migration guides are built in. Migration support is included.
Does Bold Reports support RDL files?
Yes. Bold Reports fully supports RDL (Report Definition Language) format with complete import/export capability. Upload existing SSRS RDL files directly and use them without modification, while gaining cloud deployment, web-based design, and embedding capabilities.
Can I embed reports in React applications?
Yes. Bold Reports provides React report components with hooks, a full report viewer with filtering, search, export, and drill-down, white-label UI customization, row-level security, and RBAC. It also supports Angular, Blazor, ASP.NET Core, Vue.js, JavaScript SDK, and Java/Node.js APIs.
Can reports be exported to PDF and Excel?
Yes. Bold Reports exports to PDF with pixel-perfect formatting preserved, Excel with formulas, Word, HTML, CSV, PNG/JPEG, JSON, and XML, with batch export, conditional export, and encryption for sensitive documents.
Does Bold Reports support multi-tenant reporting?
Yes. Bold Reports provides multi-tenant architecture with complete data isolation, per-tenant customization, white-labeling, role-based security, automated tenant provisioning via API, and scalability for hundreds or thousands of tenants. Ideal for SaaS platforms, ISVs, and enterprise multi-division deployments.
Is Bold Reports a Crystal Reports alternative?
Yes. Bold Reports provides web-based design, cloud-native architecture for AWS, Azure, and Google Cloud, embedded reporting for React, Angular, and Blazor, modern REST APIs and JavaScript SDKs, multi-tenant support, white-label capabilities, and lower total cost of ownership. For Crystal Reports support dates, see the Bold Reports Crystal Reports End of Life page.
What industries use pixel-perfect reporting?
Pixel-perfect reporting is essential across financial services, healthcare, manufacturing, retail, government, insurance, and SaaS. Bold Reports serves these industries with role-based access controls and scalable report automation for enterprises requiring document accuracy and audit trails.
Which tools can create pixel-perfect paginated reports?
Bold Reports creates pixel-perfect paginated reports with a web-based WYSIWYG designer, real-time preview, and pixel-level positioning. It supports A4, A3, Letter, Legal and custom page sizes, and exports to PDF, Excel, Word, PowerPoint, CSV, XML and HTML for print-ready output. Print-ready output is controlled through page size, margins, and page breaks. Bold Reports also opens existing RDL files, so reports built in other RDL-based tools can be reused. Bold Reports is available as a cloud service or on-premises.
How do I create a paginated report without Visual Studio?
In Bold Reports, a paginated report is built in the browser with the web-based report designer, so Visual Studio is not required. Connect a data source such as SQL Server, Oracle, PostgreSQL or MySQL, add tables and charts to the page, and check the layout in the real-time preview. No coding is required for layout design.
How do I create pixel-perfect reports?
Creating a pixel-perfect report in Bold Reports follows four steps. Connect a data source, lay out tables, charts, and subreports in the WYSIWYG designer, preview the result, and then export, embed, or schedule the report. Page size, margins, and page breaks are set for the whole report, so the layout stays fixed in every export.
Do companies need both a reporting tool and a BI dashboard tool?
Whether a company needs both depends on the outputs it must produce. Bold Reports produces fixed-layout paginated documents for printing, archiving, and compliance, while dashboards focus on interactive exploration and real-time monitoring. A company that needs only formatted documents such as invoices or statements may not need a separate dashboard tool.
When should I use paginated reports and when should I use dashboards?
Use paginated reports when the output is a document, such as an invoice, a statement, or a regulatory filing that must print or export the same way every time. Use dashboards when the goal is interactive exploration of data. Data visualization also works inside paginated reports: Bold Reports includes charts and graphs, KPIs and indicators, and maps inside the report layout, and interactive parameters let viewers choose the data shown.
What is operational reporting?
Operational reporting is the routine production of structured reports on day-to-day activity, such as inventory levels, production metrics, resource utilization, and operational KPIs. Bold Reports supports operational reporting with scheduled pixel-perfect reports delivered by email, FTP, or cloud storage, and with parameter-driven reports that show each recipient their own data.
What are production reports?
Production reports are documents that summarize manufacturing output for a period, such as units produced, inventory movements, and quality results. In Bold Reports, production reports are built as pixel-perfect paginated reports, alongside inventory reports, shipping documents, and quality control reports with exact specifications.
What software creates pixel-perfect financial reports, invoices, and customer statements?
Bold Reports creates pixel-perfect P&L statements, balance sheets, account summaries, and audit reports, as well as invoices, account statements, and billing summaries. For financial statements, Bold Reports provides full control over page breaks, margins, and pagination. The WYSIWYG designer and real-time preview show an invoice as it will print. Reusable templates keep the layout consistent every reporting cycle.
Why do reports look different when exported to PDF and Excel?
Bold Reports addresses export differences by keeping the report layout fixed at design time. It exports PDF with exact layout preserved and Excel as an editable, formatted workbook, and also exports to Word, PowerPoint, CSV, and HTML.
How do I add barcodes, QR codes, or maps to reports?
Bold Reports includes barcode, QR code, and map items in the report designer, alongside tables, matrices, charts, KPIs, and subreports. Step-by-step instructions for each item are in the Bold Reports documentation.
What documents is paginated reporting used for?
Paginated reporting is used for documents that need a fixed layout: invoices, account statements, profit and loss statements, balance sheets, compliance reports, production reports, and shipping documents. Bold Reports generates each of these as pixel-perfect paginated reports.
What are the requirements and limits of pixel-perfect reporting in Bold Reports?
Bold Reports is available as the Cloud Edition and the On-Premises Edition. Every edition includes the same platform with no feature restrictions between editions, as the pricing page states. Reports export to seven core formats in all editions: PDF, Excel, Word, PowerPoint, CSV, XML, and HTML. TXT export is also supported in the Report Viewer, the Report Writer, and the Cloud Edition. Bold Reports focuses on fixed-layout paginated reports, so interactive dashboards and exploratory analytics are a separate job. Crystal Reports files are converted to RDL with a bulk converter utility, and the output needs review afterwards. See Crystal Reports migration.
Which reporting tool works for manufacturing plant monitoring?
Bold Reports builds paginated manufacturing reports for plant activity, machine utilization, downtime trends, shift-level production summaries, inventory, and quality, for recurring operational reviews. The production monitoring report covers output against targets, equipment effectiveness including OEE trends, cycle time, lead time, throughput, and yield. Its RDL file can be downloaded and customized in Bold Reports Designer. Reports can be delivered on a schedule to plant leaders, production teams, and quality managers. See manufacturing reporting. An industrial data analytics company serving chemical, metal, power plant, and oil and gas customers embedded Bold Reports in its application, as its customer story describes. Bold Reports produces fixed-layout reports for periodic review and does not describe a live, streaming plant-floor display.
Which companies use Bold Reports, and where can I read reviews?
Bold Reports customer stories include STM, which generates printable PDF and Word reports from its portal, Si&T, which managed more than 600 RDLC reports in a migration to .NET Core, and an agricultural development company that saves approximately 95% of its manual report generation time. All stories are on the Customer Stories page. Independent reviews are on G2, Capterra, and Software Advice.
Take action
Start building pixel-perfect reports today
Create professional paginated reports, automate report generation, embed reporting into your applications, and modernize your reporting environment with Bold Reports.
No credit card required.