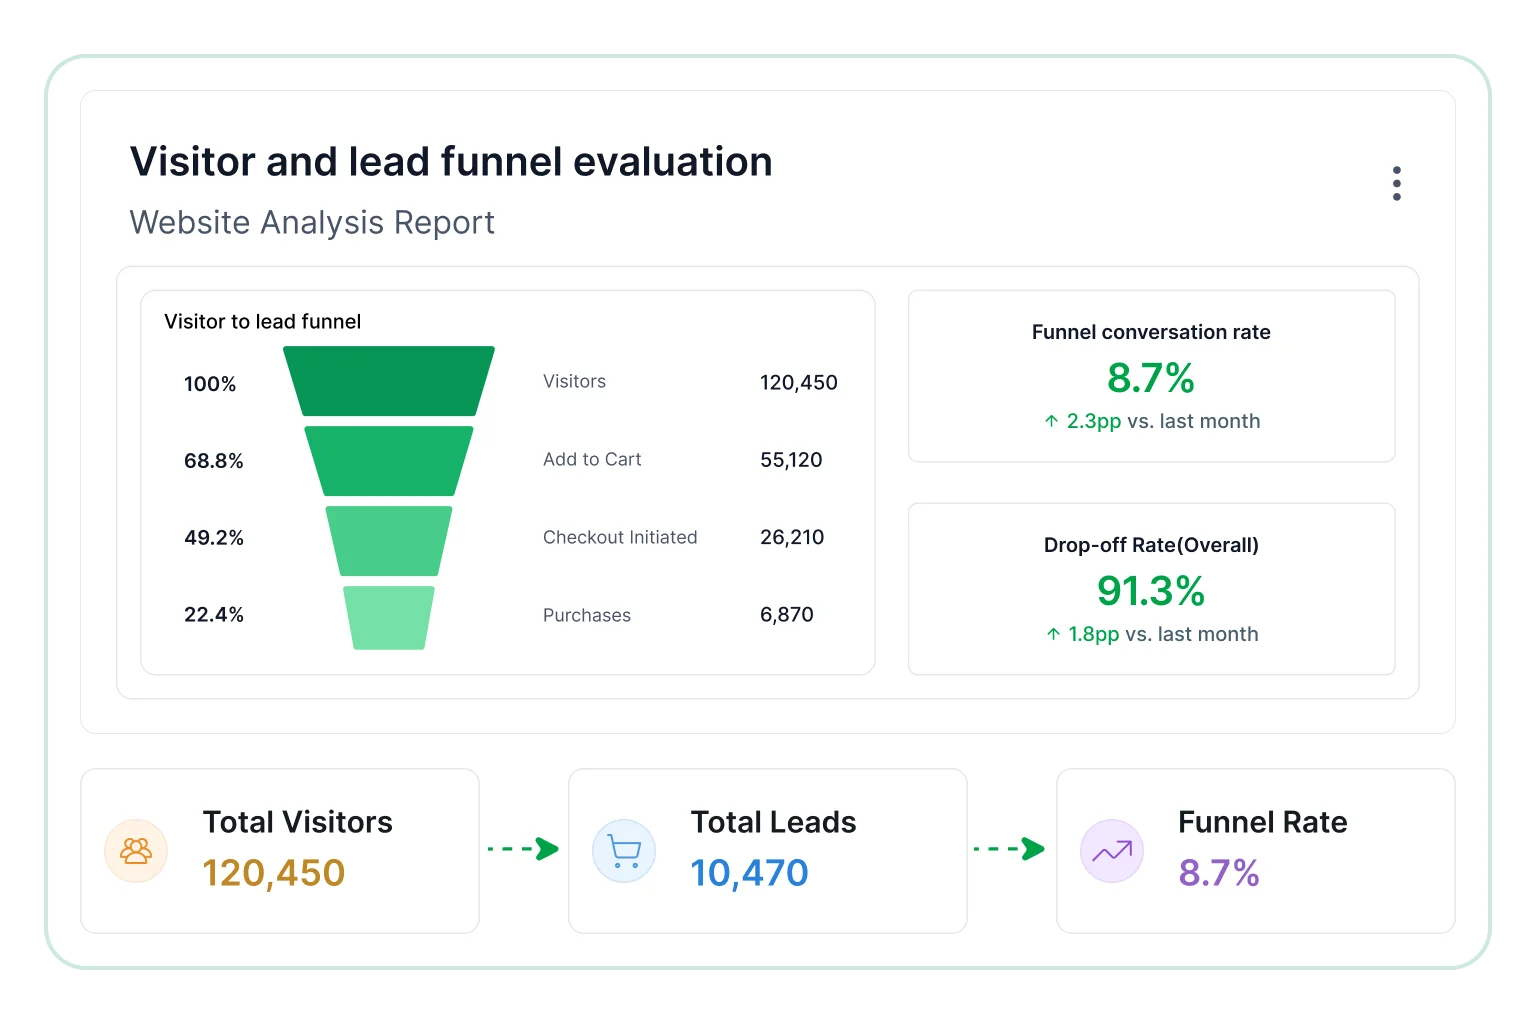
Visitor and lead funnel evaluation
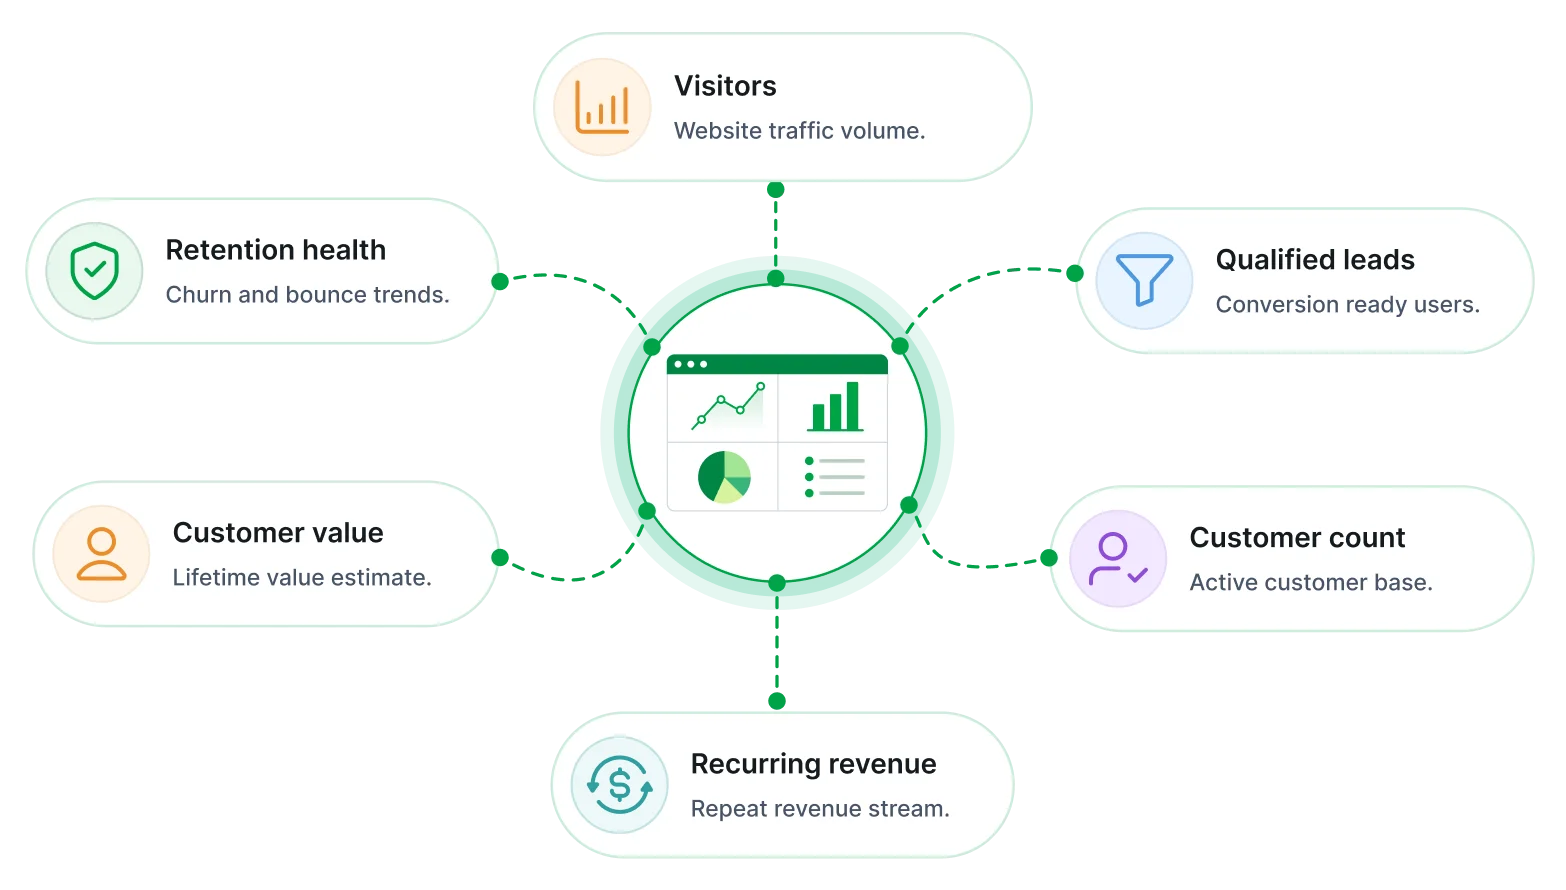
A structured view of how website traffic converts into leads and customers across channels and campaigns.
- Track visitor count alongside generated leads and conversions.
- Evaluate progression from leads to qualified leads and sales.
- Compare conversion efficiency across funnel stages and paths.
- Identify drop-off points in the user journey and conversion flow.
- Analyze alignment between traffic and acquisition outcomes over time.
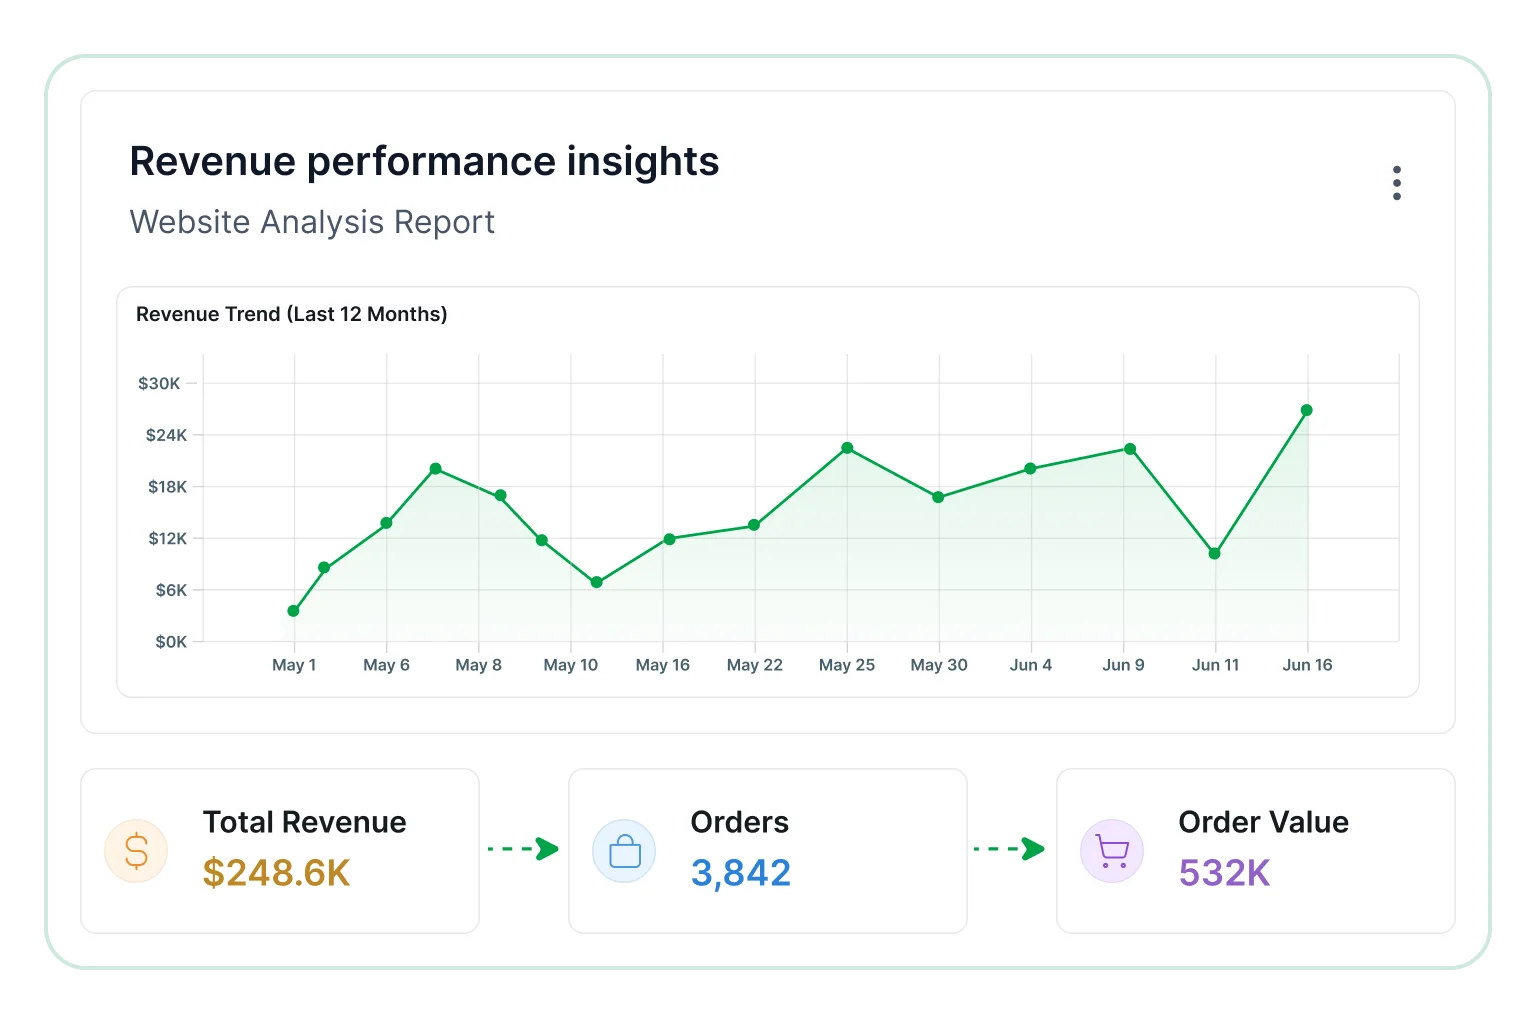
Revenue performance insights
Designed to interpret financial outcomes generated through the website and support better decisions.
- Track monthly recurring revenue trends and subscription growth.
- Evaluate annual recurring revenue contribution across segments.
- Compare gross transaction volume across periods and markets.
- Identify revenue growth or decline patterns in each channel.
- Analyze monetization effectiveness across products and plans.
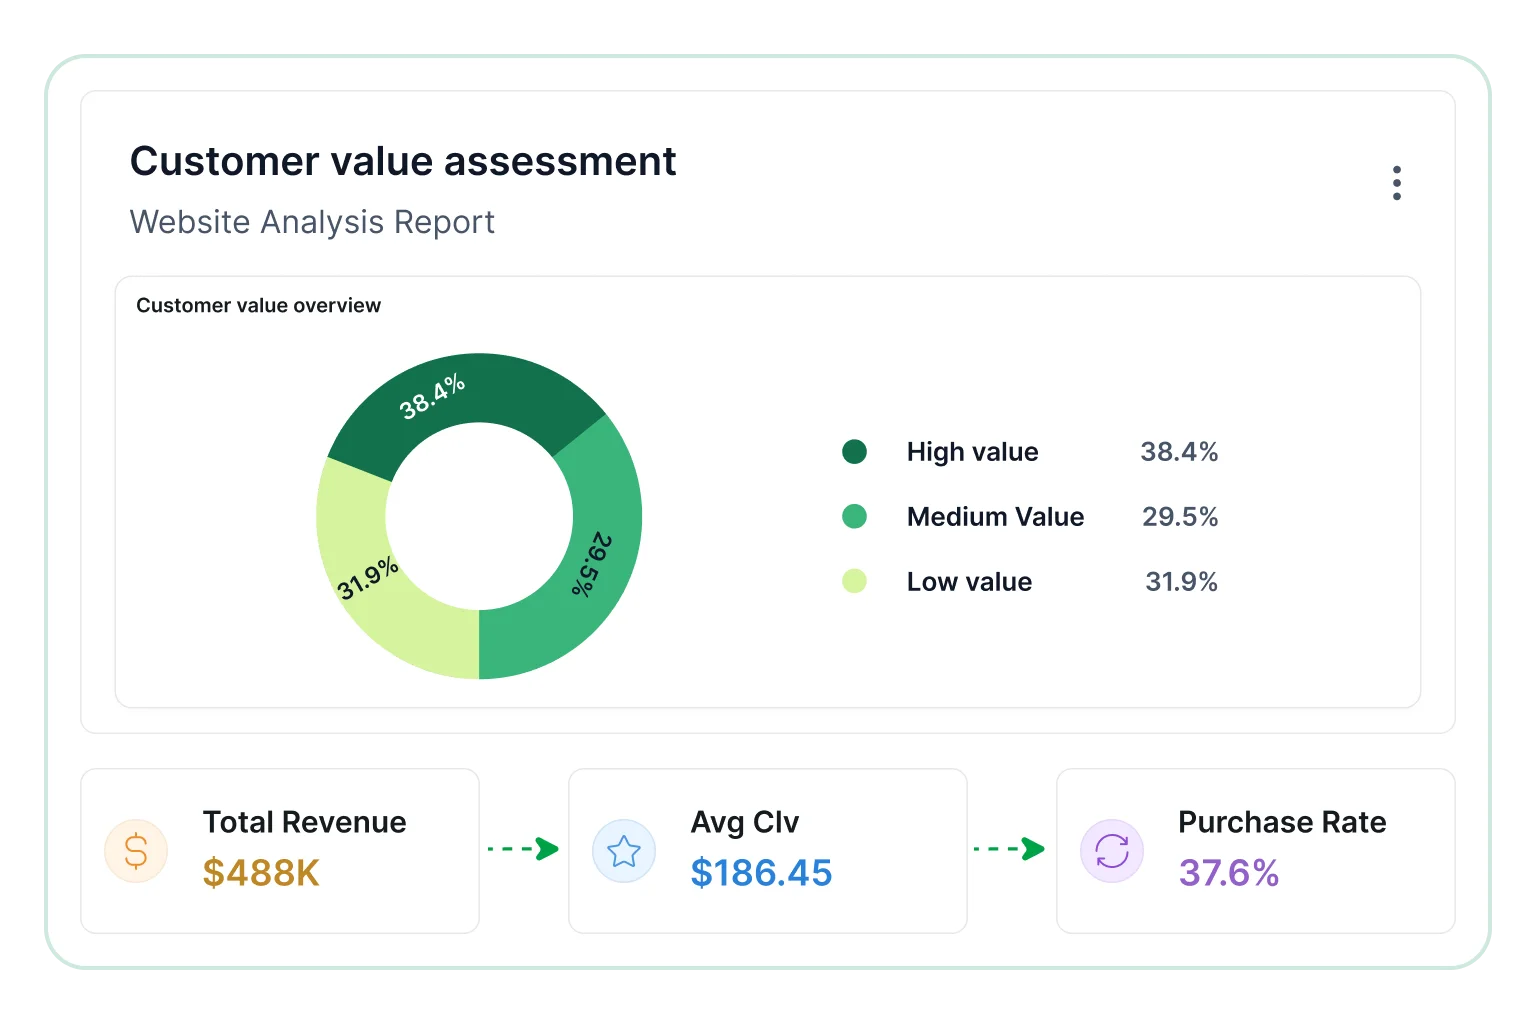
Customer value assessment
Useful for understanding long-term customer contribution across channels, campaigns, and periods.
- Evaluate customer lifetime value trends across segments and cohorts.
- Compare revenue per customer over time and customer cohorts.
- Identify patterns in customer value growth by cohort segments.
- Measure consistency in customer spending across periods and cohorts.
- Analyze contribution of high-value customers across time and segments.
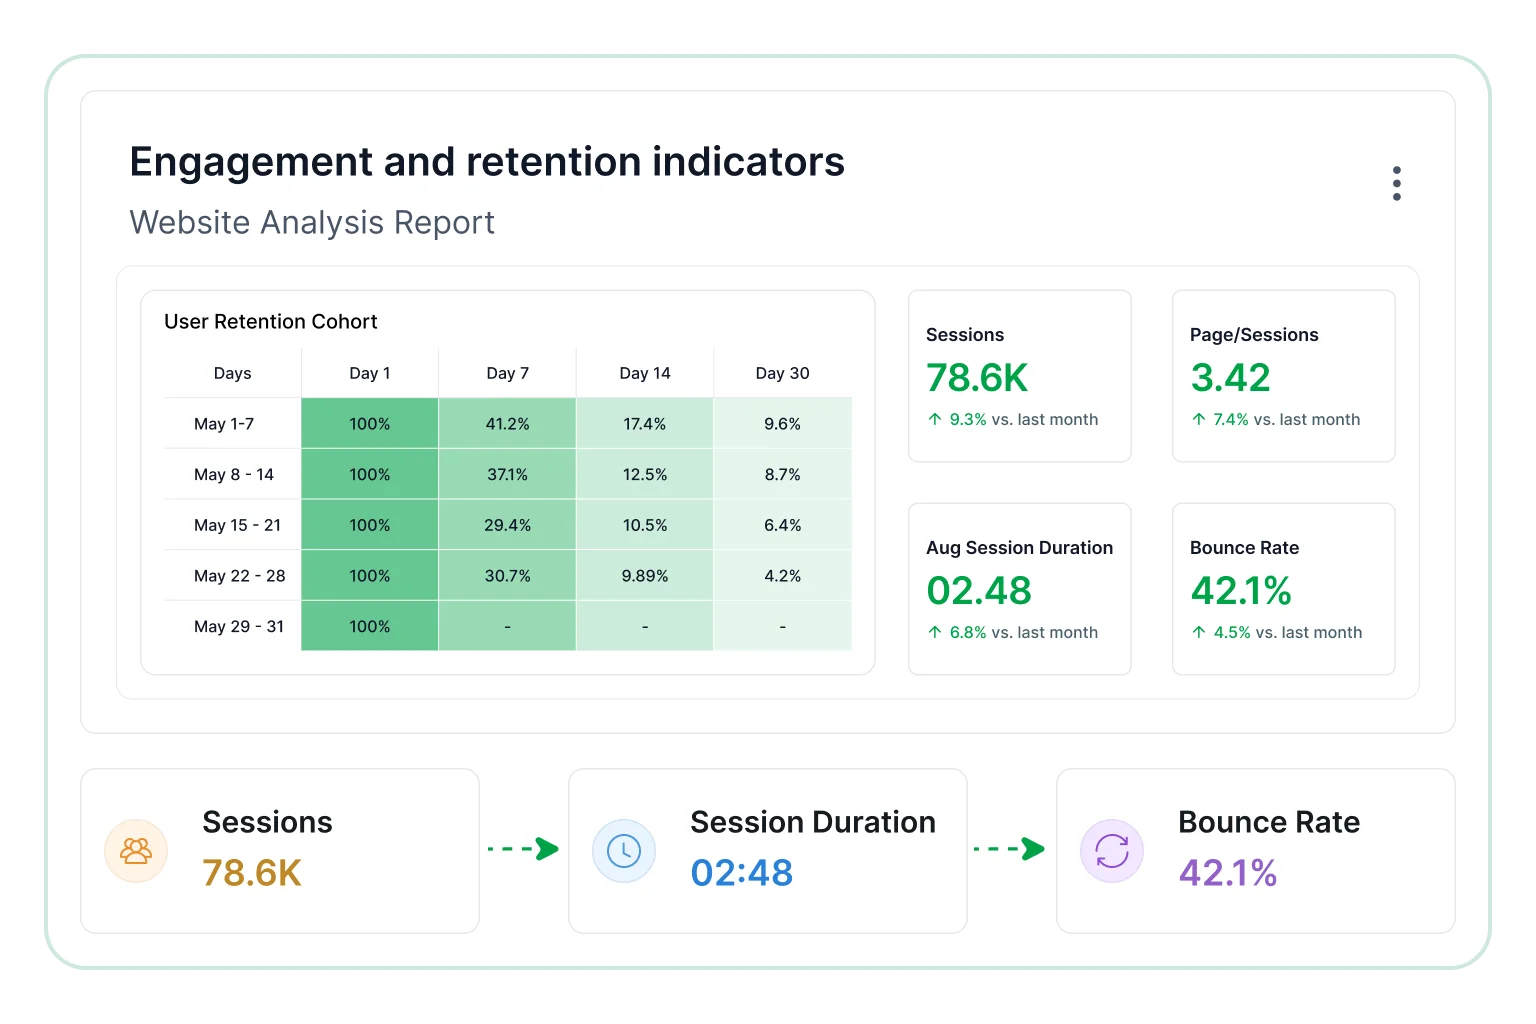
Engagement and retention indicators
Supports evaluation of website interaction quality, user retention, and overall engagement tracking.
- Monitor bounce rate across reporting periods and pages and sessions.
- Track churn trends among users and cohorts over reporting periods.
- Compare engagement levels across sessions and channels over time.
- Identify patterns indicating user disengagement and churn over time.
- Evaluate retention effectiveness across reporting periods and cohorts.

Website traffic visibility
Monitor visitor activity, acquisition sources, and traffic trends across reporting periods.

Customer behavior evaluation
Analyze engagement, retention, and customer value patterns across channels, campaigns, and periods.

Funnel performance analysis
Track how visitors progress through lead generation and customer acquisition stages.

Conversion optimization support
Identify friction points, drop-offs, and opportunities for improving website performance.

Revenue contribution insights
Understand how website interactions influence recurring revenue and business outcomes.

Consistent growth monitoring
Track website performance through structured reporting and recurring review cycles.

Centralized reporting
Combine website analytics, marketing, and revenue data into a single reporting view for deeper insights.

Funnel and conversion insights
Understand how visitors progress through acquisition and conversion journeys across channels and pages.

Secure and role-based access
Control visibility and securely share website performance information across teams and stakeholders.

Revenue performance monitoring
Track recurring revenue, customer value, and monetization effectiveness across channels and periods.

Automated report delivery
Schedule recurring reports for marketing reviews and growth analysis across channels and campaigns.

Cross-team visibility
Share website performance insights across marketing, product, sales, and leadership teams.