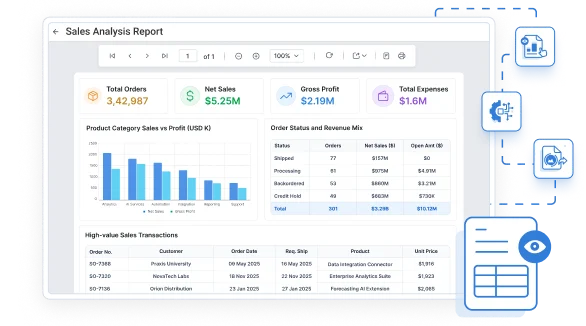







View, explore, and export reports in any application
Display pixel-perfect SSRS RDL and RDLC reports inside your own product, with instant load times, rich interactivity, and export built in. One component, every major framework.
No credit card required.
J&J
Schneider
Bridgestone
Siemens
Verizon
HP
Fidelity
Intel
Everything a modern report viewer should do
Every Bold Reports viewer shares the same JavaScript foundation, so the experience stays consistent whether it's embedded in a React or Angular SPA or a .NET application.
What your end users touch
Opens a finished report, applies parameters, drills into detail, and exports the result, the runtime experience inside your application.
Works with or without a report server
View RDL and RDLC reports with or without connecting to Microsoft SSRS or Bold Report Server, including reports stored locally or embedded directly in your application.
Native Viewer Component
Each framework gets a purpose-built viewer component with the same toolbar, parameters, and export behavior underneath, so setup takes minutes.
-
Renders RDL/RDLC reports with a native component per framework.
-
Same toolbar, parameters, and export options across every platform.
-
Set the report path, service URL, and auth token, with no extra plumbing.
-
Ready in a few lines of code, not a separate deployment.
<div id="viewer"></div>
<script>
$(function () {
$("#viewer").boldReportViewer({
reportServiceUrl: "https://your-domain.com/reporting/reportservice/api/Viewer",
reportServerUrl: "https://your-domain.com/reporting/api/site/site1",
serviceAuthorizationToken: "Bearer YOUR_SERVER_TOKEN",
reportPath: "/Sample Reports/Company Sales"
});
});
</script>
<bold-reportviewer
[reportServiceUrl]="reportServiceUrl"
[reportServerUrl]="reportServerUrl"
[serviceAuthorizationToken]="serviceAuthorizationToken"
[reportPath]="reportPath">
</bold-reportviewer>
// component.ts
reportServiceUrl = 'https://your-domain.com/reporting/reportservice/api/Viewer';
reportServerUrl = 'https://your-domain.com/reporting/api/site/site1';
serviceAuthorizationToken = 'Bearer YOUR_SERVER_TOKEN';
reportPath = '/Sample Reports/Company Sales';
import { BoldReportViewerComponent } from '@boldreports/react-reporting-components';
function App() {
return (
<div style={{ width: "100%", height: "900px" }}>
<BoldReportViewerComponent
reportServiceUrl="https://your-domain.com/reporting/reportservice/api/Viewer"
reportServerUrl="https://your-domain.com/reporting/api/site/site1"
serviceAuthorizationToken="Bearer YOUR_SERVER_TOKEN"
reportPath="/Sample Reports/Company Sales">
</BoldReportViewerComponent>
</div>
);
}
<bold-report-viewer
report-service-url="https://your-domain.com/reporting/reportservice/api/Viewer"
report-server-url="https://your-domain.com/reporting/api/site/site1"
report-path="/Sample Reports/Company Sales"
service-authorization-token="Bearer YOUR_SERVER_TOKEN">
</bold-report-viewer>
// _ViewImports.cshtml
@addTagHelper *, BoldReports.AspNet.Core
// Blazor Component
public async void RenderReportViewer()
{
viewerOptions.ReportPath = "/Sample Reports/Sales Order Detail";
viewerOptions.ServiceURL = "https://your-domain.com/reporting/reportservice/api/Viewer";
viewerOptions.ServerURL = "https://your-domain.com/reporting/api/site/site1";
viewerOptions.AuthorizationToken = "Bearer YOUR_SERVER_TOKEN";
await JSRuntime.InvokeVoidAsync("BoldReports.RenderViewer", "report-viewer", viewerOptions);
}
// JS Interop (wwwroot/js/site.js)
window.BoldReports = {
RenderViewer: function (elementID, reportViewerOptions) {
$("#" + elementID).boldReportViewer({
reportPath: reportViewerOptions.reportPath,
reportServiceUrl: reportViewerOptions.serviceURL,
reportServerUrl: reportViewerOptions.serverURL,
serviceAuthorizationToken: reportViewerOptions.authorizationToken
});
}
};
<div id="report-viewer" style="width:100%;height:900px"></div>
@(Html.Bold().ReportViewer("viewer")
.ServiceAuthorizationToken("Bearer YOUR_SERVER_TOKEN")
.ReportServiceUrl("https://your-domain.com/reporting/reportservice/api/Viewer")
.ReportServerUrl("https://your-domain.com/reporting/api/site/site1")
.ReportPath("/Sample Reports/Company Sales")
)
<div style="height:600px;width:100%">
<Bold:ReportViewer runat="server"
ServiceAuthorizationToken="Bearer YOUR_SERVER_TOKEN"
ReportServiceUrl="https://your-domain.com/reporting/reportservice/api/Viewer"
ReportServerUrl="https://your-domain.com/reporting/api/site/site1"
ReportPath="/Sample Reports/Company Sales">
</Bold:ReportViewer>
</div>
Everything a modern report viewer should do
Every Bold Reports viewer shares the same capabilities, so the experience stays consistent whether it's embedded in a React SPA or an ASP.NET MVC app.
Connect to any data source
Built-in support for Microsoft SQL Server, SQL Azure, SQL CE, XML, Microsoft Access, Oracle, OLEDB, and ODBC, plus custom data processing extensions for MySQL, SQLite, PostgreSQL, MongoDB, and more.
Rich data visualization
Tables, matrices (pivot tables), lists, charts, sparklines, data bars, gauges, indicators, maps, barcodes, QR codes, and e-signatures, the same visual vocabulary available in the report designer, rendered faithfully at view time.
Interactive reports
Drill-down, drill-through, hyperlinks, bookmarks, document maps, subreports, and nested data regions let end users explore report detail without leaving the viewer.
Report parameters & data shaping
Cascading, query-based, static, and multi-value parameters put report data in end users' control at runtime. Combine with sorting, filtering, grouping, summaries, and calculated fields to reshape the view without touching the underlying report.
Print & export, pixel-perfect
Export straight from the toolbar to PDF, Word, Excel, PowerPoint, CSV, XML, and HTML, with layout, fonts, and formatting preserved exactly across every format.
Themes, responsive rendering & developer APIs
Material, Bootstrap, Fabric, and a high-contrast accessibility theme ship out of the box. Because reports are paginated to a fixed paper layout, they render identically on every device — on smaller screens you scroll to navigate the page rather than the layout reflowing — and the viewer exposes full programmatic control over the toolbar, parameter panel, pages, and dialogs.
Use Cases
What you can do with the report viewer
The same component adapts to a wide range of reporting scenarios, from customer-facing reports to internal operational reporting.
customer-facing-reporting
Give your SaaS customers a native, branded reporting experience inside your product, without sending them to a separate reporting tool.
invoice-and-statement-delivery
Render pixel-perfect, print-ready invoices, receipts, and statements that stay consistent whether viewed on screen or exported to PDF.
operational-reporting
Give teams a self-serve way to view sales, inventory, and finance reports with parameters and drill-down instead of static spreadsheets.
legacy-report-viewer-replacement
Keep your existing RDL/RDLC reports and swap out an aging viewer for a modern, web-based one, with no report rebuild required.
Brand the viewer to match your app
Restyle the toolbar, themes, and UI to match your product, so the viewer looks native rather than embedded.
Add reporting to desktop applications
Bring the same RDL/RDLC viewing experience to WPF and UWP desktop apps alongside your web products.

Report Viewer is one part of the embedded reporting toolkit
Four embedded reporting tools that work together to design, view, manage, and deliver reports from a single platform.
Report Designer
Create and edit reports, datasets, and data sources directly inside your web application with an intuitive designer.
Report Viewer
Render and display RDL/RDLC reports natively inside your application, with full interactivity, drill-down, drill-through, parameters, and export.
Report Writer
Export RDL/RDLC reports to PDF, Excel, CSV, PowerPoint, Word, and HTML from Designer, Viewer, or Server.
Enterprise-Ready Compliance
Bold Reports helps you meet key security and compliance standards. All activity logs are safely stored, can’t be changed, and are easy to export when needed.
Enterprise-Ready Compliance
Bold Reports helps you meet key security and compliance standards. All activity logs are safely stored, can’t be changed, and are easy to export when needed.
Get the Details You Need
Frequently Asked Questions
A report viewer is a UI component that renders reports inside a web or desktop app — so instead of building report rendering, export, and print handling yourself, you embed a ready-made component and let users view, filter, print, and export directly in your application. Formats range from proprietary ones like Crystal's .rpt to open standards, the most popular being RDL (popularized by SSRS) and its .NET counterpart RDLC.
A report designer is a design-time tool for building and editing report layouts — arranging data regions, formatting, parameters, and expressions. A report viewer is the runtime component users interact with to open, explore, filter, and export a finished report. In short: the designer creates reports, the viewer displays them.
Bold Reports ships report viewer components for Angular, React, JavaScript, ASP.NET Core, ASP.NET MVC, ASP.NET Web Forms, Blazor, WPF, and UWP — each with its own integration package and full documentation.
The viewer renders native RDL and RDLC definitions, so most existing SSRS reports upload and run as-is — you reconnect the data source and they render. Reports relying on custom extensions or SSRS-server-specific features are identified up front during migration.
PDF, Word, Excel, PowerPoint, CSV, XML, and HTML, with pixel-perfect formatting preserved across every format.
Yes, Bold Reports is free to try for 30 days, no credit card required.
Crystal Reports .rpt files use SAP's proprietary format, so they're converted to RDL before rendering. Bold Reports provides a Crystal-to-RDL conversion tool that automates this — it processes your .rpt reports and generates RDL equivalents, carrying across layout and formatting so you're not rebuilding by hand.
Yes. You can show, hide, rearrange, or add custom toolbar items, and apply a Material, Bootstrap, Fabric, or high-contrast theme — or override the CSS to match your application's branding. See Toolbar customization and Theming in the docs for the full API.
The viewer renders on demand, page by page — only the requested page is processed and streamed rather than the whole report at once, so load time stays roughly flat as report size grows. For example, a 5,000-row financial statement that paginates into 200 pages loads the first page in about the same time as a 10-page report, because the viewer isn't rendering all 200 pages up front. See On-demand paging in the docs for configuration details.
Yes. Row-level security and role-based access control are built-in — access rules bind to roles or group membership, so one report definition serves everyone while each user sees only their authorized rows. Because the viewer also renders whatever dataset it's passed, you can enforce additional filtering in your own data layer before rendering.
Ready to add report viewing to your application?
Embed a report viewer that feels like a native part of your application, fully branded and easy to use.
No credit card required.