
Student Details Report: Top 5 Metrics and KPIs to Track
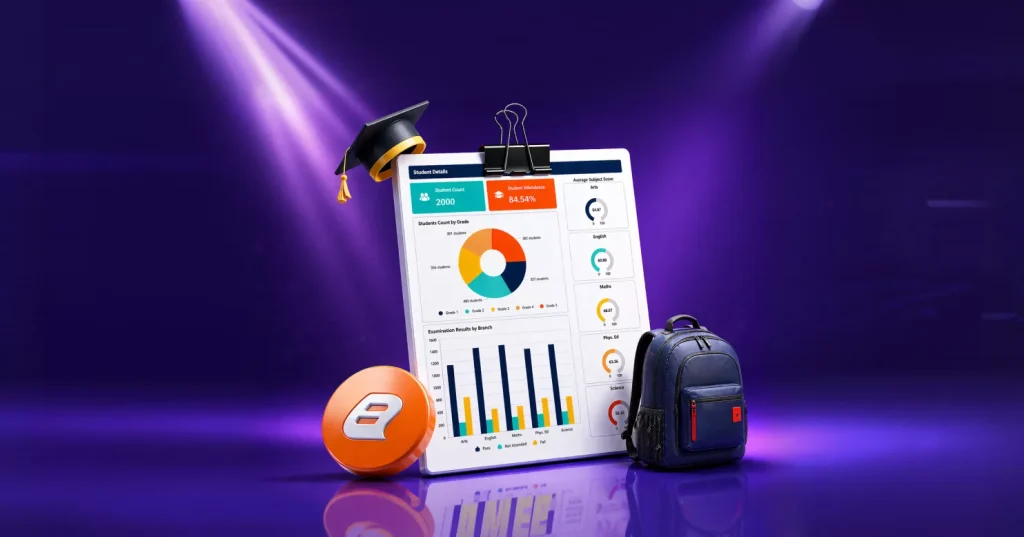
TL;DR: A student detail report helps educational institutions organize and track student performance, attendance, and enrollment in a structured format. By tracking the right KPIs in Bold Reports, institutions can reduce manual reporting and make faster academic and operational decisions.
Introduction
Educational institutions collect student data daily across attendance, enrollment, and assessment systems. But turning that data into a clear, structured report is where most teams face challenges.
Common issues include:
-
- Student data spread across multiple systems.
- Manual report creation using spreadsheets.
- Inconsistent report formats across classes or branches.
- Difficulty generating reports for each student.
This leads to delays, inconsistencies, and limited visibility into student performance. A student details report solves this by organizing all critical student information into a single, structured format that is easy to read, share, and act on.
In this blog post, you’ll explore the top five essential metrics and KPIs to track using a student details report. You’ll see how an interactive reporting approach transforms raw student data into actionable insights, helping institutions identify trends early and make data-driven academic and administrative decisions.
Who uses student details reports in education?
-
- Academic leadership (provosts, deans, chief academic officers) use student details reports to monitor performance trends and improve program outcomes.
- Finance leaders (CFO) rely on enrollment and student distribution data to plan budgets, funding, and resource allocation.
- Registrars and administrative teams use structured reports to manage student records, verify enrollment, and maintain accurate documentation.
- School and district leaders (superintendents, principals) track attendance, performance, and engagement to improve student success.
What is a student details report?
A student details report is a complete view of student data, combining multiple metrics into a structured and easy-to-read layout. It consolidates critical student data such as:
-
- Total student count.
- Overall attendance percentage.
- Student distribution by grade.
- Average scores by subject.
- Examination results by subject (pass, fail, not attended).
Instead of reviewing raw data, institutions can use this report to understand performance quickly and support academic decisions.
Key benefits of visualizing student data in RDL reports
Here’s how it helps:
-
- Better visibility into student enrollment: Get a clear view of the total number of students to support planning and resource allocation.
- Early insight into attendance trends: Track attendance to identify engagement issues and take timely action.
- Balanced academic planning: Use student distribution by grade to manage class sizes and faculty workload.
- Clear understanding of academic performance: Monitor scores by subject to identify strengths and areas for improvement.
- Faster identification of learning gaps: Analyze exam results (pass, fail, not attended) to address performance issues quickly.
- Reduced manual reporting effort: Access all key student data in one report instead of combining multiple sources.
- Improved decision-making with structured data: Make confident academic and administrative decisions with a complete view of student information.
Top 5 metrics to monitor in a student details report
1. Number of students
This metric represents the total number of students enrolled in the institution at a given time. It provides a baseline for assessing enrollment trends and monitoring growth or decline over time.
KPI logic: Number of Students = COUNT(StudentID) WHERE EnrollmentStatus = ‘Active’ (adjust status values to your data model)
Why it matters: The number of students is the baseline for interpreting almost every other metric, as attendance and performance context changes as enrollment shifts.

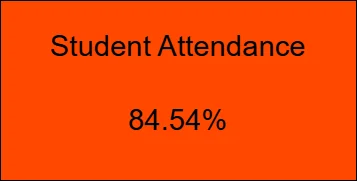
2. Student attendance
This metric shows student attendance levels over a selected time period, helping monitor engagement and absenteeism.
KPI formula: Attendance Rate (%) = (Present Days ÷ Total Instructional Days) × 100
Why it matters: Attendance is an early indicator for performance risk and engagement issues.
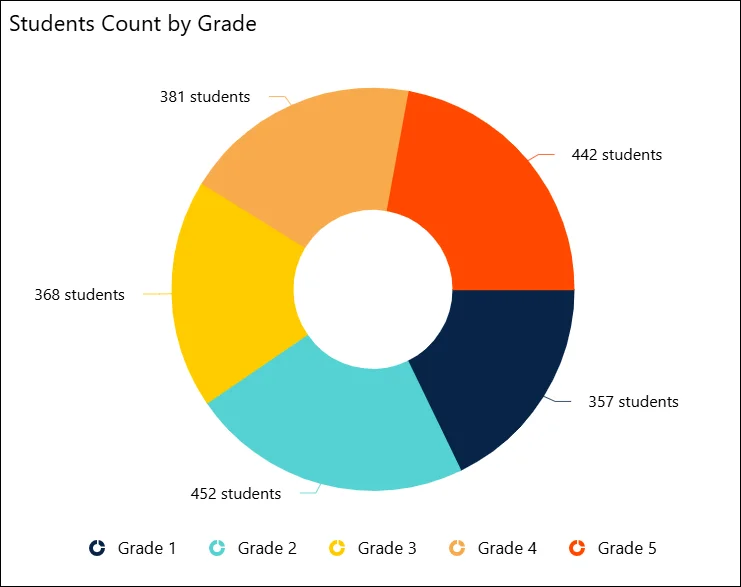
3. Number of students by grade
This metric displays the number of students enrolled in each grade to support enrollment analysis and planning.
KPI logic: COUNT(StudentID) GROUP BY Grade
Why it matters: Grade distribution supports scheduling, classroom allocation, and staffing.
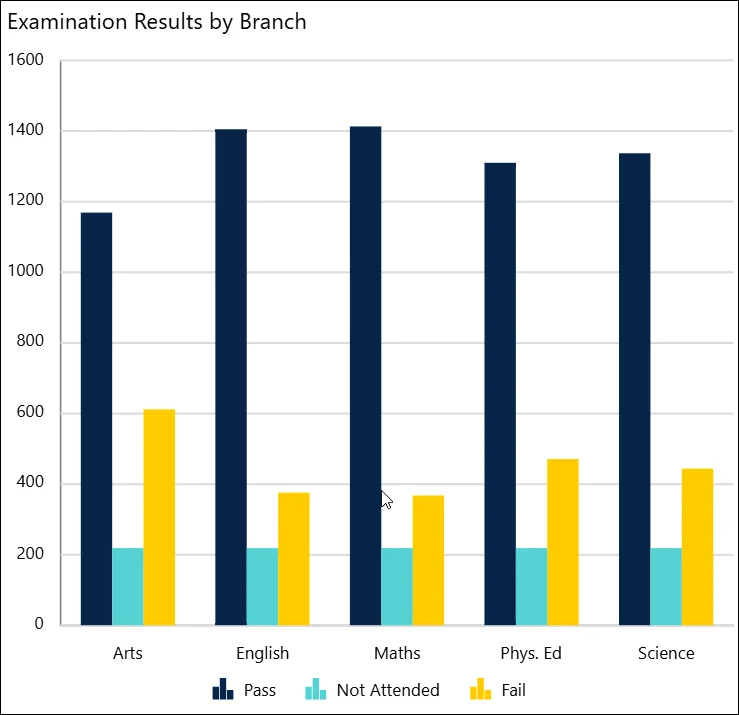
4. Examination results by branch
This metric presents a branch-level performance comparison based on exam results.
KPIs (choose what matches your grading model):
- Average Score = AVG(Score) GROUP BY Branch
- Pass Rate (%) = (Passed ÷ Appeared) × 100 GROUP BY Branch.
Why it matters: This helps identify whether performance gaps are localized (branch-specific) versus systemic (across all branches).
5. Average subject score
This metric represents the average student performance in each subject, highlighting overall academic trends.
KPI logic: AVG(Score) GROUP BY Subject
Why it matters: Subject-level averages make it easier to prioritize curriculum adjustments, tutoring, or targeted instructional support.
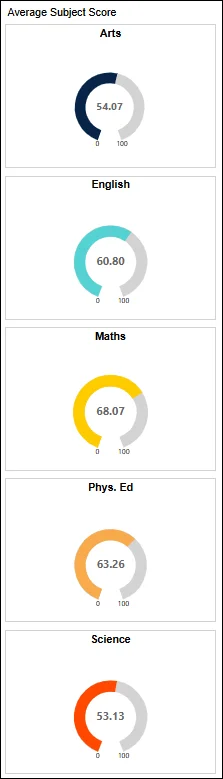
All these widgets can be combined in a single Student details report to deliver a unified, easy‑to‑read view of critical academic information. By visualizing key student metrics in one place, institutions can identify trends early, monitor performance more effectively, and make informed academic and operational decisions with confidence.
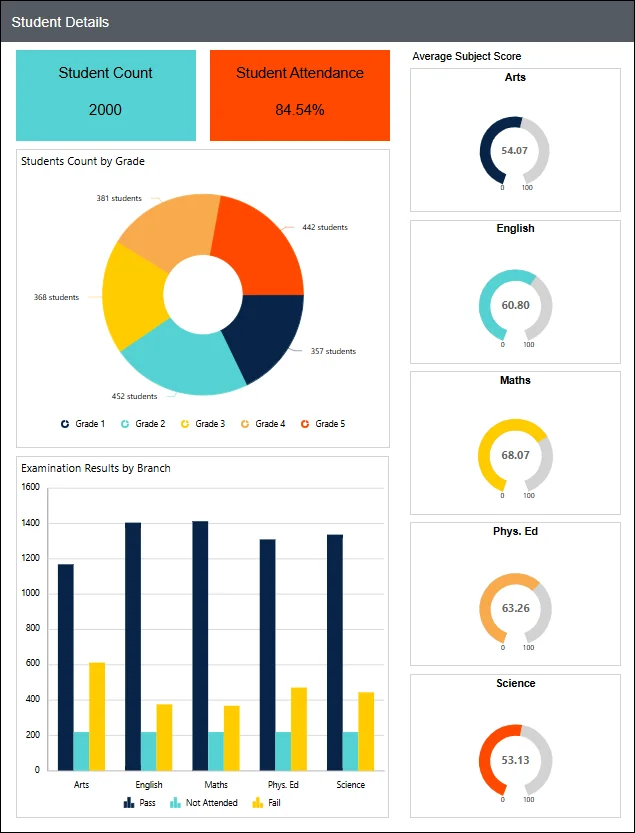
You can also explore the sample student details report on the website for reference on layout and interactivity best practices.
Use cases of a student details report
By embedding the student details report into your applications, you get:
-
- Unified student profile view: Offers a centralized report that combines personal, academic, and enrollment details for a complete overview of each student.
- Performance and engagement tracking: Helps monitor attendance, grades, and examination results to assess academic progress and student involvement.
- Flexible data filtering and grouping: Allows filtering by grade, branch, or academic year to identify trends and support data‑driven decisions.
- Secure access control: Protects sensitive student information with role‑based access, ensuring only authorized users can view specific data.
- Export and sharing capabilities: Enables exporting student data to PDF, Excel, and other formats for offline use, reporting, and stakeholder sharing.
Once a student details report is created in Bold Reports®, institutions gain better visibility into student data, enabling informed academic and operational decision-making.
Final thoughts
A student details report is more than just a record of student information; it serves as a comprehensive educational analytics tool that helps institutions track performance, attendance, and enrollment with clarity and confidence. With Bold Reports, educators and administrators gain better visibility into academic progress and operational efficiency by visualizing key student data in one place.
Ready to streamline student data management? Start creating your reports today by signing up for a free trial. For specific questions, schedule a personalized demo to ask them. For more details, visit our website or reach out to our support team for assistance. Empower your institution with data‑driven decisions using Bold Reports®.
Frequently asked questions
- 1.
What is a student details report?
A structured report that combines student profile, attendance, enrollment, and performance data.
- 2.
What metrics should be included?
Number of students, attendance, grade distribution, subject performance, and exam results.
- 3.
Can student reports be automated?
Yes, reports can be generated and scheduled automatically.
- 4.
Who uses these reports?
Academic leaders, administrators, and data teams.
- 5.
Can you embed a student details report in a web portal or application?
Yes. You can publish a report and embed it in portals or applications so users can view filtered results without leaving your app.






