Blazor Report Viewer / Report Items
Blazor Report Viewer
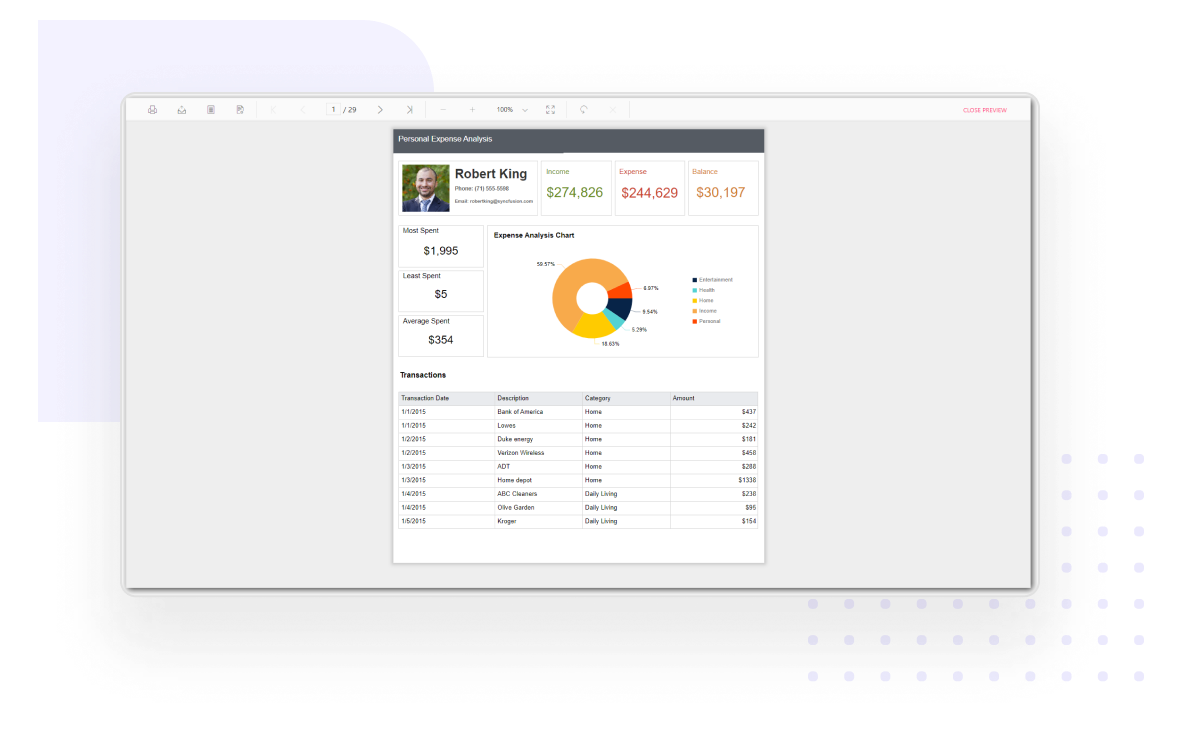
The RDL reporting standard report items are used to elegantly visualize data and to allow easily exploration of insights on business outcomes to help you make intelligent, real-time decisions.
No credit card required.
What you can do with report items
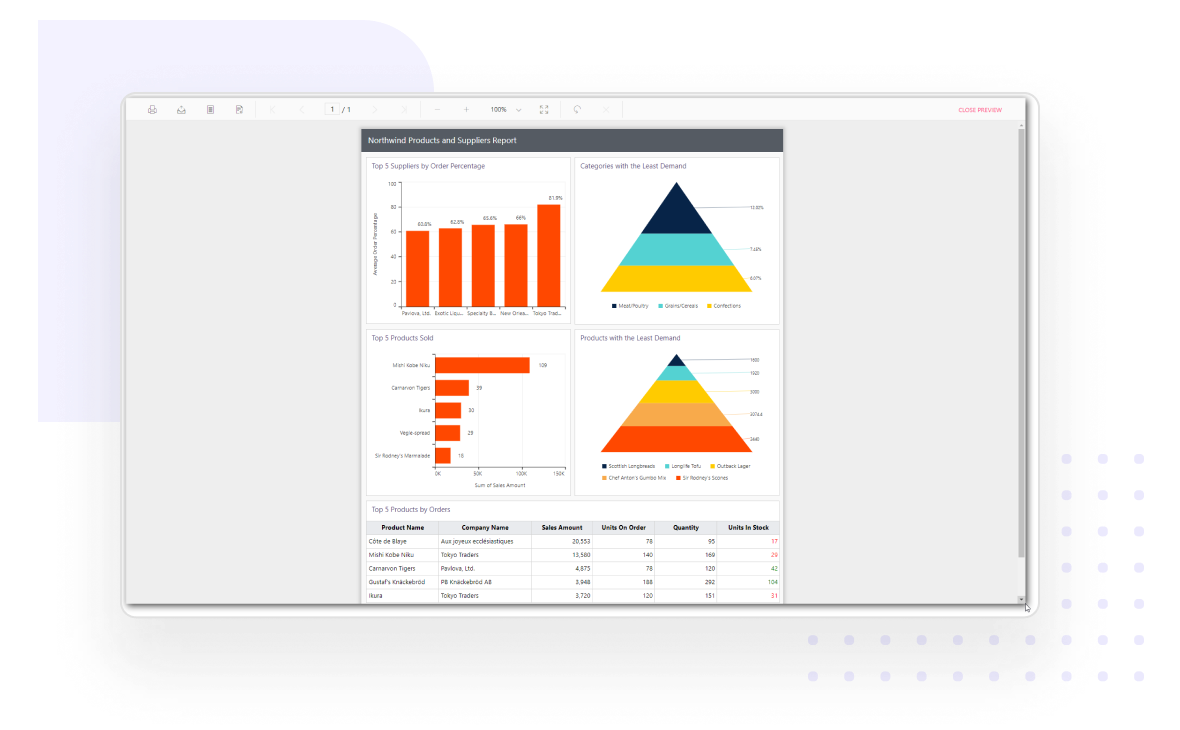
Table, matrix (pivot table), list
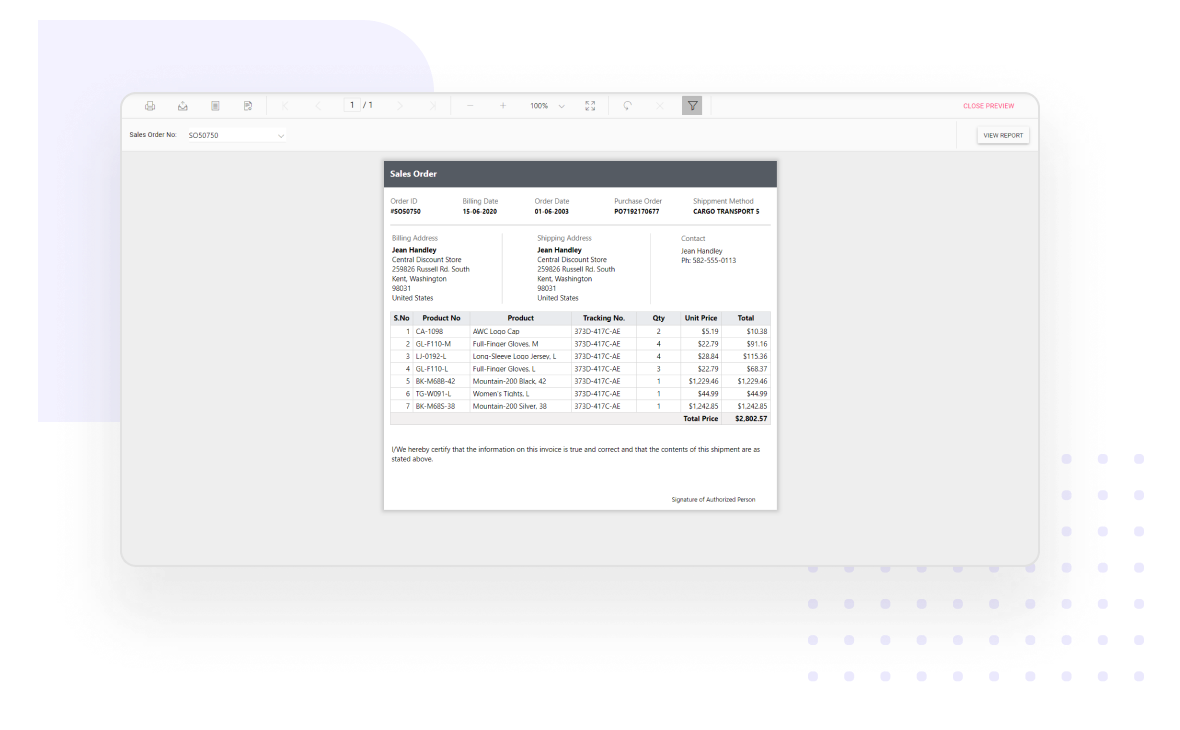
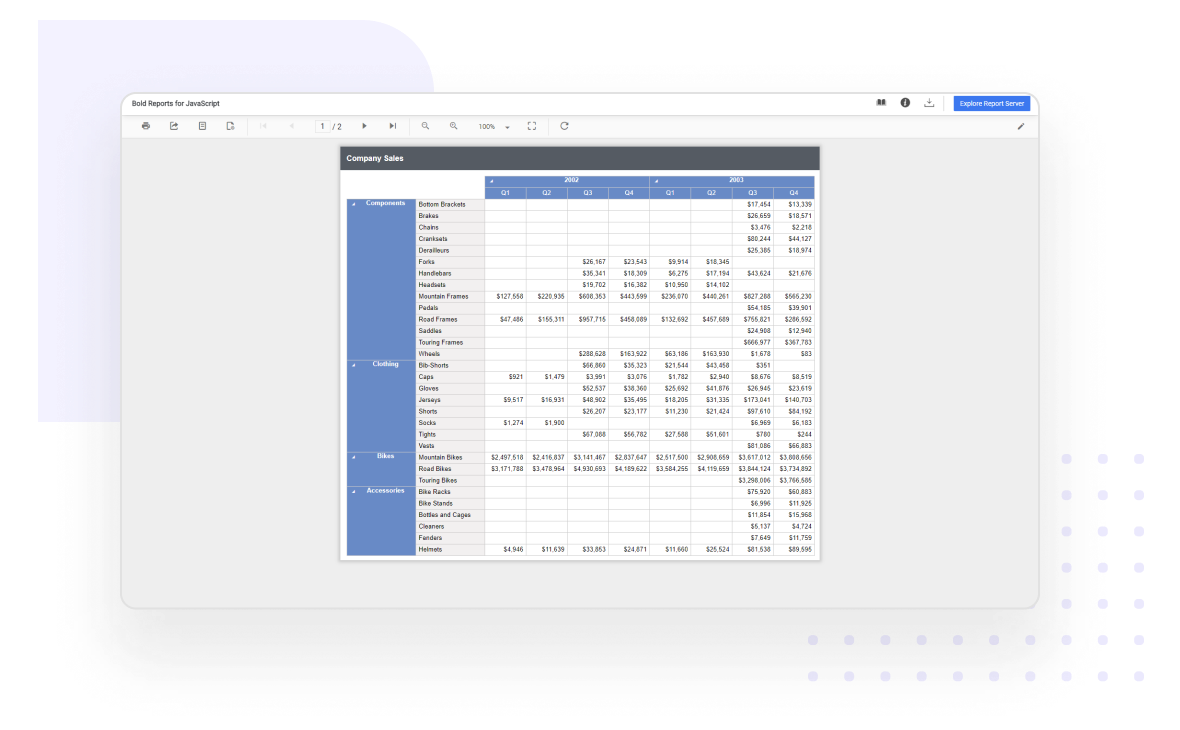
Display paginated report data from a data set in cells that are organized into rows and columns by using a table, matrix (pivot table), or list. Item-specific features like multiple grouping and sorting, section totals, header repeating, and free-form layouts make the report more readable.
Chart
Graphically represent data in a wide array of charts to present it clearly and concisely. The Blazor Report Viewer supports viewing business reports with 20+ commonly used chart types (column, line, shape, area, bar, range, scatter, polar, and more) available in the RDL standard.
Sparkline and data bar
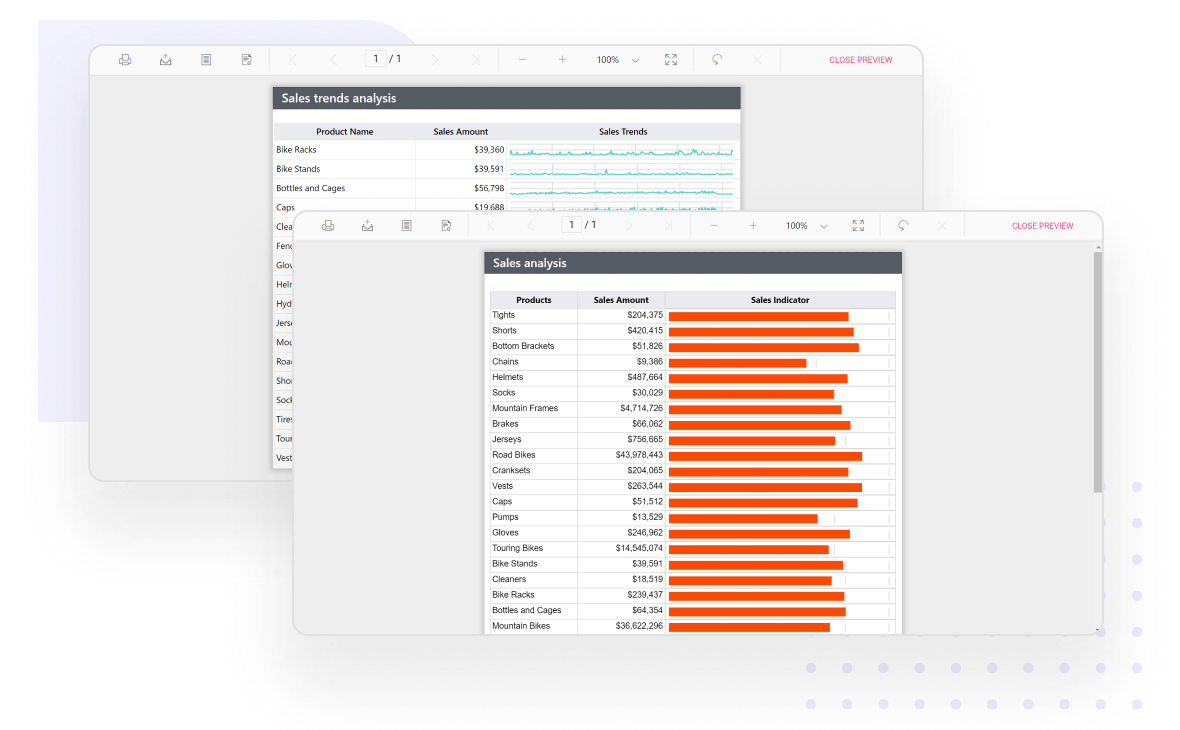
Visualize the key performance indicator values in little space. The state of data is presented elegantly in the form of progress information in a table.
Subreport
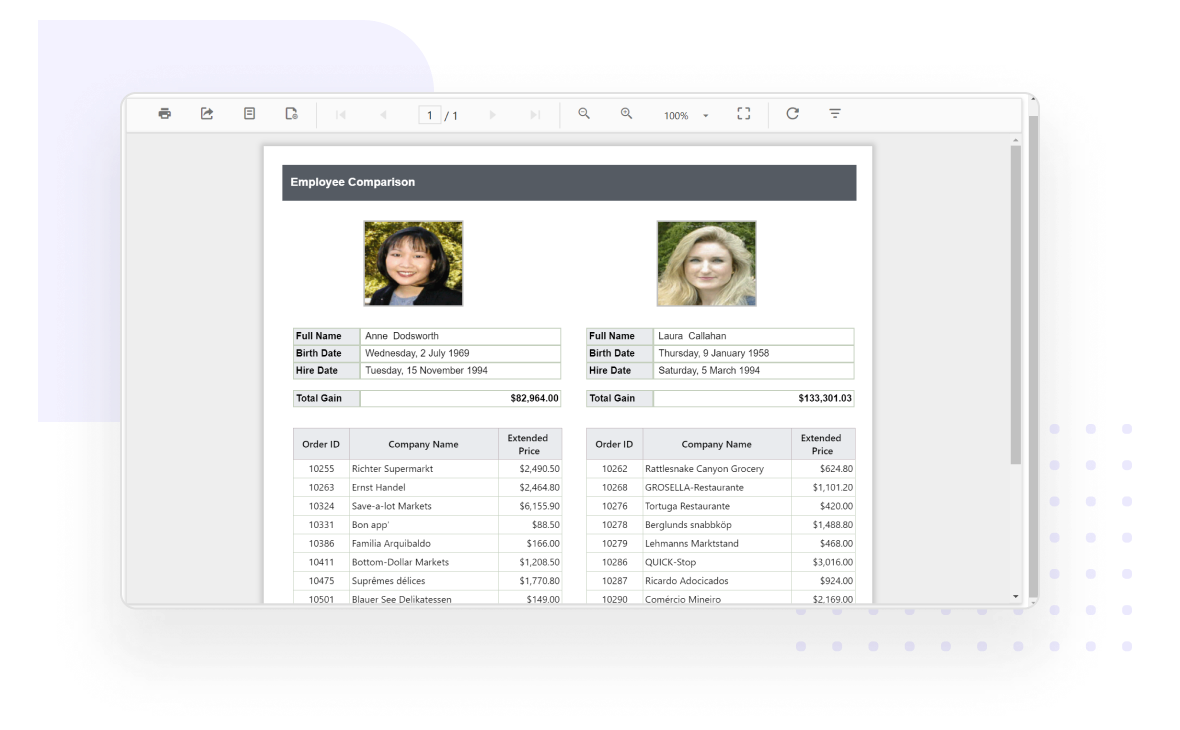
Display a child report or any another report inside the body of a main report. Create side-by-side and master-detail reports by passing parameter values from the parent to the child report.
Map
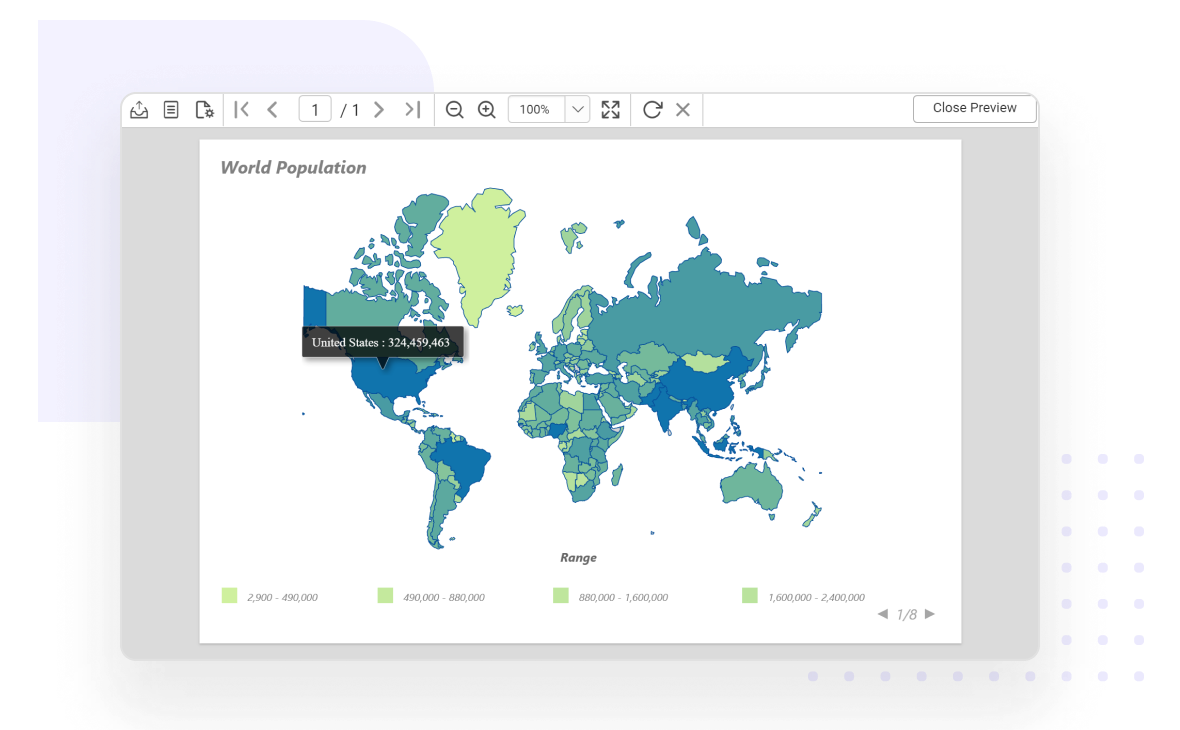
Visualize business data against a geographical background. Render beautiful maps that display locations only, or a bubble map that varies bubble size based on data values.
Indicator
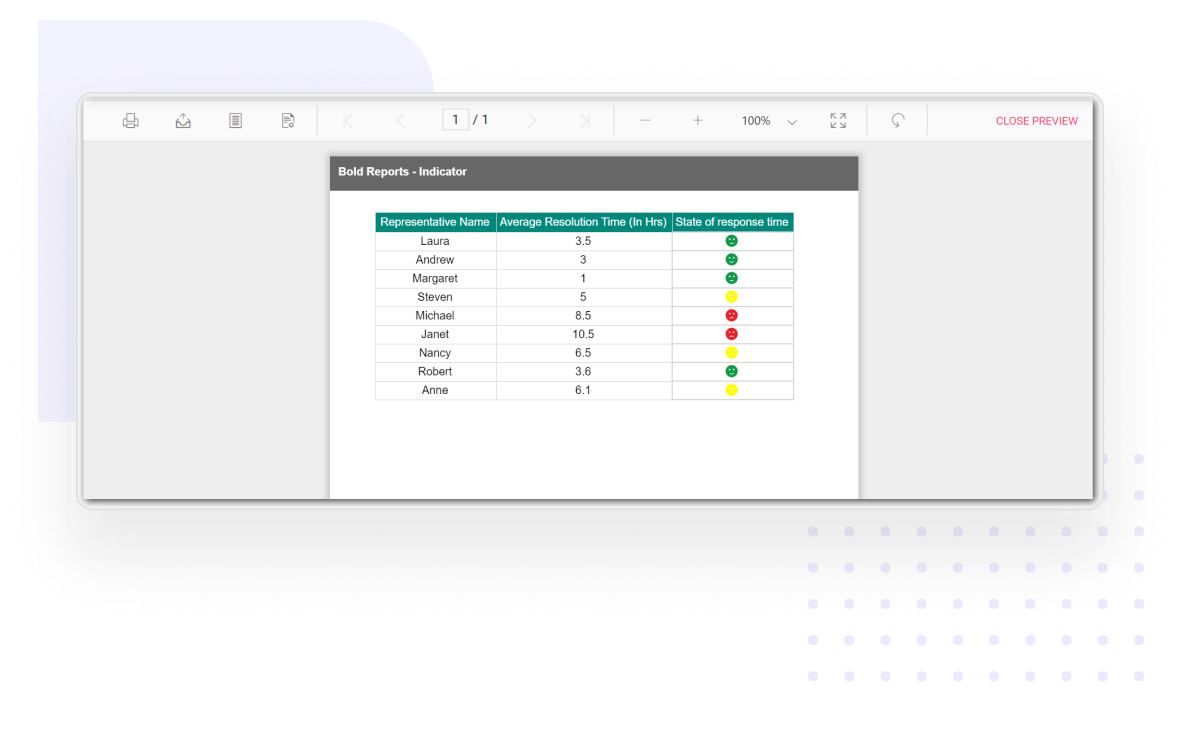
Render small gauges to convey the state of a single data value at a glance. You can use indicator icon sets such as trends, conditions, ratings, and states to suit your needs.
Gauge
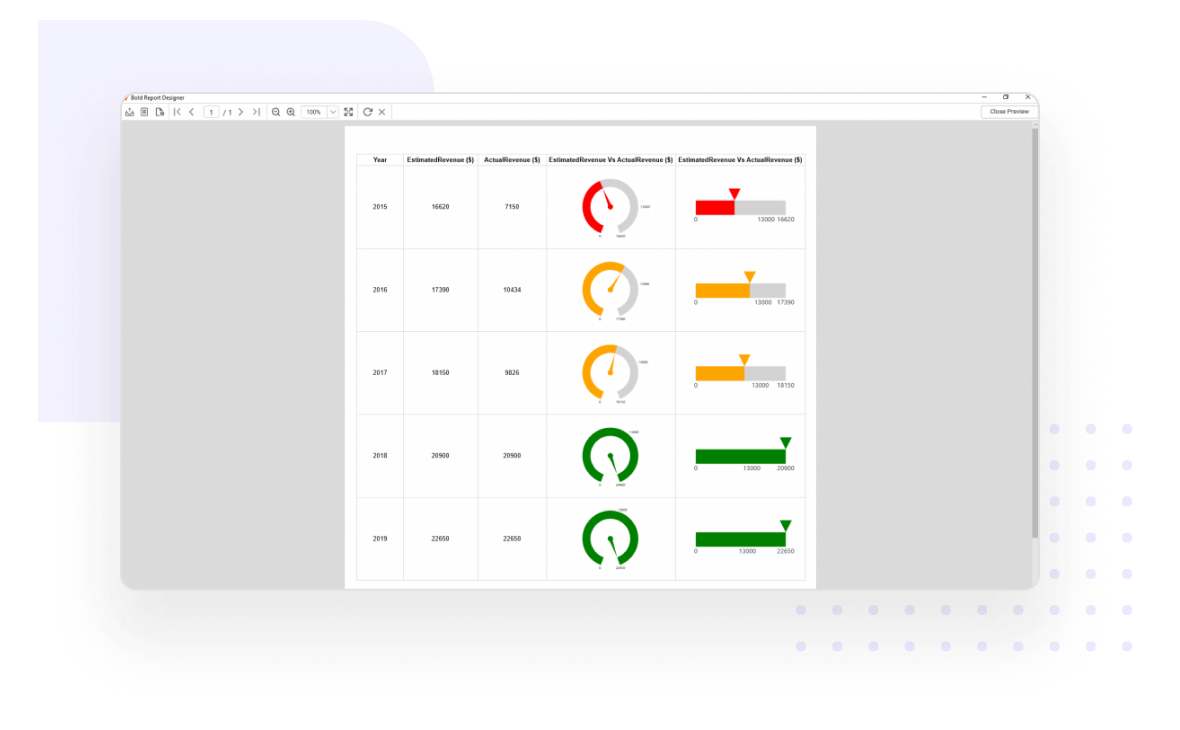
Display a single value from your data set. Supports rendering linear and radial gauges as nested data regions and individual elements in reports like KPIs in performance reports.
Basic items
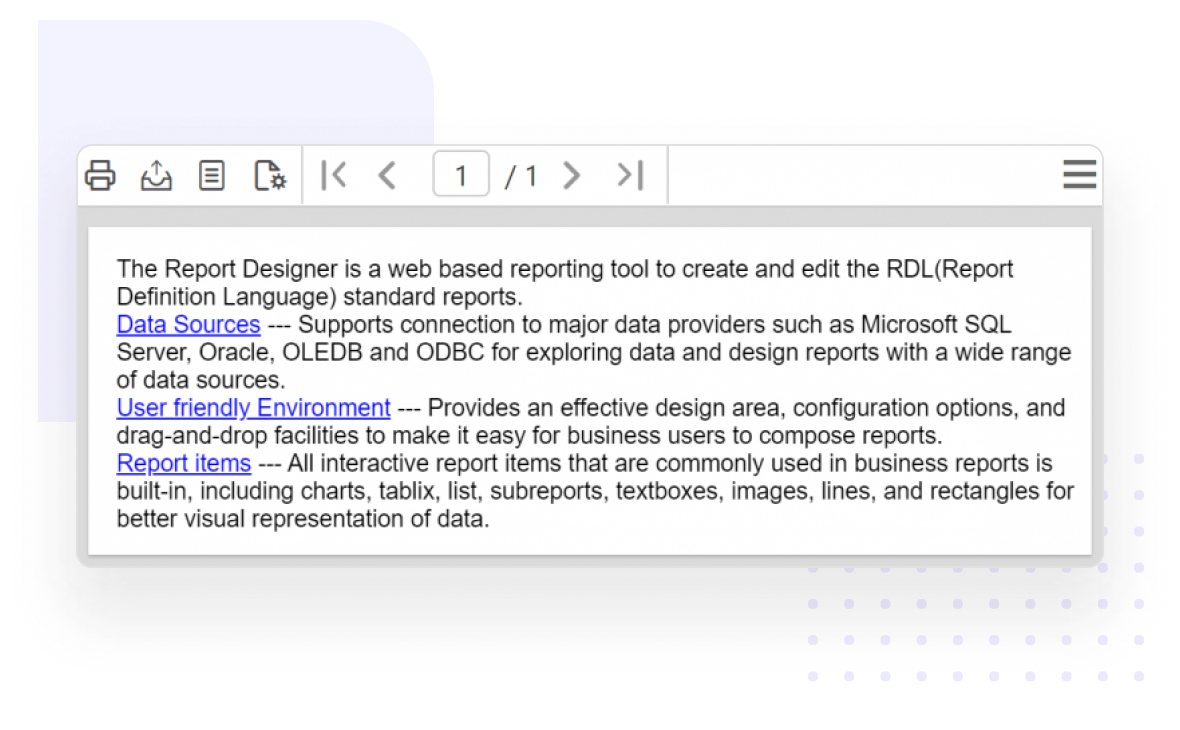
Render basic report items like images, text boxes, lines, and rectangles in free-form layouts or within table cells to provide a better appearance, highlight key information, or coordinate related information.
Custom report items
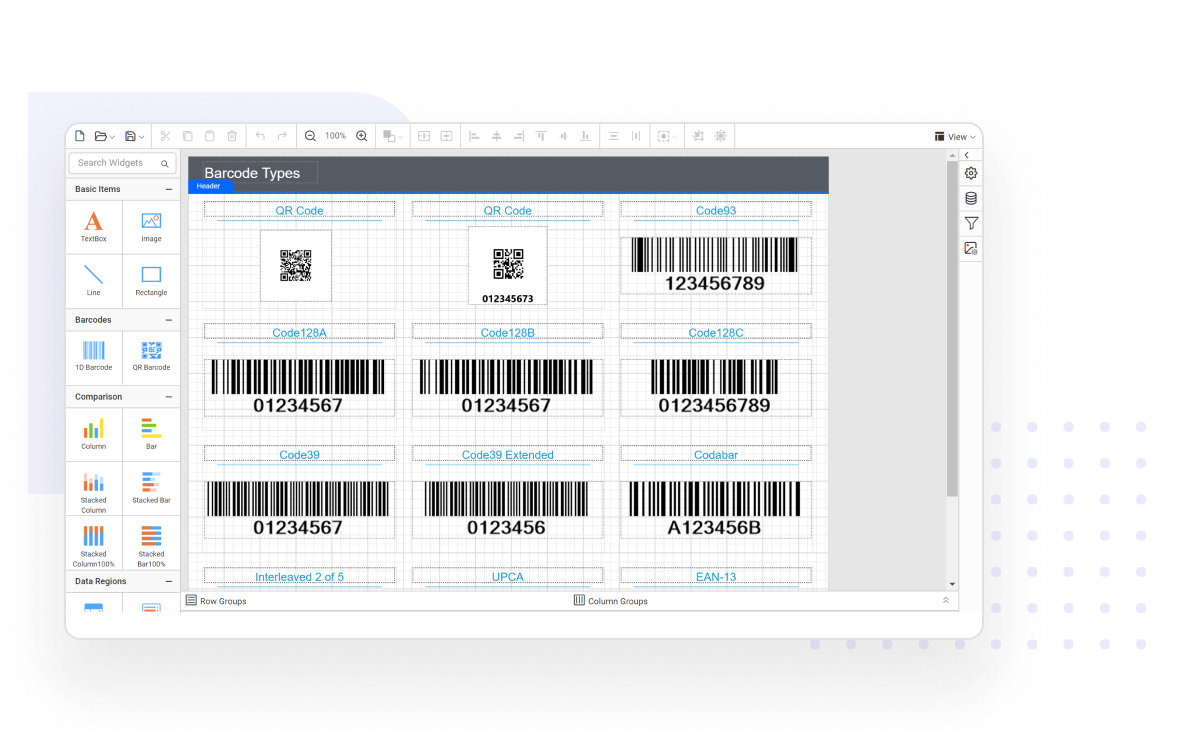
Report Definition Language (RDL) provides a way to extend natively supported report item functionality, write a new custom report item to be used in your own controls, or both. For example, you can use the barcode and QR barcode controls and view those custom report items in the Report Viewer.
Report item formatting
Formatting enhances the readability of a report. Use it to render create visually captivating reports by formatting text boxes, images, and other report items using static values and expressions.
Render HTML-formatted text
Retrieve HTML-formatted text from a field in your data set and use it in a report. CSS attributes with the basic set of tags are allowed. Formatting is available to all supported output formats, including PDF, Word, Excel, and PowerPoint.
Enterprise-Ready Compliance
Bold Reports helps you meet key security and compliance standards. All activity logs are safely stored, can’t be changed, and are easy to export when needed.
Enterprise-Grade Compliance
Bold Reports helps you meet key security and compliance standards. All activity logs are safely stored, can’t be changed, and are easy to export when needed.
- ISO 27001
- SOC 2 Type II
- GDPR
- HIPAA-Capable
Make Reporting a Natural Part of Your Product
Bold Reports helps you create fully customized reports and embed them into your application in minutes. It’s simple, flexible, and designed to match your brand.
No credit card required.
Make Reporting a Natural Part of Your Product
Bold Reports helps you create fully customized reports and embed them into your application in minutes. It’s simple, flexible, and designed to match your brand.
No credit card required.