What you can do with interactive reports

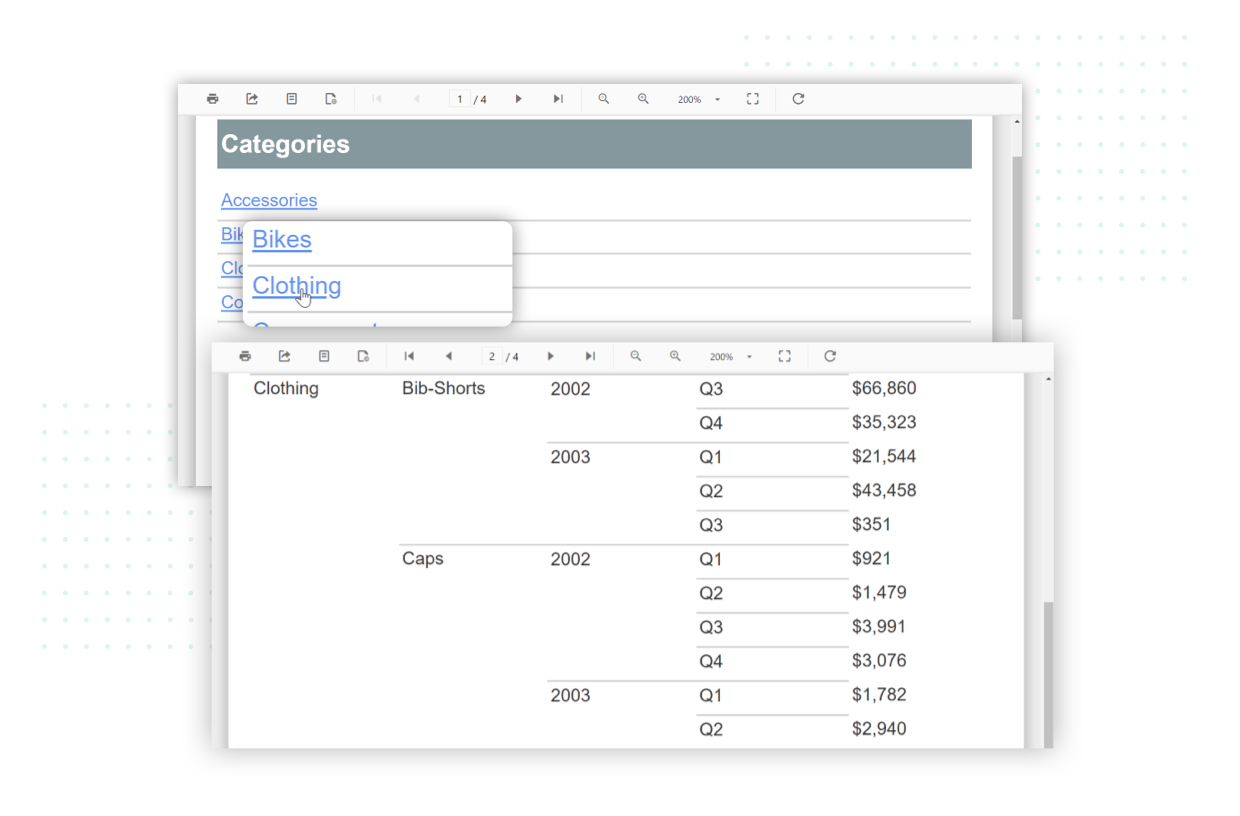
Drillthrough reports

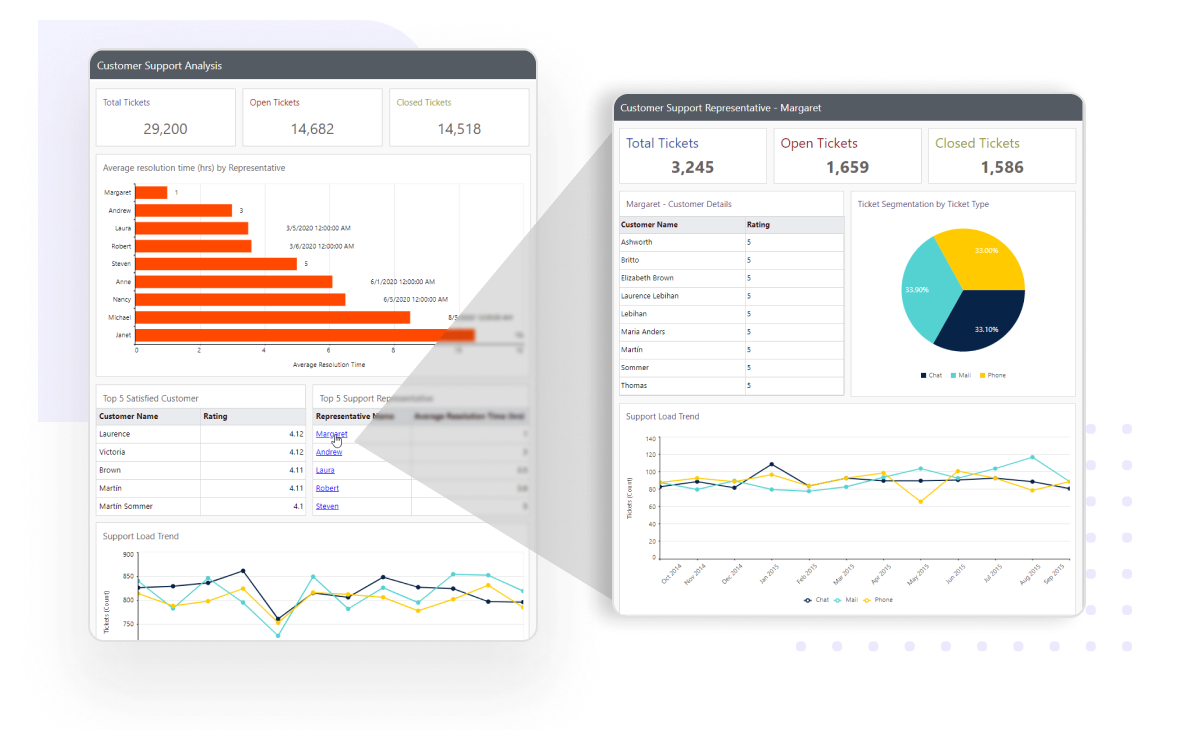
Allows end users to click on data values in a report to view related data in child reports. You can have detailed data in separate child reports and pass parameters to filter and display the data when a user clicks a link.

Shows master detail report using drillthrough reports

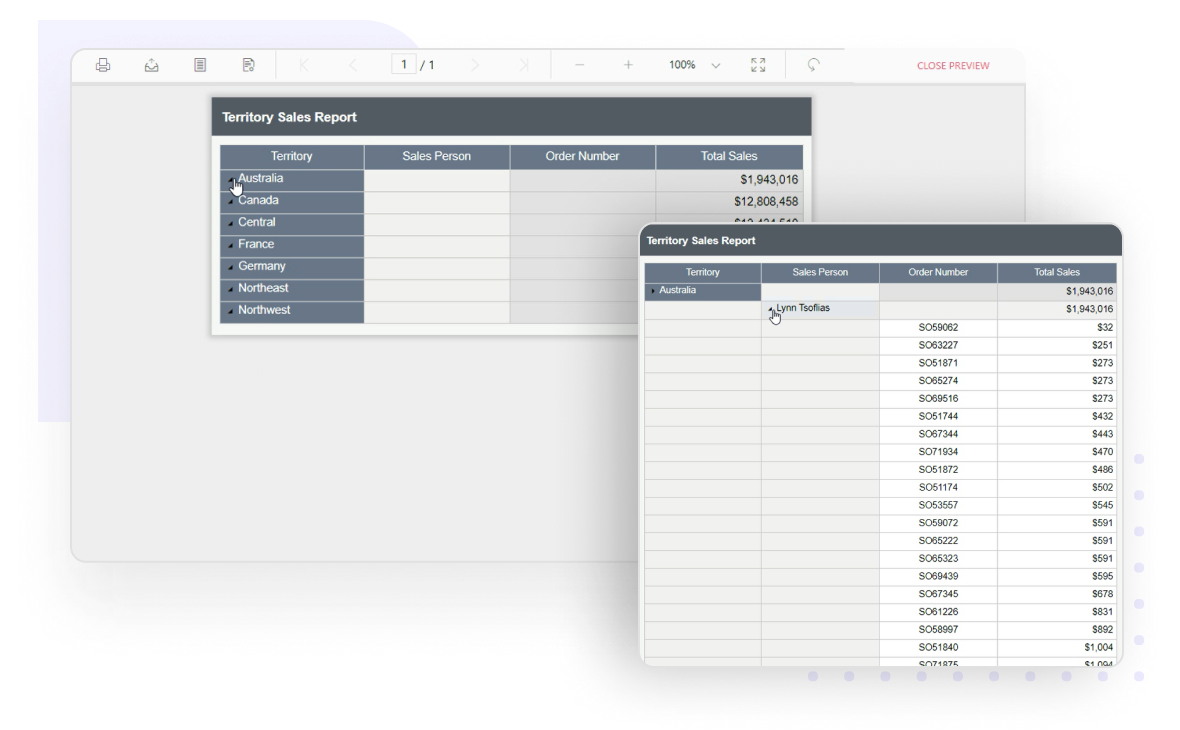
Drill-down reports or toggle items

The toggle option lets users view sections of a report by expanding and collapsing it at runtime. Show or hide static rows and columns that are associated with groups in a table or matrix (pivot table). You can use the subreport or nested data region report items to show detailed records.

Expand/collapse the territory sales detail using toggle behavior

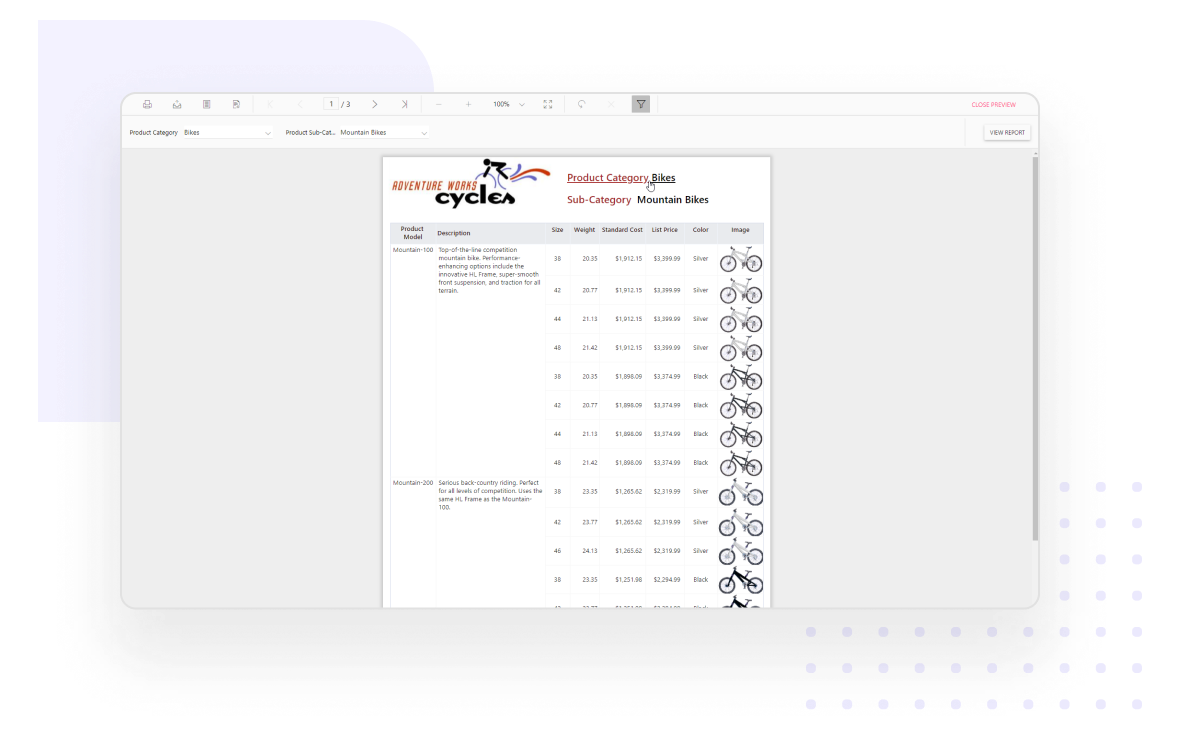
Hyperlinks

Click to open external webpages in a browser window that shows the provided static or dynamic URL’s value expression. You can use hyperlink actions in text boxes, images, charts, and gauges. The hyperlink can contain a data field or other expressions.

Open new webpages using hyperlinks in Report Viewer

Bookmarks or anchors

Allows to easily navigate to a specific content in the report using bookmark feature

Allows to easily navigate to a specific content in the report using bookmark feature

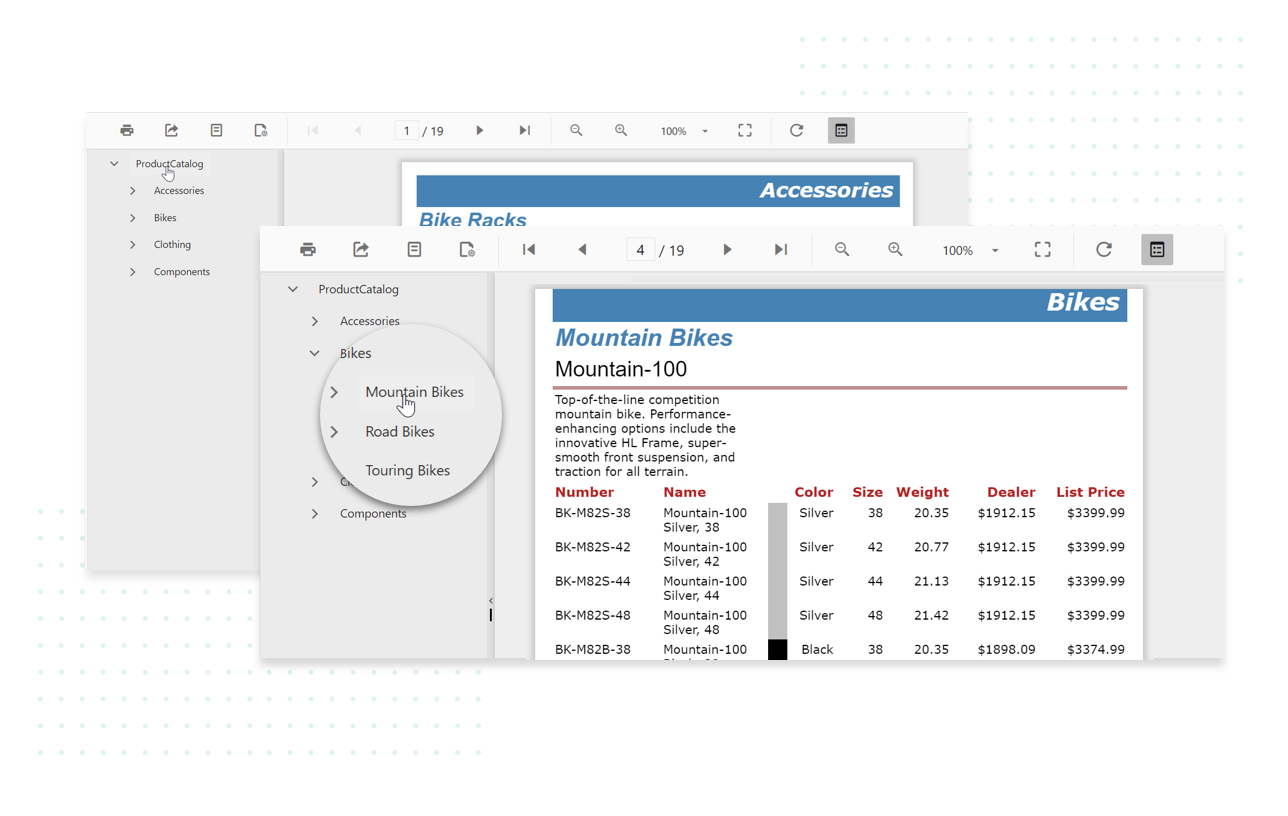
Document map

The document map displays a separate side pane or table of contents (TOC) next to the report. Clicking a link in the document map jumps to the respective report page . All document map items of the report sections and table groups are arranged in a hierarchy of links.

Displays separate side pane (TOC) to easily jump to a specific page using document map feature

Interactive sorting

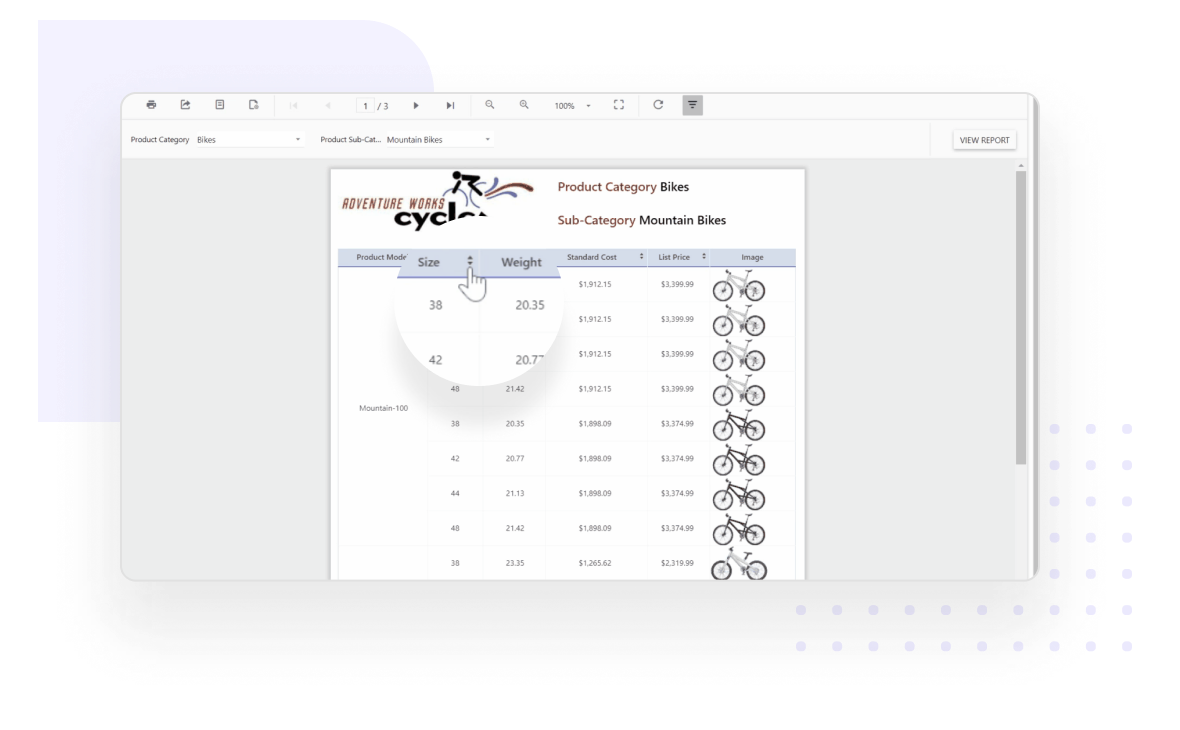
Table report items are displayed with sort icons in a column header or group header cell, enabling a user to sort or reverse the sort order of a column. You can specify sorting criteria for group rows or columns, as well as for detail rows or columns. You can also combine fields into a single group expression.

Sort the table data at runtime using the interactive sorting feature

Nested data regions

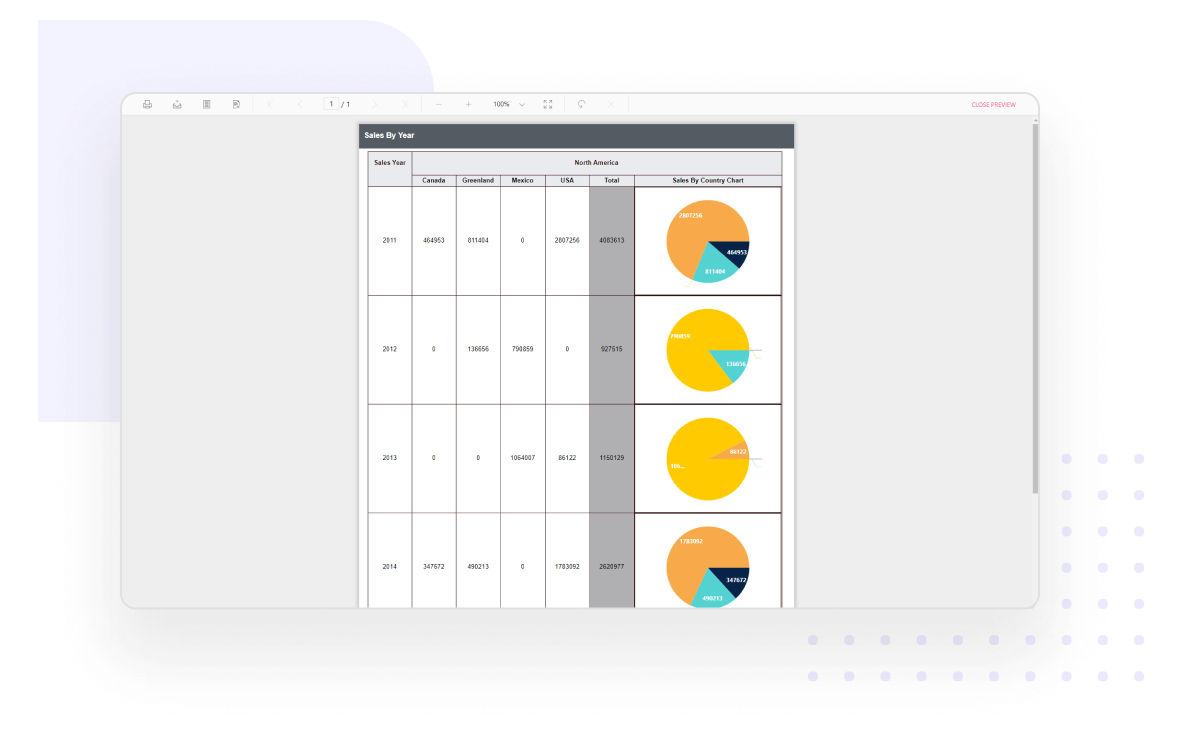
Visualize reports with nested data regions by placing charts, maps, gauges, and indicators inside another data region to display data and information in detail.
Report Viewer renders chart report item inside matrix as nested data region

Enterprise-Ready Compliance

Bold Reports helps you meet key security and compliance standards. All activity logs are safely stored, can’t be changed, and are easy to export when needed.

ISO 27001
SOC 2 Type 2
GDPR Compliant
HIPAA Compliant

Enterprise-Grade Compliance

Bold Reports helps you meet key security and compliance standards. All activity logs are safely stored, can’t be changed, and are easy to export when needed.

Make Reporting a Natural Part of Your Product

Bold Reports helps you create fully customized reports and embed them into your application in minutes. It’s simple, flexible, and designed to match your brand.

Make Reporting a Natural Part of Your Product

Bold Reports helps you create fully customized reports and embed them into your application in minutes. It’s simple, flexible, and designed to match your brand.