
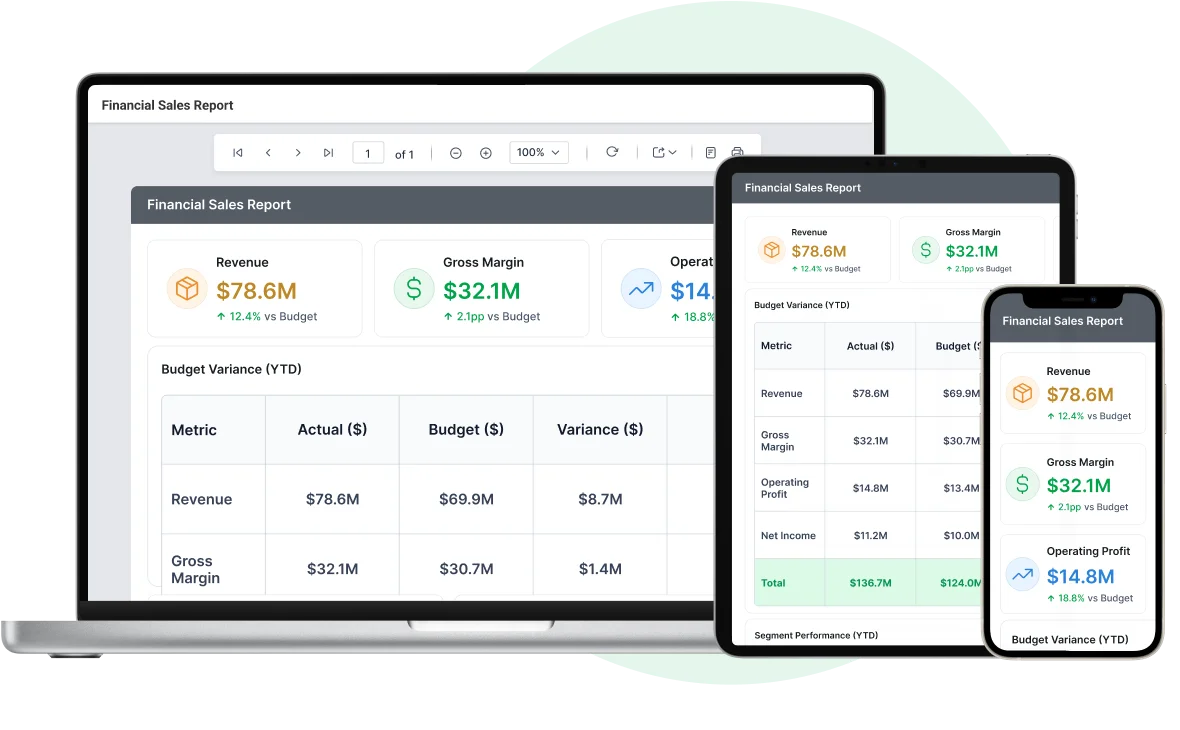
Blazor Report Viewer - Effective and Featur -Rich Reporting

  • Easy-to-display paginated and printable reports.
  • Supports popular Microsoft SSRS RDL and RDLC reports.
  • Effortlessly display large-scale reports with instant load times.
  • Easily print or export reports in various formats from the application.
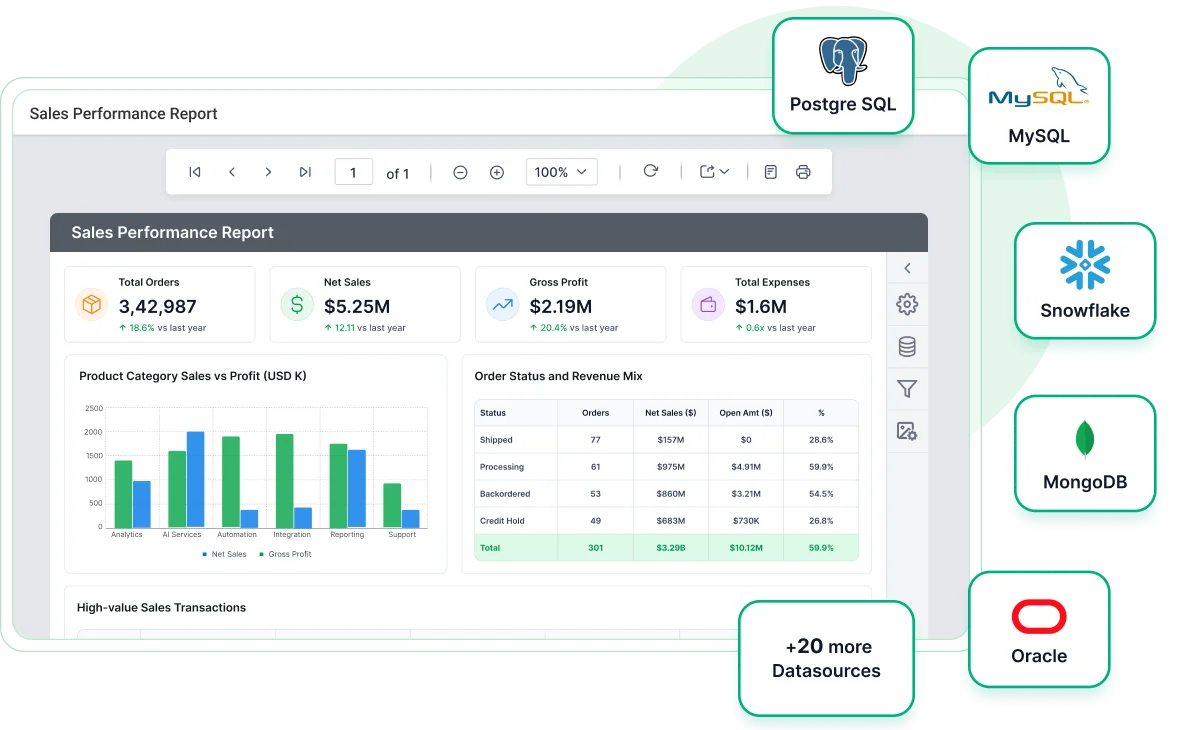
  • Supports SQL Server, MySQL, PostgreSQL, and 20+ data connectors.
Blazor Report Viewer
Trusted by leading companies

J&J

Schneider

Bridgestone

Siemens

Verizon

HP

Fidelity

Intel

Overview

Overview

The Blazor Report Viewer efficiently accesses, displays, and interacts with SSRS RDL and RDLC reports from diverse data sources. It supports localization, multiple export formats (PDF, Excel, CSV) and customizable printing. Interactive features like drill-down, drill-through, hyperlinks and subreports enrich user experience. Seamlessly integrates with applications, offering role-based access control for security.

Frontend & UI Frameworks
JavaScript
JavaScript

Angular

angular-reporting-framework
React
react-reporting-framework
.NET Platforms
.NET Core
dotnet-core-reporting
.NET Web
dotnet-web-reporting
.NET MVC
dotnet-mvc-reporting

Simplify Reporting with a Full-Featured Blazor Report Viewer

Deliver a seamless and intuitive report viewing experience using the Blazor Report Viewer, designed for clarity, accessibility, and performance across all devices. 

Reports from anywhere

The Blazor Report Viewer displays reports that provide information, insights, and trends:

  • Access RDL and RDLC reports from any location using the Blazor Report Viewer.
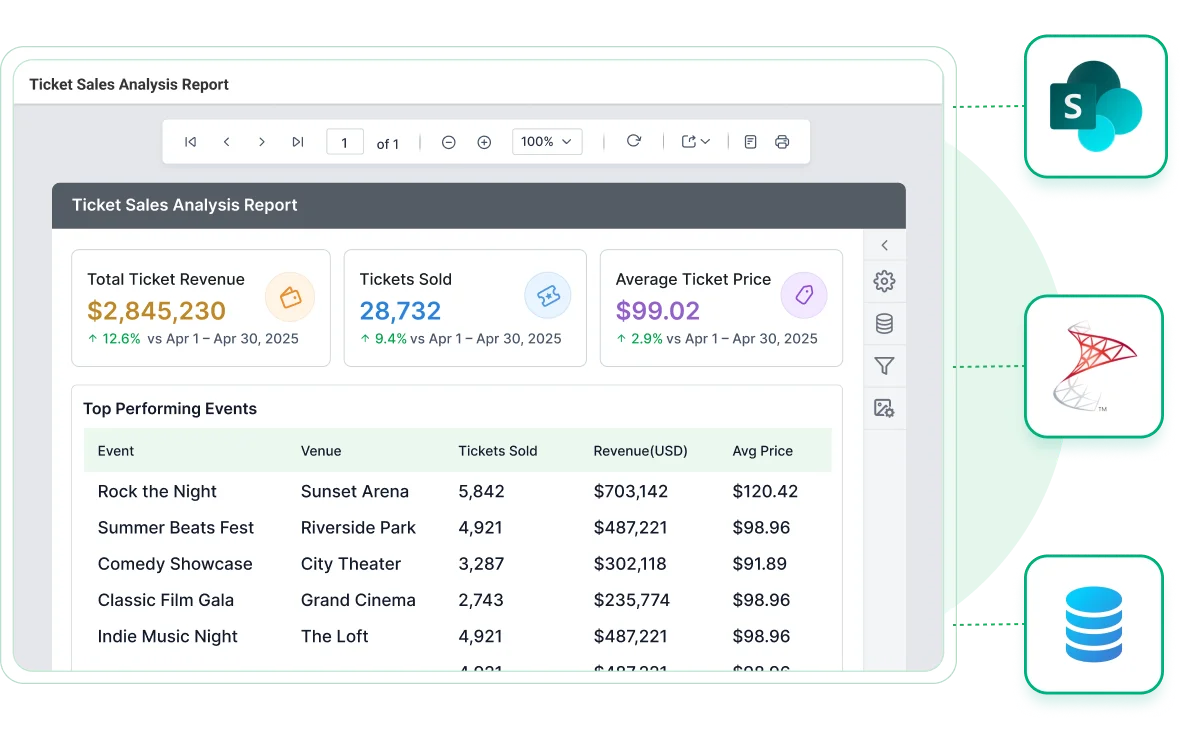
  • You can connect with a report server, whether from Microsoft SSRS, SharePoint, cloud storage, or embedded applications.
Reports from anywhere

Connect to any datasource

Consume data from a wide variety of data providers that are in local or server databases:

  • Built-in data sources: Microsoft SQL Server, Microsoft SQL Azure, SQL CE, XML, Microsoft Access, Oracle, OLEDB, and ODBC.
  • Business object data sources: IList, DataSet, and DataTable.
  • Custom data processing extensions: MySQL, SQLite, PostgreSQL, and more.
Connect to any data source

Eye-popping data visualization

The Blazor Report Viewer displays reports that provide information, insights, and trends:

  • Basic items: Text box, image, line, and rectangle.
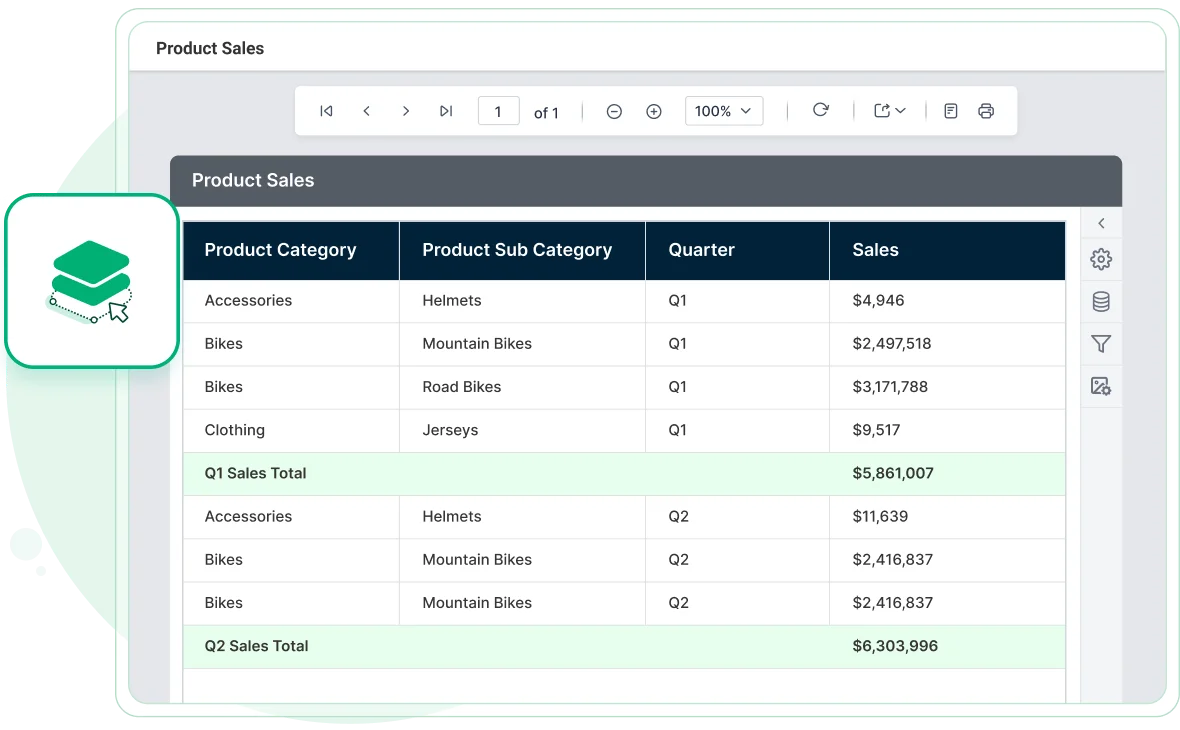
  • Data region items: Table, matrix (pivot table), and list.
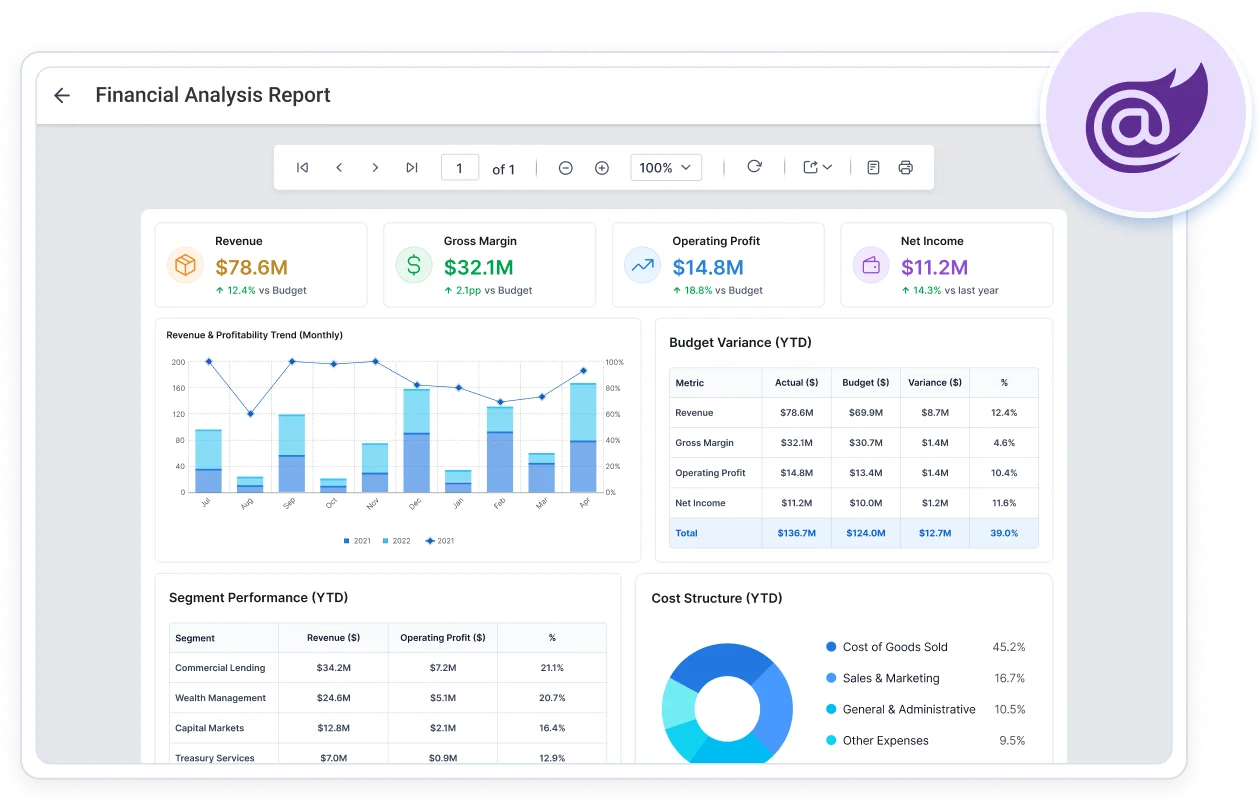
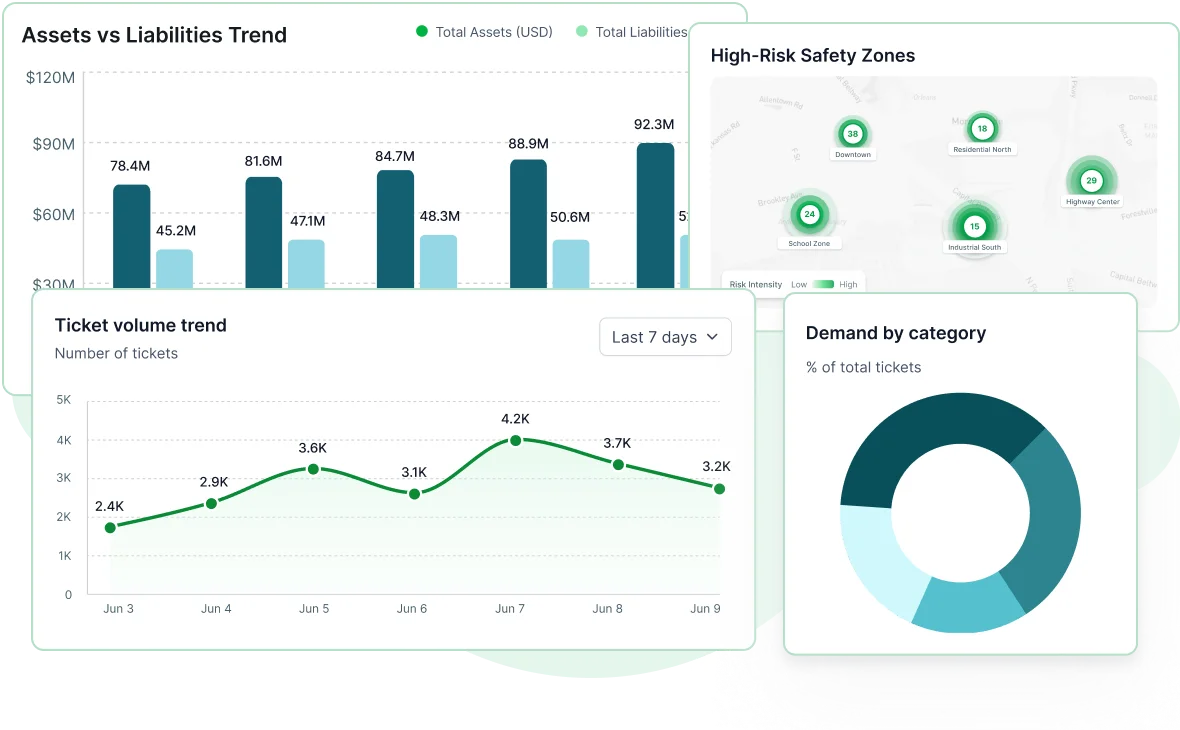
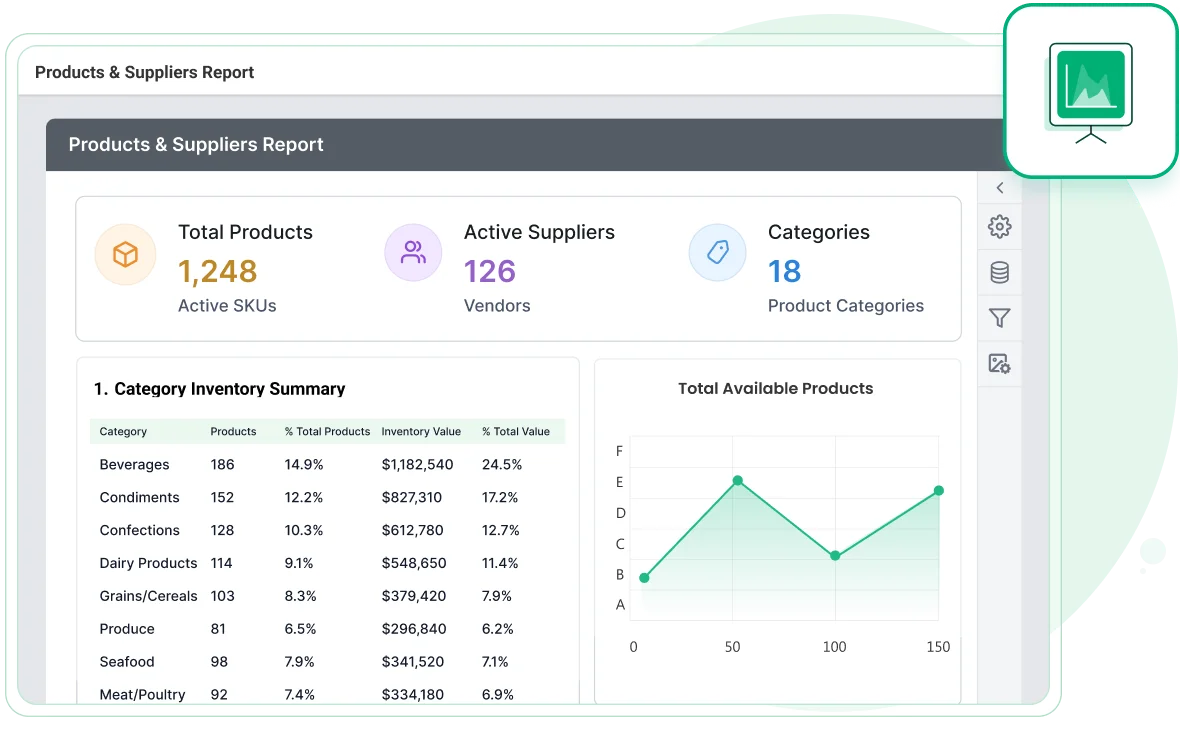
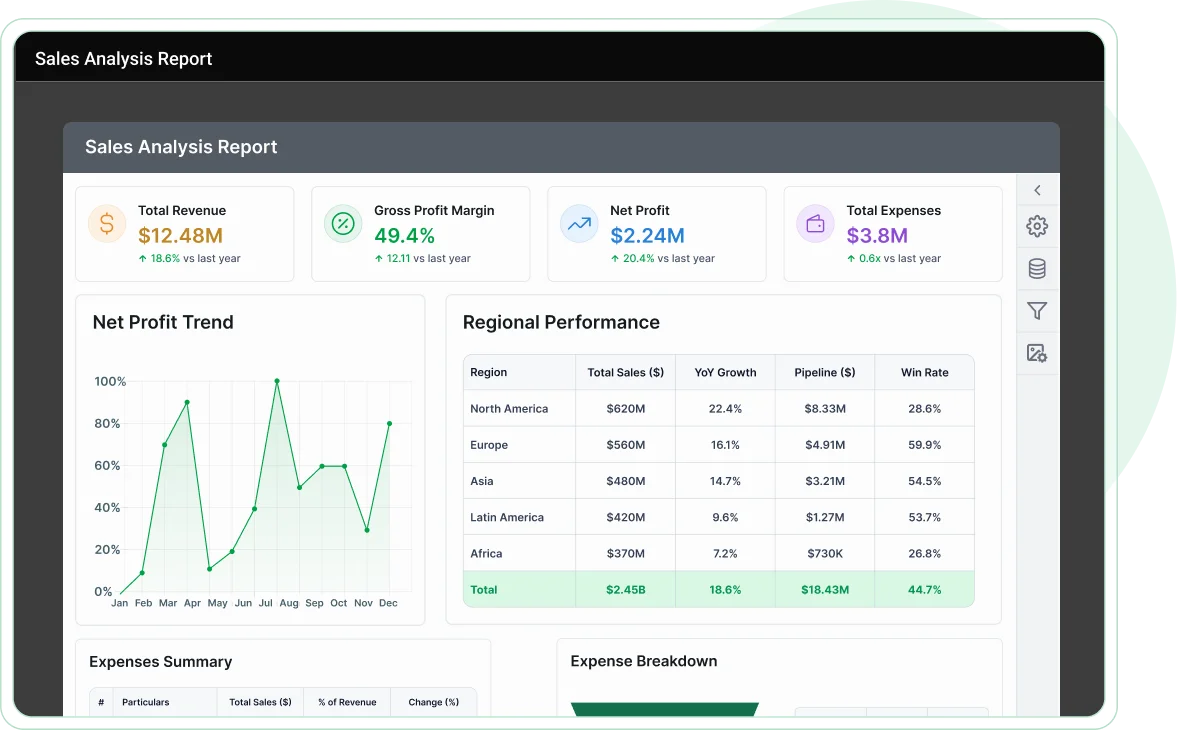
  • Data visualization: Charts, sparklines, data bars, gauges, indicators, and maps.
  • Custom report items: Barcodes, QR barcodes, E-signature, and more.
Eye-popping data visualization

Presentation-ready reports

Visualize your information with unmatched clarity by highlighting data on demand using the Blazor Report Viewer. Supported data customization options include:

  • HTML/rich text rendering.
  • Conditional formatting.
  • Simple and complex expressions.
Presentation-ready reports

Data shaping

View organized and shaped data to make bolder business decisions using the following techniques:

  • Sorting
  • Filtering
  • Grouping
  • Summaries and aggregates
  • Calculated fields
Data shaping

Report parameters

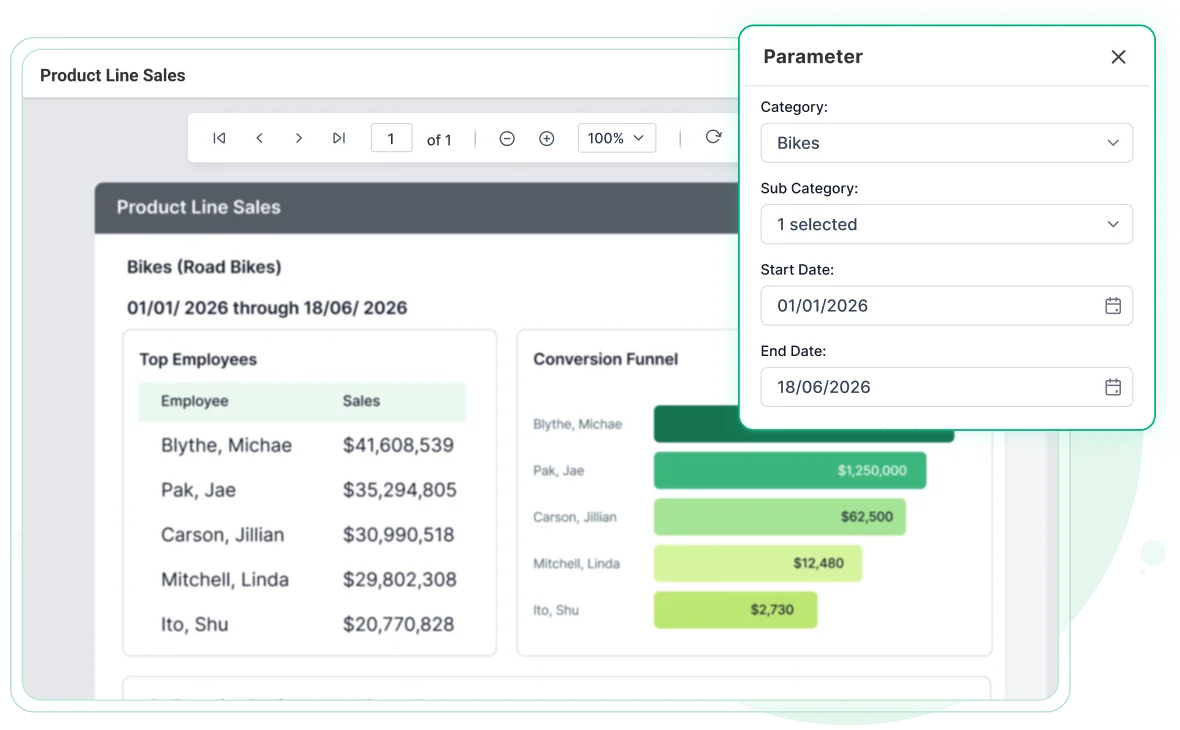
Report parameters are one of the most widely used features in Bold Reports to enable interaction with RDL/RDLC reports at runtime. The following parameter types allow you to control data filtering, customization, and presentation, enhancing the user experience.

  • Cascading parameters
  • Query-based (Dataset) parameters
  • Non-query (Static) parameters
  • Multi-value parameters
  • Custom parameter layouts
Report parameters

Built-in themes

  • Choose from Material, Bootstrap, and Fabric themes or use the high-contrast theme for better accessibility.
  • Each theme ensures pixel-perfect alignment and consistent design across applications.
Built-in themes

Responsive rendering

  • The Blazor Report Viewer automatically adapts to any screen size.
  • It renders optimally on phones, tablets, and desktops, ensuring smooth performance across all devices.
Responsive rendering
Blazor

Ready to Build with the Blazor Report Viewer?

Explore Bold Reports with a free trial or schedule a personalized product demo.

Enhanced Reporting Experience for Blazor Viewer

Easily manage how reports are delivered and presented with flexible output options and customization capabilities tailored to your application needs.

Interactive reports

Supports rich runtime interactions such as drill down, drill through, hyperlinks, bookmarks, document maps, subreports, and nested data regions for enhanced detailed exploration.

Multicolumn reports

Display data in multiple adjacent columns for professional layouts such as mail merges, product catalogs, business cards, newsletters, and other document formats.

Print preview

Configure print settings such as paper size, margins, and orientation, then preview the final output to ensure accurate formatting before printing and avoid layout inconsistencies.

Customization

Print or export your reports directly from the toolbar in formats such as PDF, Word, Excel, PowerPoint, CSV, XML, and HTML, with pixel-perfect accuracy preserved across all outputs.

Developer

Developer-friendly APIs

The Blazor Report Viewer provides full control over UI elements such as the toolbar, parameter block, pages, and dialogs, enabling flexible customization of report behavior.

globalization-and-localization

Globalization & localization

Support global audiences with culture settings and localized static text, enabling applications to deliver content effectively in multiple languages across regions worldwide.


Enterprise-Ready Compliance

Bold Reports helps you meet key security and compliance standards. All activity logs are safely stored, can’t be changed, and are easy to export when needed.

soc-2-type-ii-compliance
iso-27001-certification
gdpr-compliance
hipaa-compliance

Ready to Add Custom Reports to Your Application?

With Bold Reports, you can build and embed reports that feel like a native part of your application fully branded and easy to use. 

No credit card required.