
The Secret Drain: How Data Blindness Breaks Business
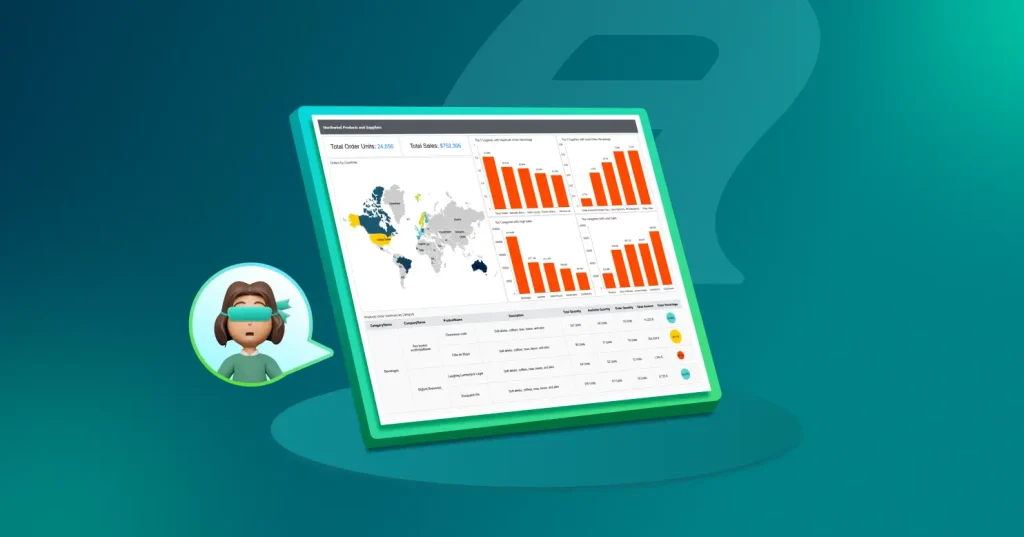
Ever feel like your business is doing everything right, hitting targets, running smoothly, but something still feels off? You’re not alone. Many leaders are discovering that the real issue isn’t performance, but data visibility. Hidden data problems like outdated reports, disconnected systems, and missed metrics can quietly drain revenue without anyone noticing.
This blog dives into the concept of data blindness, from how it happens to what forward-thinking leaders are doing to fix it. It also explores how tools like Bold Reports® are helping teams move from gut feelings to confident, data-backed decisions. From real-time dashboards to smarter workflows, it’s about seeing clearly and acting faster.
If you’ve ever had that sinking feeling that the numbers just don’t add up, this one’s for you.
How Data Blindness Can Break Businesses and What Leaders are Learning
That Sinking Feeling: When the Numbers Just Don’t Add Up
Many business leaders know the feeling, when growth targets are being met, teams are executing, and yet… something feels off. It’s not always a glaring issue, but a subtle, persistent sense that the numbers aren’t telling the full story. This is often the first sign of revenue leakage; a slow, silent drain on the bottom line caused by incomplete, inaccurate, or inaccessible data.
In fact, in 2016, Forrester Research reported that between 60% and 73% of all enterprise data goes unused for analytics. That means critical insights are often buried or overlooked, making it nearly impossible to spot inefficiencies or emerging risks until it’s too late.
Outdated reporting systems leave companies flying blind, unable to get real-time insights into sales performance, customer churn, or operational bottlenecks. Imagine steering a ship through dense fog: that’s what it feels like when reports are delayed, inconsistent, or just plain wrong.
And the cost? It’s not trivial. A 2023 Forrester report found that more than one-quarter of global data and analytics professionals estimate their organizations lose over $5 million annually due to poor data quality, with 7% reporting losses of $25 million or more. It’s a silent killer of growth, and one that’s far more common than many realize.
The Battle for Clarity: Turning Raw Data into Revenue
The solution isn’t simply more data; it’s smarter use of data. The real challenge lies in transforming chaotic, fragmented information into clear, actionable insights that drive confident decision-making.
Many organizations are still stuck using outdated reporting tools; systems that demand hours of manual work, can’t adapt to global data needs, and fail to surface critical trends in time. The issue isn’t a lack of effort; it’s a lack of modern, intelligent tools built for today’s pace of business.
This is where Bold Reports by Syncfusion® is making a noticeable impact.
The Bold Reports Revolution: See Everything, Lose Nothing
Bold Reports is a modern reporting platform designed to eliminate the fog of data blindness. It is helping businesses across industries regain control of their data and protect their revenue with exactitude and speed. This is how:
1. Bold Reports helps businesses migrate from SQL Server reporting systems without the usual headache
It feels painful to migrate from legacy SSRS systems, but Bold Reports simplifies the process for many. Organizations are moving their critical reports to a platform that’s built for the future.
2. Global Insights, Local Languages
For companies with international teams, Bold Reports offers localization of reports. This breaks down communication barriers and helps data be understood across markets.
3. Empowering Every Decision-Maker
With tools like the Tablix wizard, complex datasets are transformed into interactive, visually compelling dashboards. Decision-makers don’t just see numbers; they can understand them at a glance.
4. Deployment Without Drama
Whether deploying on AWS, Azure, or GCP, or containerizing for microservices, Bold Reports integrates smoothly into modern infrastructures. It’s scalable, dependable, and fast.
5. Real-Time Data and Real-Time Revenue Protection
Bold Reports enables users to build real-time dashboards that function as early warning systems. Businesses can spot churn risks, monitor customer satisfaction, and optimize sales cycles.
How Bold Reports Helps My Team Stay Ahead
In my role as a research pod lead, precision and timeliness are nonnegotiable. Our team is responsible for identifying patterns in revenue-related processes, auditing return workflows, and ensuring every case is managed with accuracy and speed to determine if everything was done to save the customer. That’s a tall order when you’re working across multiple systems and timelines.
Bold Reports has always been more than just a reporting tool. It’s a central hub that brings clarity to our data and structure to our workflows:
1. Real-Time Visibility
With Bold Reports live dashboards, I can monitor my team’s performance, track case evaluation periods, and spot possible red flags before they escalate. This has helped my team stay aligned with our 48-hour evaluation window and make sure no cases fall through the cracks. We can grab every opportunity to save a customer and thus prevent churn.
2. Audit Confidence
Manual monthly audits are a bit time-consuming, where we have to get into individual cases and learn from the tickets. Now, we can quickly generate detailed, filterable reports that make it easy to verify data accuracy for both Essential Studio® returns and Bold-specific cases.
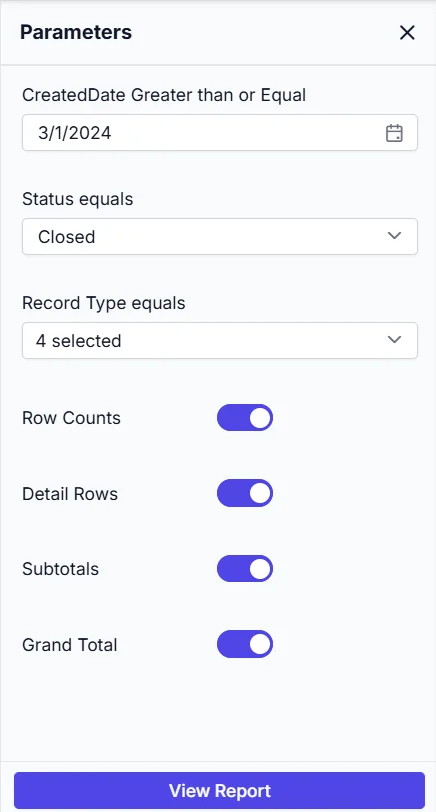
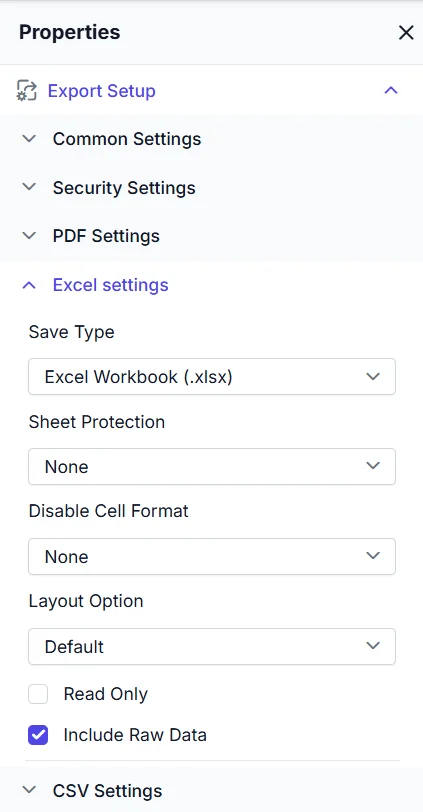
The first of the previous screenshots shows some filters we use and review data like ESEE returns, while the other shows exporting options for sharing or offline analysis. Together, they reflect just how far things have changed from the days of manual audits.
3. Smarter Workflows
The trends we capture and analyze in Bold Reports have gone a long way in enabling us to refine our workflows, update our training materials, and make our documentation reflect real-world challenges. It has helped us move from reactive to proactive workflows.
4. Empowered Team Members
Bold Reports supports self-service access, so team members can pull the data they need without waiting on IT. That autonomy speeds up project assignments and helps everyone stay focused. Everyone is able to keep up with cases assigned to them and hold themselves accountable from the nature of the reports.
5. Data-Driven Leadership
Whether I’m preparing for a meeting with the legal team or leading a weekly sync, Bold Reports gives me the insights I need to lead with confidence and back every decision with data.
In a role where every hour and every detail counts, Bold Reports helps us work smarter, not harder. It’s the clarity we needed to move from gut feeling to data-driven action.
Final Thoughts
Bold Reports® isn’t just a reporting tool to us; it’s a strategic turnaround. It helps organizations identify revenue leaks, unearth hidden opportunities, and move forward with clarity and confidence.
For companies who are serious about growth, the question isn’t whether they can afford to invest in better reporting; it’s whether they can afford not to. You can try Bold Reports today by signing up for a free-30-day trial!






