
Inventory Reporting Tools: How to Build Inventory Reports
TL;DR:
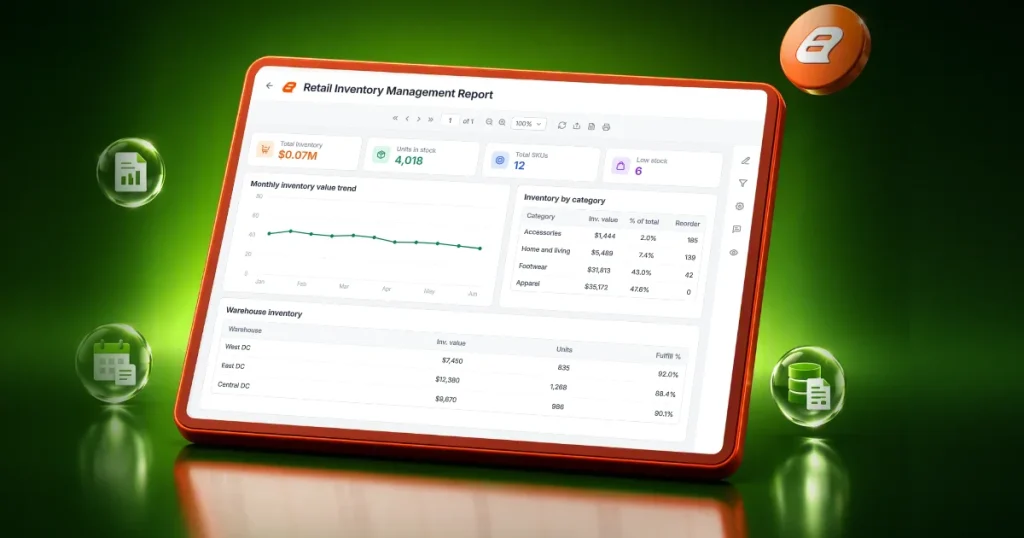
Inventory reports help businesses track stock levels, monitor inventory movement, prevent stockouts, optimize purchasing decisions, and maintain accurate inventory valuation. The most effective inventory reports combine reliable inventory data, standardized calculations, and automated delivery, giving operations, procurement, warehouse, and finance teams the visibility they need to make informed decisions.
Introduction
An inventory report turns stock quantities, warehouse transactions, supplier data, and inventory valuation information into a single view that helps organizations prevent stockouts, reduce carrying costs, and make better purchasing decisions.
As inventory operations grow, spreadsheets and ad hoc reporting become increasingly difficult to manage. Warehouse teams need visibility into stock levels, procurement teams need replenishment insights, and finance teams need accurate inventory valuation. However, inventory data is often scattered across multiple systems, making it difficult to gain a complete picture.
Without effective inventory reporting, businesses risk stockouts, excess inventory, inaccurate forecasts, and operational inefficiencies. Accurate reporting helps teams improve inventory visibility, maintain inventory accuracy, and make more informed decisions.
This guide explains what inventory reports are, why they matter, and how inventory reporting tools help organizations create, automate, distribute, and scale inventory reporting across operations.
What is an inventory report?
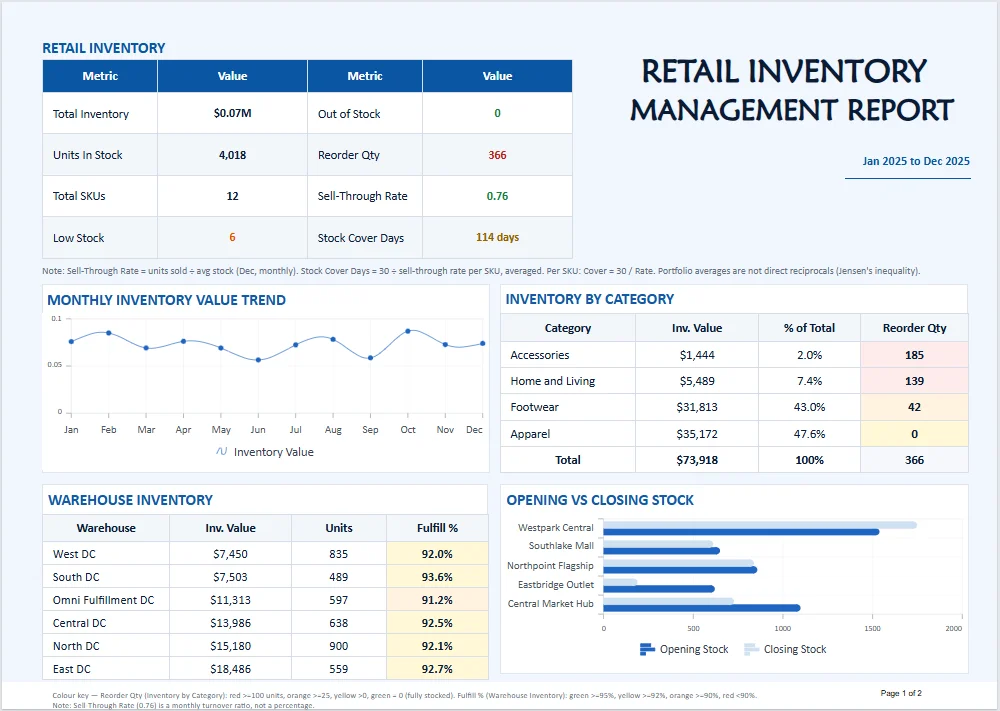
An inventory report summarizes inventory levels, movement, availability, and value, helping organizations understand their current inventory and make informed business decisions.
Whether it’s used for inventory visibility, replenishment planning, warehouse operations, or inventory valuation, an inventory report transforms raw inventory data into information that teams can analyze and act on.
Most inventory reports include:
-
- Current inventory quantities and stock availability
- Product, SKU, and warehouse location information
- Inventory receipts, transfers, adjustments, and movement
- Reorder levels, replenishment requirements, and stock alerts
- Inventory costs, valuation data, and performance metrics
A well-designed inventory report helps organizations understand what inventory is available, which products need replenishment, where excess stock exists, and how much inventory is currently worth. By providing a clear view of inventory performance, inventory reports support better inventory control, cost management, and operational decision-making.
Why inventory reports matter
Inventory reports do more than show current stock levels. They provide the visibility needed to manage inventory effectively, reduce operational risk, and support better decisions across warehouse operations, procurement, finance, and supply chain teams.
1. Improve inventory visibility
Inventory reports provide a centralized view of stock across products, warehouses, and locations. This makes it easier to understand stock availability, identify inventory imbalances, and respond quickly to changing demand.
2. Prevent stockouts and excess inventory
Inventory reports help organizations maintain optimal inventory levels by identifying products that require replenishment while highlighting slow-moving or overstocked items that tie up capital and warehouse space.
According to NetSuite, inventory carrying costs often comprise 20% to 30% of total inventory value. These costs include expenses associated with holding inventory, such as storage, insurance, shrinkage, and depreciation. Inventory reports help organizations monitor stock levels and identify slow-moving inventory.
3. Support purchasing and replenishment decisions
Procurement teams use inventory reports to monitor inventory consumption, reorder points, supplier lead times, and stock movement trends. These insights help improve purchasing accuracy and reduce supply disruptions.
4. Strengthen inventory valuation and financial reporting
Inventory is a significant business asset. Inventory reports help finance teams track inventory value, support audits, maintain accurate records, and improve financial reporting reliability.
5. Improve inventory performance and forecasting
Historical inventory data helps organizations identify demand patterns, monitor inventory turnover, and forecast future inventory requirements more accurately. Better forecasting helps reduce waste while maintaining service levels.
By transforming inventory data into actionable insights, inventory reports help organizations improve inventory control, reduce costs, strengthen inventory management processes, and support more informed business decision-making.
This value is reflected in G2 customer review feedback. As Jonathan K., Senior Clinical PreSales Consultant, noted:
“One of the biggest benefits has been the scheduling and automation features, which reduce the manual effort required to generate and distribute reports. Instead of spending hours preparing reports, we can automate recurring tasks and focus on more valuable activities.”
What to look for in inventory reporting tools
Organizations often move beyond spreadsheets and manual reporting as inventory operations grow in complexity. The right inventory reporting tools help teams centralize inventory data, automate report generation, improve accuracy, and provide real-time visibility across warehouses, suppliers, and products.
When evaluating inventory reporting software, look for the following capabilities:
-
- Multiple data source connectivity: Connect inventory data from ERP systems, warehouse management systems (WMS), databases, cloud applications, and spreadsheets.
- Automated report scheduling: Automatically generate and distribute inventory reports to warehouse, procurement, operations, and finance teams.
- Interactive reporting: Enable users to filter inventory reports by warehouse, supplier, category, location, or date range.
- Inventory KPI tracking: Monitor metrics such as inventory turnover, stock availability, reorder status, inventory aging, and inventory valuation.
- Custom report templates: Use reusable inventory report templates to standardize reporting and reduce development effort.
- Export and sharing options: Deliver reports in formats such as PDF, Excel, Word, and CSV.
- Role-based security: Restrict access to inventory data based on user roles and responsibilities.
- Embedded reporting: Integrate inventory reports directly into business applications for easier access and decision-making.
The best inventory reporting software combines these capabilities in a single platform, helping organizations scale reporting while reducing manual effort.
What should an inventory report include?
An effective inventory report should provide visibility into inventory levels, movement, valuation, and replenishment needs. While inventory report formats vary by business requirement, most inventory reports include the following core components.
| Component | Why It Matters | Typical Information Included |
| Product Information | Identifies and classifies inventory consistently. | SKU, Product Name, Category, Brand, Supplier |
| Inventory Levels & Status | Tracks stock availability and inventory conditions. | Quantity on Hand, Available Stock, Reserved Stock, Backorders, In-Transit Stock |
| Warehouse & Location Data | Shows where inventory is stored. | Warehouse, Distribution Center, Region, Storage Location, Bin Number |
| Inventory Metrics & KPIs | Measures inventory performance. | Inventory Aging, Inventory Turnover, Days on Hand, Safety Stock |
| Replenishment Data | Supports purchasing and restocking decisions. | Reorder Point, Reorder Quantity, Lead Time, Stock Alerts
|
| Cost & Valuation Data | Supports financial reporting and inventory valuation. | Unit Cost, Landed Cost, Inventory Value, FIFO, Weighted Average Cost |
| Filters & Parameters | Allows users to customize report views. | Date Range, Warehouse, Category, Supplier, Inventory Status |
Not every inventory report requires all these components. For example:
- Stock inventory report: Tracks inventory quantities, item details, and storage locations.
- Inventory valuation report: Analyzes unit costs, inventory value, and valuation methods such as FIFO and weighted average cost.
Together, these components provide the visibility organizations need to improve inventory accuracy, optimize stock levels, and support better business decision-making.
Types of inventory reports
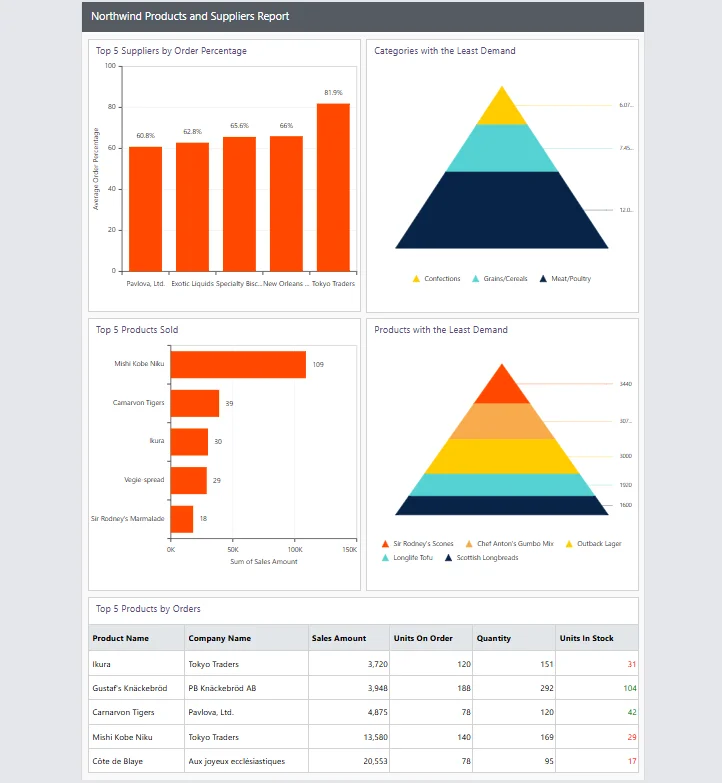
Different inventory reports support different business decisions. Some focus on stock availability, while others track inventory value, replenishment needs, or inventory performance.
| Report Type | What It Covers | Typical Users |
| Stock on Hand Report | Inventory quantities, available stock, warehouse locations | Warehouse, Operations |
| Inventory Valuation Report | Inventory value, costs, FIFO, weighted average cost | Finance, Accounting |
| Inventory Aging Report | Slow-moving stock, aging inventory, inventory value by age | Operations, Finance |
| Reorder Report | Reorder points, safety stock, replenishment needs | Procurement, Purchasing |
| Inventory Movement Report | Receipts, transfers, returns, inventory transactions | Warehouse, Supply Chain |
| ABC Analysis Report | Inventory classification by value or usage | Inventory Planning, Operations |
| Dead Stock Report | Obsolete inventory and inactive products | Operations, Finance |
Each report serves a different purpose. For example, a stock on hand report helps monitor inventory availability, while an inventory valuation report supports financial reporting and an inventory aging report identifies slow-moving inventory. Choosing the right report depends on the business questions teams need to answer.
Inventory report template example
Many organizations start with a prebuilt inventory report template to standardize reporting and reduce development time.
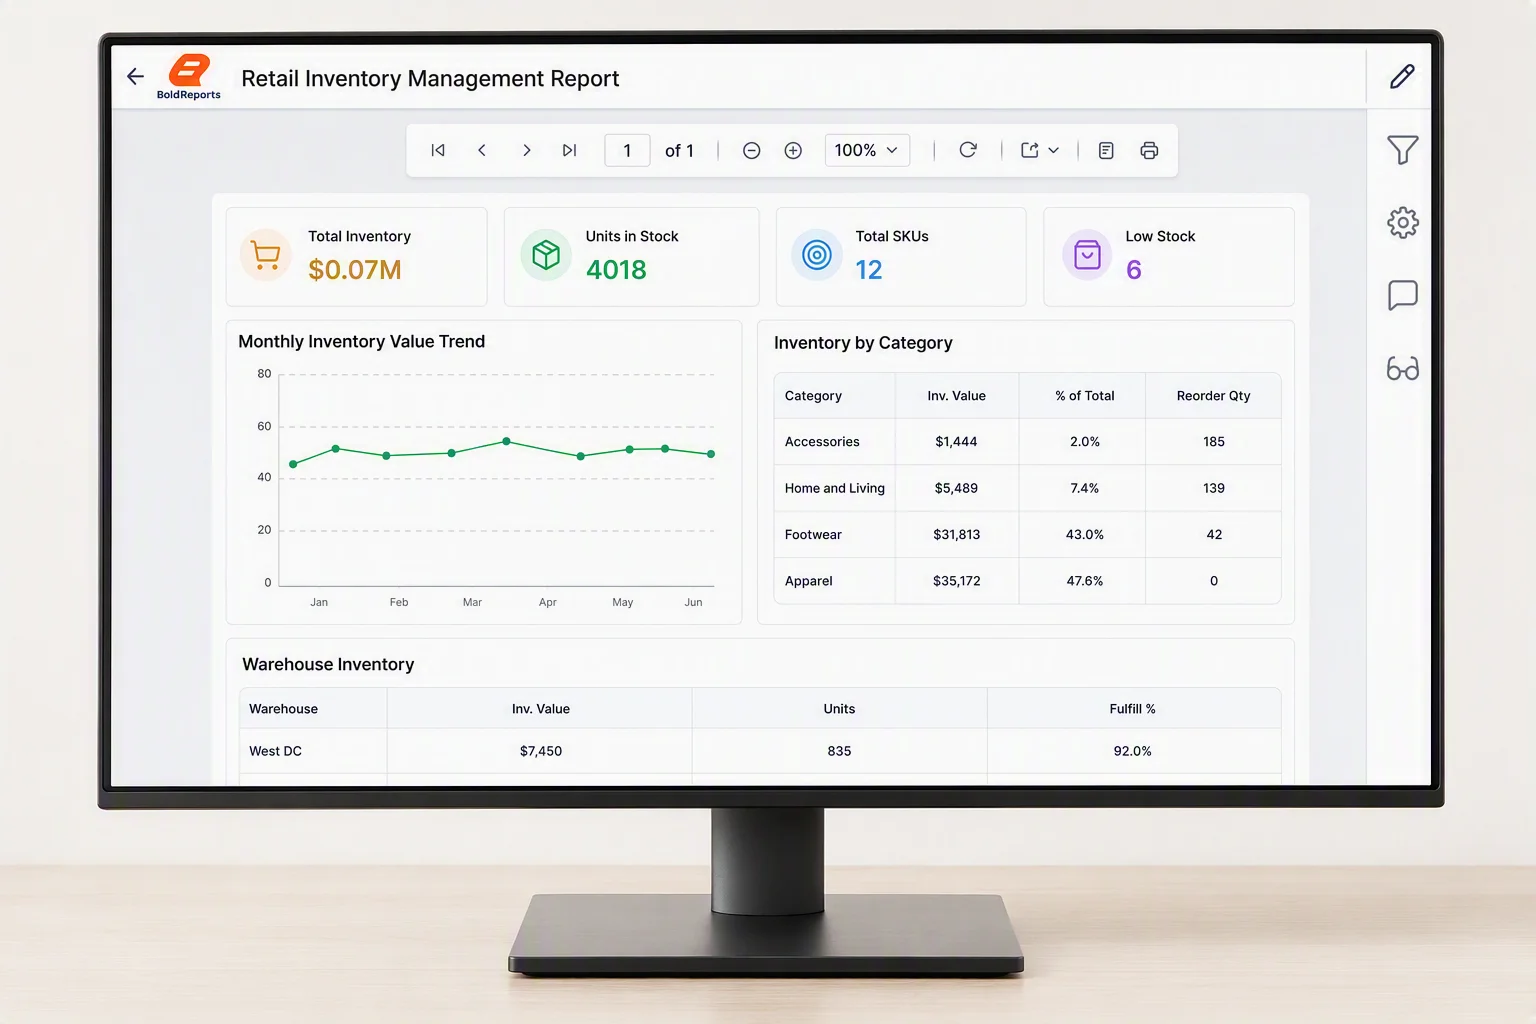
This template brings together key inventory data in a single view, including:
-
- Inventory summary metrics: provides a quick overview of inventory value, stock levels, active SKUs, and low-stock items requiring attention.
- Inventory value trends: helps track changes in inventory value over time and identify notable fluctuations.
- Category-level inventory analysis: shows how inventory is distributed across product categories and highlights reorder quantities for replenishment planning.
- Warehouse performance insights: provide visibility into inventory levels and fulfillment performance across warehouse locations.
Templates like this help organizations create consistent inventory reports faster by providing a customizable framework for inventory monitoring, analysis, and reporting.
Inventory reporting use cases across industries
Different industries have unique inventory management requirements, but all rely on inventory reports to improve visibility, support planning, and make informed business decisions.
Common inventory reporting use cases include:
-
- Retail: Monitor stock availability, inventory turnover, seasonal demand trends, and reorder requirements to improve merchandising and reduce stockouts.
- Manufacturing: Track raw materials, work-in-progress (WIP), finished goods inventory, and inventory valuation to support production planning and operational efficiency.
- Sales and Distribution: Analyze product demand, supplier performance, stock availability, and reorder risks to align inventory levels with customer demand.
- Insurance: Monitor replacement-value assets, claim-related resources, and operational inventories to support reporting accuracy and resource management.
- Government: Track equipment, supplies, fleet assets, and operational resources to improve accountability, resource allocation, and planning.
- Healthcare: Track medical supplies, pharmaceuticals, clinical equipment, and inventory utilization across departments to improve resource availability, reduce shortages, support patient care, and maintain accurate inventory records.
Effective inventory reports help organizations maintain inventory accuracy, optimize stock levels, and support better business decisions.
Key inventory KPIs to track
An inventory report is only as useful as the metrics behind it. These inventory KPIs help organizations measure inventory performance, optimize replenishment decisions, reduce inventory costs, and maintain healthy stock levels.
-
- Inventory turnover ratio: Measures how quickly inventory is sold and replenished during a specific period.
- Days inventory on hand (DIO): Indicates how long inventory remains in stock before being sold.
- Stock availability: Measures the percentage of inventory available to fulfill customer demand without delays.
- Inventory accuracy: Measures how closely system inventory records match physical inventory counts.
- Reorder point: Identifies when inventory should be replenished to avoid stock shortages.
- Gross margin return on inventory investment (GMROI): Measures how much profit is generated for every dollar invested in inventory.
- Sell-through rate: Evaluates how efficiently inventory is sold during a reporting period.
- Returns rate: Tracks the volume of returned products to identify quality, demand, or fulfillment issues.
Inventory turnover formula: Cost of Goods Sold (COGS) ÷ Average Inventory Value
Example: If annual COGS is $1,200,000 and average inventory value is $300,000, inventory turnover equals 4, meaning inventory is sold and replenished four times per year.
Days inventory on hand (DIO) formula: 365 ÷ Inventory Turnover
Example: If inventory turnover equals 4, DIO equals 91.25 days, meaning inventory remains in stock for approximately 91 days before being sold.
Reorder point formula: (Average Daily Usage × Lead Time) + Safety Stock
Example: If average daily usage is 20 units, lead time is 10 days, and safety stock is 50 units, the reorder point equals 250 units.
GMROI formula: Gross Margin ÷ Average Inventory Cost
Example: If gross margin is $500,000 and average inventory cost is $100,000, the GMROI equals 5, meaning the business generates $5 in gross profit for every $1 invested in inventory.
Other commonly tracked inventory KPIs include inventory aging, stockout rate, stock distribution by warehouse or category, top-selling products, inventory value, and supplier lead time. The right KPIs depend on the report’s objective and the decisions it supports.
Manual vs. Automated inventory reporting
Many organizations start with spreadsheets and manual reporting processes. As reporting requirements grow, automation helps improve accuracy, efficiency, and scalability.
| Reporting Factor | Manual Inventory Reporting | Automated Inventory Reporting |
| Data collection | Manual exports from multiple systems | Automatic data collection and updates |
| Accuracy | Higher risk of errors and inconsistencies | More reliable and standardized reporting |
| Time required | Time-consuming report preparation | Faster report generation and delivery |
| Scalability | Difficult to manage at scale | Supports growing inventory operations |
| Report distribution | Shared manually | Scheduled and automated delivery |
| Data freshness | Often based on periodic updates | Access to current inventory information |
As inventory operations become more complex, automated inventory reporting helps organizations reduce manual effort, improve reporting consistency, and provide stakeholders with timely inventory insights.
How to create inventory reports in 5 steps
Creating inventory reports involves more than exporting inventory data into a spreadsheet. Effective inventory reporting follows a structured process that combines reliable data, meaningful KPIs, report design, and validation to support informed business decisions.
1. Define the report’s purpose
Start by identifying the business question the report should answer. A stock availability report requires different information than a replenishment or inventory valuation report.
2. Collect and prepare inventory data
Gather inventory data from the systems that support your operations, including ERP platforms, warehouse management systems, databases, and spreadsheets. Validate and standardize the data before reporting.
3. Select the relevant KPIs
Choose the inventory KPIs that align with the report’s objective. Common metrics include inventory turnover, stock availability, inventory aging, reorder status, and inventory value.
4. Design the report layout
Organize information so users can quickly identify trends, issues, and opportunities. Filters such as warehouse, supplier, category, and date range make reports more flexible and useful.
5. Validate and publish reports
Verify calculations, inventory balances, inventory valuation figures, and KPIs before sharing the report. According to MetricHQ, inventory accuracy levels of 95% to 98% are generally considered acceptable for standard logistics operations, so inventory validation is an important step before distributing reports.
Once validated, publish reports to stakeholders and establish a consistent reporting process to keep information current.
Common challenges when creating inventory reports
Creating an inventory report is one thing. Keeping it accurate, reliable, and scalable as inventory operations grow is another.
1. Inconsistent inventory data
Inventory data often comes from multiple systems. Differences in product definitions, inventory statuses, and reporting standards can lead to inaccurate or conflicting results.
2. Limited visibility across locations
Consolidating inventory data across warehouses, stores, or distribution centers becomes increasingly difficult without centralized reporting.
3. Too many metrics
Including every available metric can make reports harder to analyze. Effective inventory reports focus on the KPIs that support decision-making.
4. Manual reporting processes
Spreadsheets and manual data exports may work initially, but they become time-consuming and difficult to maintain as inventory volume and reporting requirements increase.
5. Outdated inventory information
Reports based on stale data can lead to stock discrepancies, delayed replenishment decisions, and inaccurate planning. Addressing these challenges early improves reporting accuracy, reduces operational risk, and supports scalable inventory reporting.
Looking for a more efficient way to manage inventory reporting? Learn how modern reporting helps organizations reduce manual effort, improve reporting accuracy, and deliver timely inventory insights.
Best practices for better inventory reporting
Creating an inventory report is only the first step. To keep reports accurate, actionable, and easy to maintain, follow these inventory reporting best practices:
-
- Start with a clear objective: Define the business question the report should answer before selecting metrics or designing layouts.
- Use reliable inventory data: Standardize data sources, product definitions, and inventory statuses to improve reporting accuracy.
- Focus on meaningful KPIs: Track metrics that support decision-making, such as inventory turnover, stock availability, inventory aging, and reorder status.
- Keep reports easy to scan: Highlight key information and organize data logically so users can quickly identify trends and issues.
- Use filters and parameters: Allow users to analyze inventory by warehouse, supplier, category, location, or date range.
- Standardize calculations: Use consistent formulas across all inventory reports to ensure reliable comparisons and reporting accuracy.
- Establish a reporting schedule: Publish reports consistently to ensure stakeholders have access to current inventory information.
Consistent reporting practices improve data quality, strengthen trust in inventory reports, and help teams make more informed inventory decisions.
How to automate inventory reporting
As inventory operations grow, manual reporting becomes increasingly difficult to maintain. Automating inventory reporting helps organizations improve reporting accuracy, reduce manual effort, and ensure stakeholders always have access to current inventory data.
-
- Schedule recurring reports: Automatically generate daily, weekly, or monthly inventory reports.
- Automate report delivery: Send reports directly to warehouse, procurement, operations, and finance teams.
- Enable self-service reporting: Allow users to generate reports on demand using predefined filters and parameters.
- Centralize report access: Store reports in a shared location where users can easily access the latest information.
- Reduce manual errors: Eliminate repetitive data exports and report preparation tasks.
- Use inventory reporting tools: Leverage inventory reporting software to streamline report creation, distribution, and management.
Automated inventory reporting improves consistency, reduces administrative effort, and gives teams faster access to the inventory insights they need to make informed decisions.
How Bold Reports helps teams create inventory reports
As inventory data grows across systems, creating accurate inventory reports becomes more difficult. Bold Reports help organizations streamline inventory reporting and deliver insights more efficiently.
-
- Connect inventory data: Combine data from ERP systems, WMS platforms, databases, cloud applications, and spreadsheets.
- Create inventory reports: Build reports for stock availability, inventory valuation, replenishment planning, and inventory performance.
- Enable interactive reporting: Let users filter and customize inventory reports by warehouse, supplier, category, status, and reporting period.
- Automate reporting: Schedule report generation and distribution to key stakeholders.
- Embed reports anywhere: Deliver inventory insights directly within business applications.
- Secure access: Control report access with role-based permissions.
Bold Reports helps organizations improve inventory visibility, reduce manual effort, and scale inventory reporting with confidence.
Final thoughts
Inventory reports help organizations track stock levels, monitor inventory performance, support replenishment decisions, and maintain accurate inventory valuation. When built with reliable data, meaningful KPIs, and automated delivery, they provide the visibility needed to make better operational and financial decisions.
As inventory operations grow, manual reporting becomes harder to maintain. A scalable inventory reporting process helps teams improve accuracy, reduce manual effort, and ensure stakeholders always have access to timely inventory insights.
With Bold Reports®, organizations can connect inventory data from multiple sources, create interactive and pixel-perfect reports, automate report delivery, and embed reporting directly into business applications.
Ready to streamline inventory reporting? Start your free trial or schedule a personalized demo to see how Bold Reports can help you create, automate, and scale inventory reports.
Frequently asked questions
-
- 1.
What is an inventory report?
An inventory report summarizes inventory levels, movement, availability, and value. It helps organizations monitor inventory performance, support replenishment decisions, and maintain accurate inventory records.
- 2.
What are the most common types of inventory reports?
Common inventory reports include stock-on-hand reports, inventory valuation reports, inventory aging reports, reorder reports, inventory movement reports, ABC analysis reports, and dead stock reports.
- 3.
What inventory KPIs should I track?
Common inventory KPIs include inventory turnover, days inventory on hand (DIO), inventory accuracy, stockout rate, sell-through rate, reorder point, inventory aging, and inventory value.
- 4.
What data sources are commonly used for inventory reporting?
Inventory reports typically combine data from ERP systems, warehouse management systems (WMS), procurement platforms, e-commerce applications, databases, and spreadsheets.
- 5.
How is inventory data secured?
Bold Reports uses role-based access control (RBAC) to protect data and ensure only authorized users can access reports.
- 6.
How can I automate inventory reporting?
Organizations can automate inventory reporting by scheduling report generation, automating report delivery, centralizing report access, and using inventory reporting software that connects directly to inventory data sources.
- 7.
What should I validate before publishing an inventory report?
Verify inventory quantities, KPIs, calculations, inventory valuation figures, filters, and data sources to ensure the report is accurate, reliable, and ready for decision-making
- 1.






