
What Is Reporting? Definition, Types, Examples, and Tools

TL;DR:
Reporting is the process of turning raw data into structured, repeatable outputs like operational reports, financial statements, compliance documents, and KPI summaries so teams can track performance and make decisions using consistent metrics. In enterprise environments, modern reporting typically includes automation, secure access controls, scheduled delivery, and embedded, pixel-perfect reports for internal teams and customer-facing apps.
Introduction
When data lives across multiple systems, teams need a consistent way to communicate results that stakeholders can trust and act on. Without a reliable data reporting process, teams spend time reconciling numbers, decisions slow down, and leaders lose confidence in what’s true.
Traditional reporting often relies on static exports and manual workflows like spreadsheets, copy-paste updates, and one-off formatting. That can work for simple updates, but it breaks as data sources grow, reporting cycles accelerate, and more users need access.
A modern business reporting system solves this by standardizing metric definitions, enforcing secure access, and enabling automated reporting so the same numbers reach the right people on time. In many organizations, it also supports real-time reporting or near-real-time refresh when decisions can’t wait for batch cycles.
You typically need modern reporting when you require:
-
- Real-time or frequent refreshes from multiple data sources.
- Embedded reporting inside web portals and SaaS applications.
- Scheduled distribution and export to formats like PDF and Excel.
- Paginated, pixel-perfect reporting for operations, finance, and compliance.
This guide explains what reporting is, how it differs from dashboards and analytics, the main report types, common challenges, and what to look for in modern reporting tools.
What is reporting?
Reporting is the process of transforming data into structured, repeatable outputs used to monitor performance, support decision-making, and meet compliance requirements.
A report is the output of reporting: a structured view of data designed for a specific audience and purpose such as operations, finance, leadership, compliance, or customers.
Depending on the use case, reporting outputs may include:
-
- Dashboards that refresh frequently for monitoring.
- Visual summary reports with charts and highlights for quick review.
- Paginated reports with precise layouts for printing and exporting to PDF, Excel, or Word.
Ultimately, reporting is what turns raw data into trusted, repeatable answers so teams stay aligned, decisions are defensible, and the numbers hold up for all stakeholders, audits, and customers.
Reporting vs. Dashboards vs. Analytics
These terms are often used interchangeably, but they serve different purposes. Choosing the wrong one can lead to the wrong decisions. Here’s a quick overview:
-
- Reporting: Delivers authoritative, repeatable outputs for auditability, billing, and operational consistency.
- Dashboards: Provide a real-time or near-real-time view of performance so teams can monitor what’s happening in the moment.
- Analytics: Help teams explain why something is happening and decide what to do next using deeper slicing, testing, and modeling.
Use this table to quickly identify which approach fits your goal.
| Dimension | Reporting | Dashboards | Analytics |
| Primary goal | Document and distribute facts | Monitor key metrics quickly | Discover insights and drivers |
| Output | Paginated reports and exports | KPI cards and interactive charts | Exploratory analysis and models |
| Audience | Operations, finance, compliance, customers | Executives, managers, frontline leads | Analysts, data teams, product teams |
| Cadence | Scheduled or on demand | Near real-time | Ad hoc and iterative |
| Interactivity | Controlled parameters, filtering, and drill-down options | High-level filtering and drill-through options | Deep slicing, statistical testing, and modeling |
| Best for | Accuracy, auditability, and standardization | Visibility and alignment on key metrics | Explanation, optimization, and prediction |
| Examples | Statements, invoices, audit logs, and service level reports | Revenue or uptime dashboards | Churn drivers and pricing elasticity |
Reporting gives you trusted repeatable outputs, dashboards keep teams aligned on what’s happening right now, and analytics explains what’s driving changes so you can decide what to do next. In most organizations, the three work together not as replacements, but as a workflow.
Why reporting is critical for enterprise success today
As organizations scale, reporting often becomes fragmented across teams, tools, and regions. When there isn’t a consistent reporting framework, the business loses a trusted, shared view of performance, and execution slows down because teams spend more time reconciling numbers than acting on them. Without a consistent reporting workflow, you’ll have to deal with:
-
- Limited visibility across departments and systems: Teams can’t see end-to-end performance clearly, so results look different depending on which tool, team, or region you consult.
- Slower decisions due to unreliable information: Leaders react to outdated, incomplete, or conflicting data, which increases hesitation and forces repeated validation cycles.
- Misaligned metrics and definitions: Each group builds its own KPIs and logic, creating confusion and continuous rework to reconcile differences.
- Reduced transparency and accountability: When reporting varies by team, it’s harder to compare performance fairly, assign ownership, and hold consistent expectations.
- Delayed risk detection: Trends, anomalies, and early warning signals are missed because data isn’t standardized or monitored consistently across the organization.
- Lower operational efficiency: Inefficiencies stay hidden in disconnected spreadsheets and one-off reports, making it harder to identify cost drivers and process bottlenecks.
Over time, these issues compound, teams spend more effort reconciling numbers than improving outcomes, and leadership loses the reliable visibility needed to steer the business.
The three pillars of effective reporting
Effective reporting is not about showing more data. It is about helping people trust the numbers, find what they need quickly, and take the right next step. These three pillars make that possible.
1. Accuracy
If people do not trust the numbers, adoption drops and reviews turn into debates. To maintain accuracy, you need to:
-
- Validate data inputs with checks for missing values, duplicates, and unusual changes.
- Standardize KPI definitions, so each metric means the same thing across teams and tools.
- Assign clear ownership for datasets and metrics to prevent silent changes and version drift.
2. Accessibility
A report works only when the right people can access it easily and understand it fast. To make your data accessible, you’ll need to:
-
- Match access to roles so users get what they need without exposing sensitive information.
- Use dashboards for quick monitoring and reports for deeper review and sharing.
- Refresh data on a schedule that matches how decisions are made.
3. Actionability
Good reporting does more than describe results. It helps users decide what to do next. To make decisions quicker, you’ll need to:
-
- Add context with targets, trends, and comparisons, so performance is clear at a glance.
- Make insights easy to scan using short notes, clear labels, and a consistent structure.
- Support follow through with drill-down paths that help users see what changed and why.
When these pillars are in place, reporting becomes a practical decision tool, not just a record of what happened.
Types of reports with examples
Different report types support different needs from daily execution to long-term planning. Choosing the right report ensures that insights are relevant and useful for each level of decision-making.
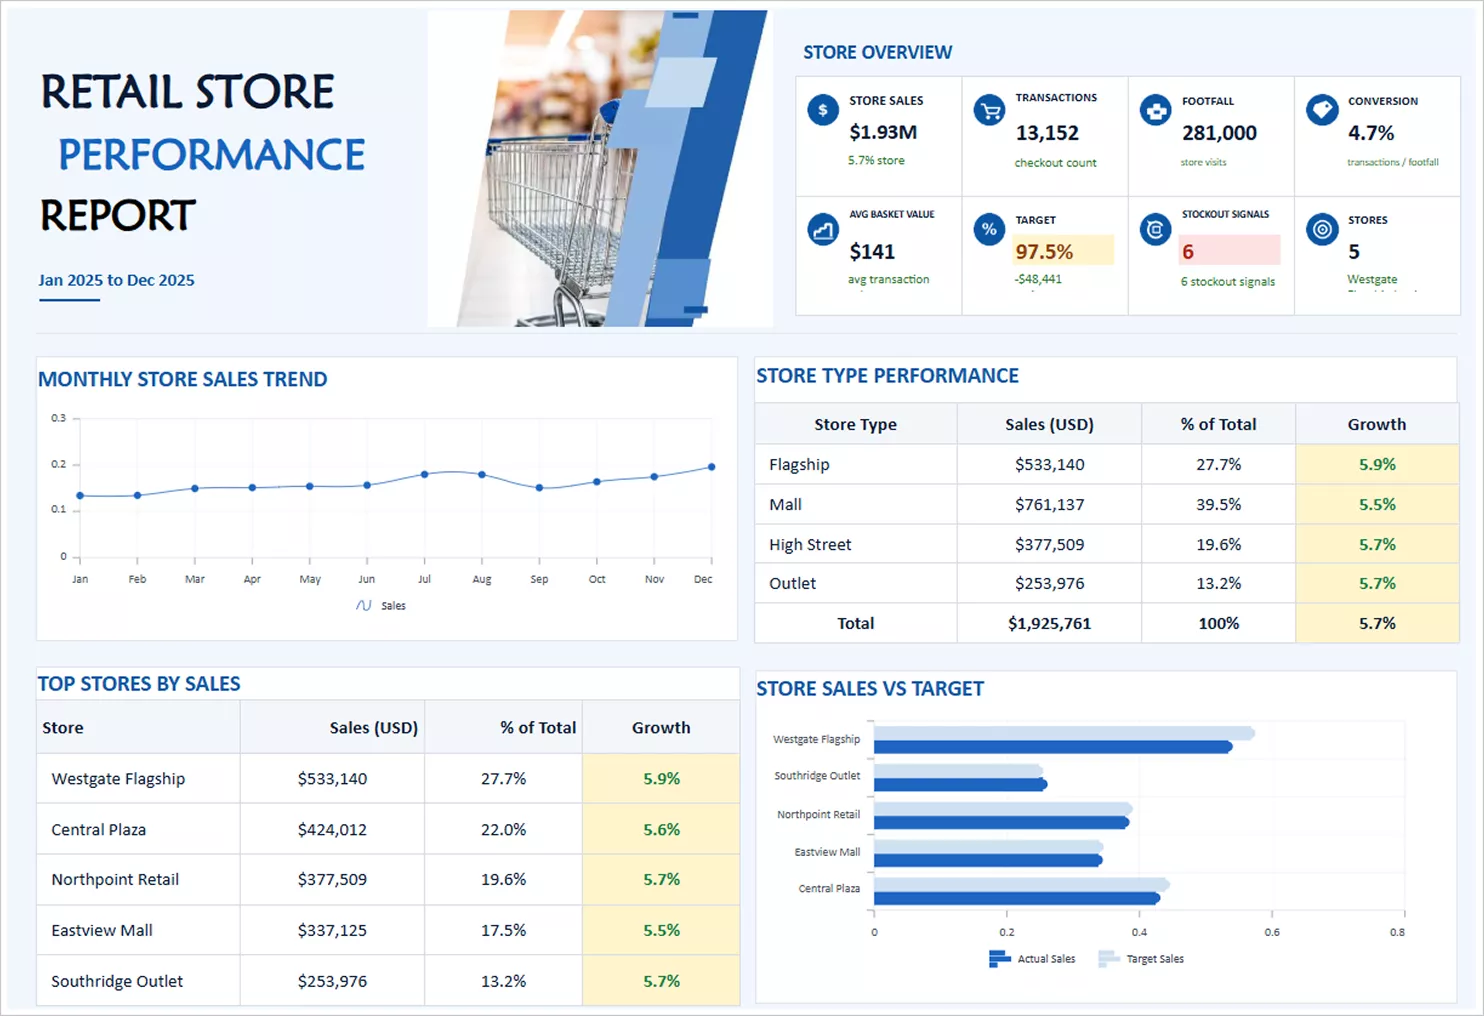
Operational reports
Operational reports track day-to-day activity so teams can spot issues early and respond quickly.
Examples: Daily sales vs. target by rep, open support tickets by priority, on-time delivery rate, inventory below reorder point.
Analytical reports
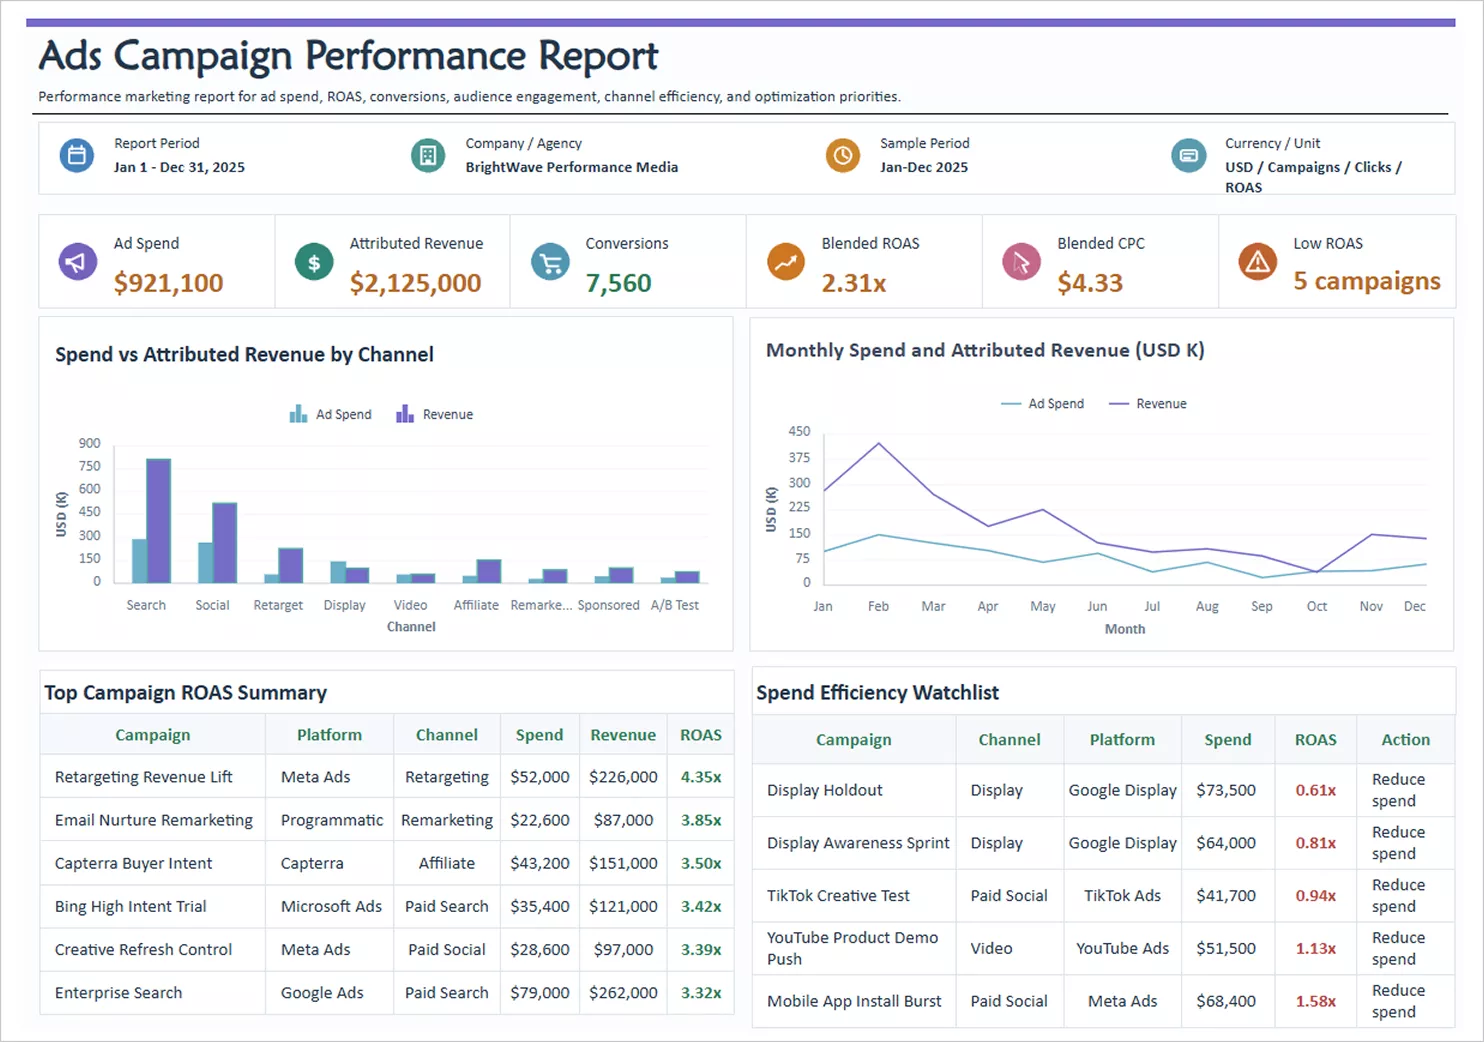
Analytical reports dig deeper to uncover trends, patterns, and drivers behind outcomes helping teams understand why performance changed.
Examples: Customer churn driver analysis, campaign performance by segment, funnel drop-off analysis, revenue trends with seasonality.
Financial reports
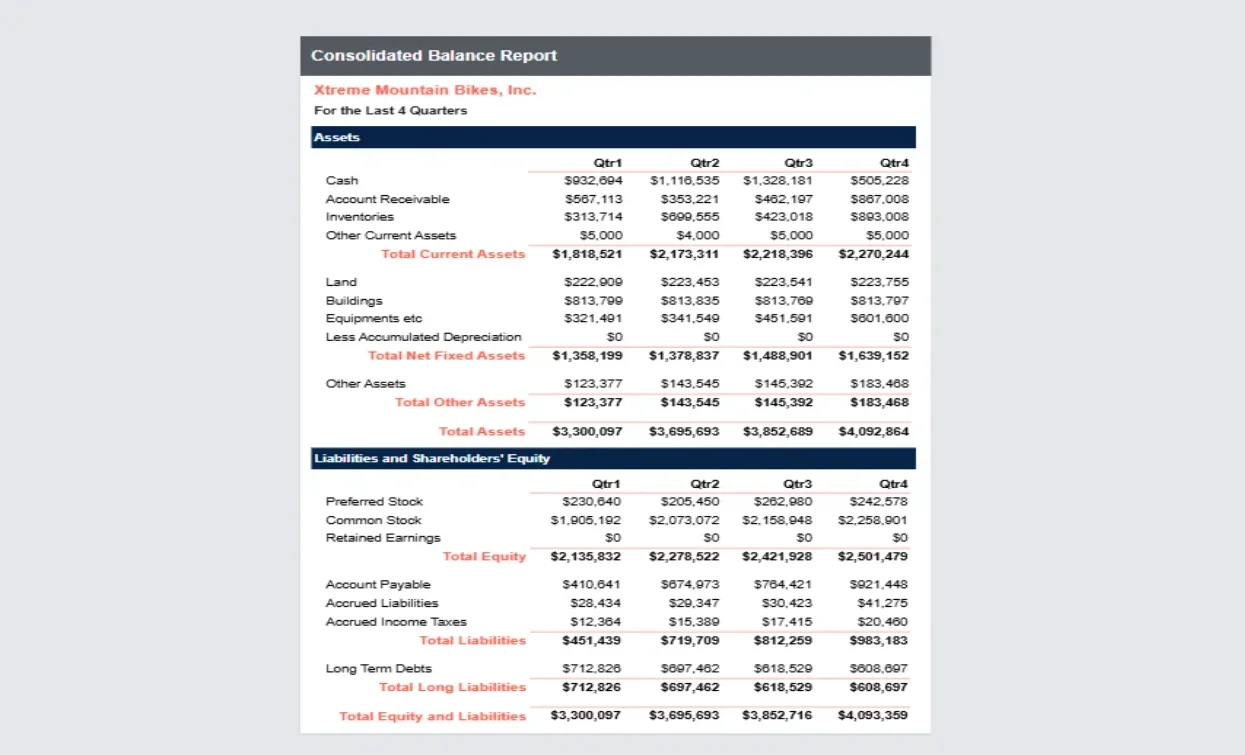
Financial reports summarize financial performance and financial position for stakeholders and decision makers. They are structured, standardized, and often tied to accounting close cycles.
Examples: Profit and loss statement, balance sheet, cash flow statement, expense summary with variance vs. budget.
Strategic reports
Strategic reports support long-term planning by combining historical performance with forecasts and high-level KPIs. They help leaders evaluate options, set priorities, and track progress against goals.
Examples: Quarterly OKR scorecard, market expansion analysis, product-line growth projections, executive KPI review.
Compliance reports
Compliance reports provide evidence that the organization meets legal, regulatory, or internal governance requirements. They should be consistent, traceable, and ready for audit.
Examples: Access and activity logs, audit trails, data retention reports, tax or statutory reporting packages, policy attestation summaries.
How to build an effective reporting system
Reliable reporting does not happen by accident. It requires a clear structure that connects business goals to consistent data, repeatable workflows, and outputs people can use without extra explanation.
A scalable reporting framework clarifies who each report is for, how metrics are calculated, and how the data reporting process flows from source systems to validated outputs. This is also where automated reporting helps most—it removes repeat manual steps so delivery stays consistent as reporting demand grows.
Follow these steps to build a reporting system that scales as your teams, data, and reporting needs grow:
- Define KPIs tied to business goals: Choose metrics that directly reflect business outcomes, so every report supports a clear decision.
- Connect the right data sources: Bring in systems like CRM, ERP, and internal databases to ensure complete, consistent inputs.
- Select the best delivery format: Use dashboards for ongoing monitoring and reports for deeper review, sharing, and documentation.
- Automate workflows and distribution: Schedule refreshes and automate delivery to reduce manual work and keep stakeholders updated.
- Monitor usage and refine over time: Track adoption and feedback, then adjust metrics, layouts, and refresh frequency to improve clarity and impact.
A structured reporting system helps teams move faster, trust the numbers, and scale reporting without adding manual effort.
Common reporting mistakes to avoid
Even with modern reporting tools, reports fall short when key practices are missed. You may reduce trust, slow decision-making, and limit adoption across teams if you have:
-
- No clearly defined audience: Reports designed for multiple stakeholder groups often end up with the wrong level of detail for everyone. Start by identifying the primary audience and the decision the report should support.
- Too many metrics: Including every available KPI creates noise and buries what matters. Prioritize a small set of key metrics and add supporting metrics only when they provide essential context.
- Inconsistent metric definitions: When teams calculate the same metric differently, reporting becomes reconciliation instead of action. Align on shared definitions and standard calculation logic across teams and tools.
- Visuals without clarity: Charts can still confuse users when labels are unclear, context is missing, or time ranges are not defined, especially for operational and compliance reporting. Use clear labels, consistent time ranges, and brief annotations where needed.
- Manual reporting processes at scale: Spreadsheets and repeated exports introduce delays and errors as reporting volume grows. Automate report generation and schedule distribution to keep reporting timely and reliable.
Effective reporting isn’t about having more data. It’s about delivering clear, consistent outputs people can understand quickly and act on with confidence.
Traditional vs. modern reporting: What’s changed?
As reporting expectations evolve, organizations shift from static reports to scalable, interactive, and embedded reporting experiences.
| Capability | Traditional reporting | Modern reporting tools |
| Report development | Slow modernization and manual effort | Faster design and iteration with web-based tools |
| Compatibility | Migration can be complex | Native RDL/RDLC support helps speed migration and reuse |
| Embedding | Limited embedding and customization | Secure embedded reporting for web and SaaS applications |
| Customer-facing reporting | Hard to support multitenant use cases | Multitenant architecture and white-label support |
| Deployment | Higher infrastructure overhead | Cloud or self-hosted deployment options |
| Distribution | Manual exports and sharing | Automated scheduling, exports, and delivery |
| Scalability | Struggles as usage grows | Designed to handle growing users and data volumes |
These challenges highlight the limitations of traditional reporting approaches and why many organizations are moving toward modern reporting solutions. Modern business reporting systems support governed, scalable delivery through automated reporting, scheduling, and secure embedded access.
What are reporting tools and why your business needs them?
Enterprise reporting tools are software solutions that help organizations create, manage, and deliver formatted reports with consistent definitions, permissions, and auditability. They power the data reporting process behind operational, financial, regulatory, and stakeholder reporting especially when reporting must scale across teams and customer-facing apps.
They help you:
-
- Create standardized reports faster: Use templates, reusable layouts, and shared report components.
- Connect to multiple data sources: Pull the latest data into the same report format every time.
- Automate report generation and delivery: Schedule runs, burst reports to recipients, and distribute by role or department.
- Maintain consistency and governance: Centralize version control, approvals, and permissions for report definitions.
- Support print-ready and exportable outputs: Produce PDF, Excel, and Word files for audits, compliance, and client reporting.
- Reduce manual effort and errors: Replace copy-paste reporting with repeatable, validated workflows.
Must-have features in a modern reporting tool
A modern reporting tool should help you create accurate reports quickly, keep them consistent over time, and deliver them securely to the right people. Look for:
-
- Data connections: Connect to databases, files, APIs, and business systems, so reports use current, trusted data.
- A report designer with templates and pixel-perfect layout: Build reusable report templates and maintain precise formatting for invoices, statements, and compliance documents.
- Parameters and filtering: Generate the right version of a report by selecting inputs like date range, region, or customer.
- Embedding and integration: Publish reports inside your application, portal, or intranet, so users access them in their workflow.
- Scheduling and distribution: Automate report generation and deliver outputs through email, shared locations, or in app delivery in formats like PDF and Excel.
- Security, governance, and scalability: Enforce role-based access and auditing while maintaining reliable performance as users and data grow.
How Bold Reports® powers scalable, modern reporting
Modern reporting requires more than static outputs. Teams need a reliable way to design formatted reports, connect to data, manage access, automate delivery, and scale reporting inside the business or inside customer facing applications.
Bold Reports is built to help organizations design, manage, and deliver reporting across operational, analytical, and enterprise use cases.
With Bold Reports, organizations can:
-
- Create pixel-perfect reports: Design highly formatted, paginated reports with precise layout control for financial, operational, and compliance needs.
- Use a web-based report designer: Use the built-in report designer to create, edit, and manage reports easily within a web environment.
- Connect multiple data sources: Integrate data from databases, APIs, and cloud applications to support consistent reporting
- Enable embedded reporting: Embed reports directly into web and SaaS applications, so users can access reports within existing workflows.
- Automate report scheduling and delivery: Schedule reports and automate distribution to reduce manual work and improve timeliness.
Final thoughts
Understanding reporting is essential for any organization looking to turn data into meaningful outcomes. From different report types to the benefits they deliver and the tools that power them, reporting plays a central role in helping businesses monitor performance, uncover insights, and make informed decisions.
As business needs evolve, relying on static or manual reporting is no longer enough. Organizations need modern reporting tools that can support multiple report types, deliver real-time insights, and scale with growing data demands. This is where solutions like Bold Reports come in, bringing together design flexibility, data integration, and automation to simplify the entire reporting process.
By aligning the right reporting approach with the right tools, businesses can unlock greater efficiency, improve visibility, and make smarter decisions with confidence. If you’re looking to apply these capabilities in your own environment, exploring Bold Reports through a 30-day free trial or requesting a personalized demo can help you take the next step toward building a more effective and scalable reporting strategy.
Frequently asked questions
- 1.
What is reporting and how is it used in businesses?
Reporting is the process of turning raw data into structured insights through reports and dashboards, which businesses use to monitor performance, identify trends, and make data-driven decisions.
- 2.
What are the different types of reporting?
Common types include operational, analytical, financial, strategic, and compliance reporting.
- 3.
What are the key benefits of reporting?
Reporting improves decision-making, increases visibility into performance, enhances KPI tracking, and supports efficiency through consistent insights.
- 4.
What are reporting tools and why are they important?
Reporting tools simplify data connections, report creation, visualization, automation, and sharing helping organizations scale reporting reliably.
- 5.
What features should a modern reporting tool include?
Look for data integration, interactive dashboards, pixel-perfect reports, embedded reporting, automation and scheduling, security and governance, and scalability.
- 6.
How does Bold Reports support modern reporting needs?
Bold Reports supports pixel-perfect report design, web-based report creation, data connectivity, embedded reporting, and automated scheduling and delivery.






