
Turn PowerPoint Slides to RDL Reports: A Complete Guide

TL;DR:
Hours are lost every week updating static reports work that could easily be automated. If you rely on PowerPoint for recurring reporting, you’re likely dealing with version chaos, outdated data, and constant rework. By converting PowerPoint slides into paginated RDL reports, you can move to a centralized, governed, and data-driven approach with consistent, repeatable outputs. The free Bold Reports® PowerPoint-to-RDL converter helps you turn PPTX layouts into editable, SSRS-ready reports in minutes. You keep the design your stakeholders trust, connect live data, add parameters, and publish without rebuilding everything from scratch.
Introduction
PowerPoint is a widely used tool for sharing business updates, KPI snapshots, and executive reports. It is familiar, flexible, and effective for presenting insights, but it falls short for recurring reporting. Teams often spend hours updating data, managing multiple versions, and tracking the latest files across emails and shared folders. This leads to outdated information, version confusion, and repeated manual effort.
To overcome these challenges, many teams are choosing to convert PowerPoint slides to RDL reports. Unlike static presentations, paginated RDL reports are consistent and centrally managed for reliable reporting.
With Bold Reports, you can convert PowerPoint files to RDL reports quickly without rebuilding layouts. This lets you keep trusted slide designs while enabling live data, SSRS-ready reporting, and scalable, automated delivery.
Who is this guide for
This workflow supports different roles involved in reporting and analytics. It allows teams to collaborate using a common starting point. It is especially useful for:
-
- Developers who want to focus on datasets and report logic.
- Designers who prefer working in PowerPoint instead of report designers.
- Data analysts who need reusable report templates.
- BI teams working to standardize reporting formats.
- Stakeholders reviewing report layouts before development.
Using PowerPoint as a starting point reduces rework and speeds up delivery across teams.
Challenges of using PowerPoint-based reporting
Before exploring better alternatives, it’s important to understand why relying on PowerPoint for recurring reporting creates challenges. Here are some common issues:
-
- Endless manual updates: Recurring reports like weekly updates and monthly scorecards require constant copy and paste work. This slows down reporting cycles and reduces time available for analysis.
- Limited interactivity: PowerPoint slides are static. Users cannot filter, drill down, or explore data beyond what is shown, which limits deeper insights.
- High risk of errors: Manual updates increase the chances of incorrect values or inconsistencies across reports, which can affect decision making.
- No automation or scheduling: PowerPoint does not support automatic data refresh, scheduled delivery, or direct connections to live data sources, making reporting repetitive and time consuming.
- Difficult to scale: As reporting needs grow, managing multiple versions of presentations becomes harder, leading to inconsistency and reduced efficiency.
Bold Reports helps address these challenges by allowing you to convert PowerPoint slides into RDL reports, enabling structured reporting with consistent and reliable delivery.
What is RDL and why convert from PowerPoint
RDL, report definition language, is an XML-based format used for paginated reports in tools like SSRS and Power BI Paginated Reports. It defines both the report layout and the data logic behind it, including data sources, queries, parameters, filters, and calculations, in a single structured file.
PowerPoint is great for presentation-first storytelling, but it is fundamentally static. Converting PowerPoint style reports into RDL moves you from manually updating slides to producing consistent, data driven reports that can refresh and scale.
Why convert from PowerPoint to RDL?
Paginated RDL reports are built for repeatable, structured reporting, especially when accuracy and consistency matter. Compared to PowerPoint, they give you:
-
- Automatic data refresh: Connect to your source systems once, then refresh on a schedule or on demand with no more manual copy and paste updates.
- Centralized logic and consistency: Queries, parameters, filters, and calculations live in the report definition, so every run follows the same rules.
- Reusable templates: Keep the same report layout each cycle while the data updates underneath, reducing the need to rework and keeping outputs standardized.
- Governed distribution: Support controlled access, reliable exports such as PDF and Excel, and automated delivery, without manually emailing slide decks around.
- Pixel-perfect output: Ideal for operational, financial, and regulatory reporting where formatting needs to be predictable and consistent.
If your team is rebuilding PowerPoint decks every reporting cycle, RDL helps preserve the familiar layout while making the report automated, data connected, and far less error prone.
Key benefits of converting to RDL
Converting reports or presentations into RDL offers a range of practical advantages, especially for organizations looking to modernize their reporting workflows and move toward data-driven operations.
1. Automated, real-time reporting
RDL reports are connected to live data sources, enabling automatic updates without manual intervention. This eliminates the need for repeatedly editing static files and ensures stakeholders always see the most current information.
2. Improved data accuracy and consistency
Manual reporting workflows, especially in tools like PowerPoint, can introduce inconsistencies or errors. RDL standardizes report definitions, ensuring consistent calculations, formats, and layouts across all outputs.
3. Interactivity and user engagement
Unlike traditional presentation formats, RDL reports allow users to interact with data. Features like drill-down and drill-through capabilities, sorting, filtering, and parameterized views empower users to explore insights on their own.
4. Centralized management and distribution
RDL reports can be hosted on report servers or embedded into applications. This makes distribution easier and ensures users access the same updated report instead of multiple versions.
5. Scheduling and subscription capabilities
Reports can be scheduled to run and distributed automatically via email or other channels. This ensures stakeholders receive timely updates without needing to manually generate reports.
By converting to RDL, businesses move beyond static reporting and gain a dynamic, scalable, and interactive reporting framework.
PowerPoint vs. RDL reporting
PowerPoint works well for presenting information, but it becomes difficult to manage when reports require frequent updates, standardized output, and governance.
| Aspect | PowerPoint reporting | RDL reporting |
| Data freshness | Manual updates | Live source connections |
| Version control | Multiple file copies | Centralized reports with controlled publishing |
| Delivery | Manual email | Publish once, export consistently, and automate delivery where needed |
| Interactivity | Static | Parameters, drill-through, and conditional formatting options |
| Scalability | Limited | Built for teams and enterprise reporting |
As reporting needs grow, these differences become more visible. RDL reduces duplication, improves consistency, and supports repeatable reporting without rebuilding slides.
How the PPT-to-RDL converter works
The Bold Reports PowerPoint-to-RDL converter is a web-based tool with no installation required. All you need to do is:
-
- Upload your PowerPoint file.
- Watch as the tool maps slide elements into RDL report items.
- Download the generated RDL file.
- Open it in the Bold Reports Report Designer to bind data and finalize the report.
Because it converts elements and not just a flattened image, you can continue editing the layout in the designer.
Element mapping: What gets converted
The converter translates many slide elements into editable report items so you can complete the report inside Bold Reports.
Here is what gets converted:
-
- Text elements: PowerPoint textboxes become RDL text fields. Font styling, size, and alignment are typically preserved.
- Images and visuals: Logos and icons are retained with positioning. Use high-resolution sources for best results.
- Layout structure: Element placement is preserved to keep your design grid.
- Charts and graphics: Charts typically convert as visual shapes with their appearance preserved. For live, data-driven charts, rebuild them in the Report Designer using your datasets.
This approach keeps the output flexible, so you can update content, reuse templates, and extend reports as requirements evolve.
Best practices for preparing PowerPoint slides for conversion
To improve conversion accuracy and reduce post-editing effort, prepare your PowerPoint slides with these best practices:
-
- Use clean, grid-aligned layouts: Structure slides with proper alignment and spacing to ensure elements are accurately mapped during conversion.
- Avoid overlapping elements: Keep text and visuals separate to prevent layout distortions in the RDL output.
- Maintain consistent fonts and spacing: Standardize typography and spacing across slides for uniform, predictable results.
- Use simple, standard elements: Prefer clear textboxes over complex grouped objects to improve conversion reliability.
- Use high-resolution visuals: Ensure logos and icons are clear and not pixelated in the final report.
- Leave adequate padding: Add spacing around text and visuals to reduce wrapping and alignment issues after conversion.
After conversion, review the report in the designer to fine-tune alignment, text wrapping, and page breaks before publishing.
Now, let’s walk through the steps to convert PowerPoint to RDL reports.
Step-by-step: How to convert PowerPoint files to RDL reports
Follow these steps to convert PowerPoint files into structured RDL reports while preserving layout integrity. These steps are especially useful if you need to convert PowerPoint to an SSRS report while preserving existing slide layouts and reducing rebuilding time.
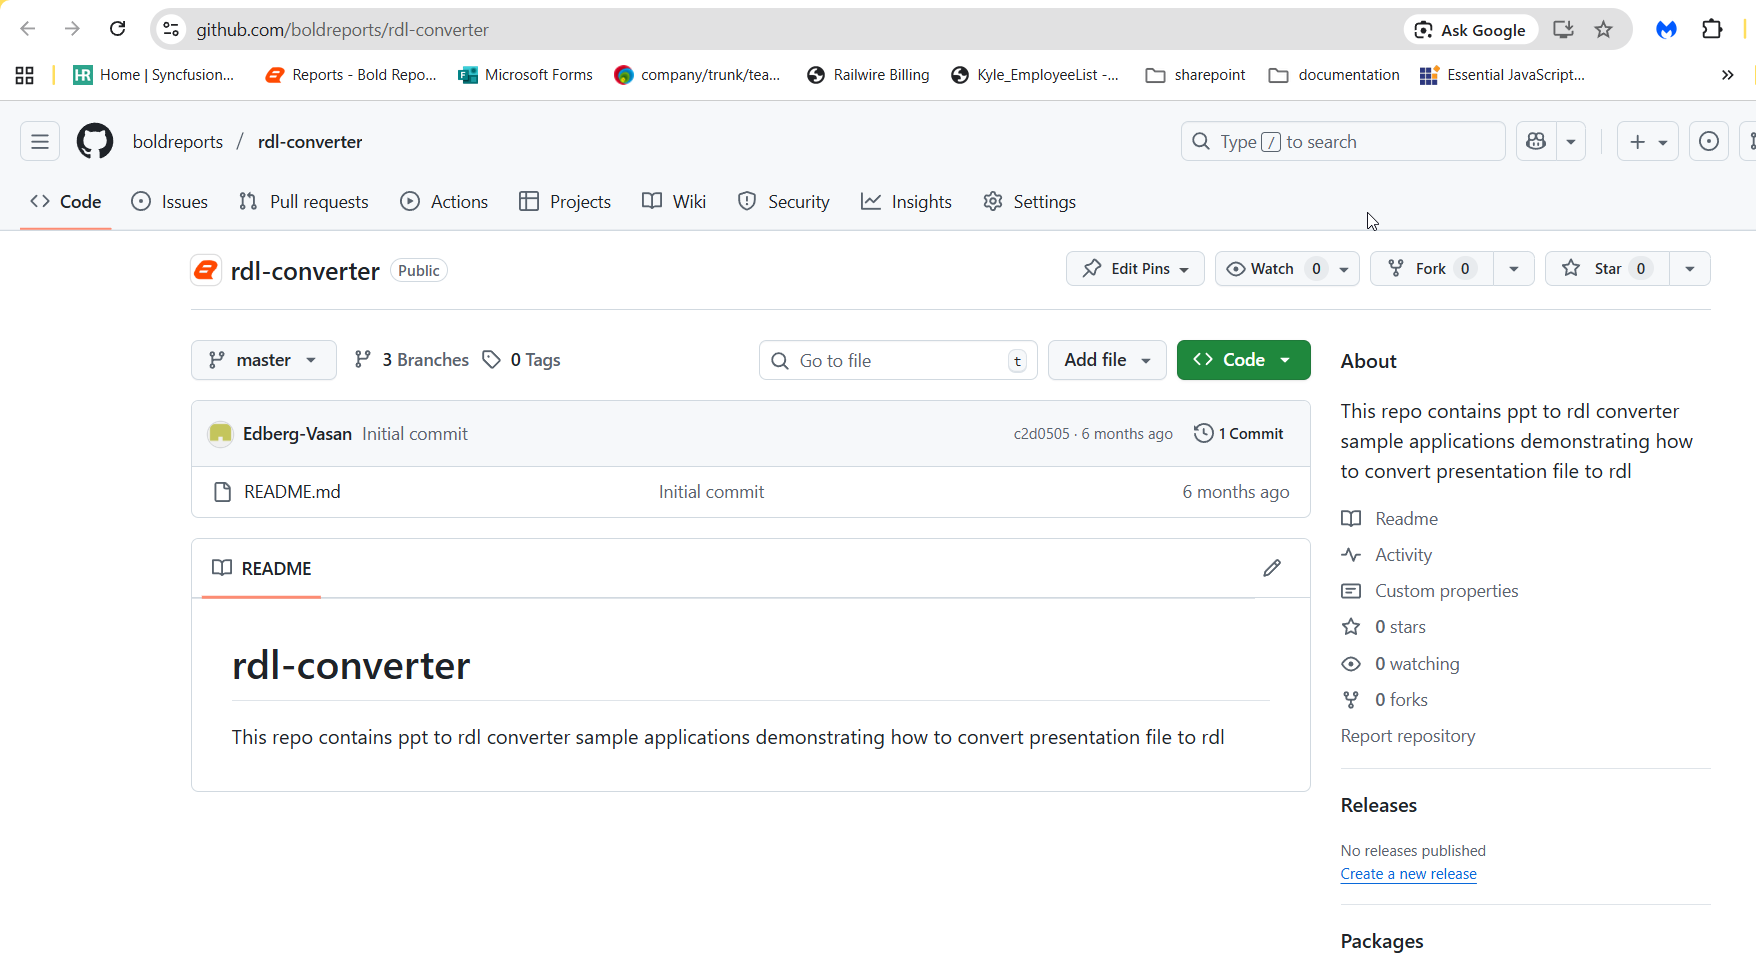
Step 1: Access the GitHub repository.
Navigate to Bold Reports RDL Converter repository on GitHub. This repository contains the source code and documentation required to set up and use the converter.
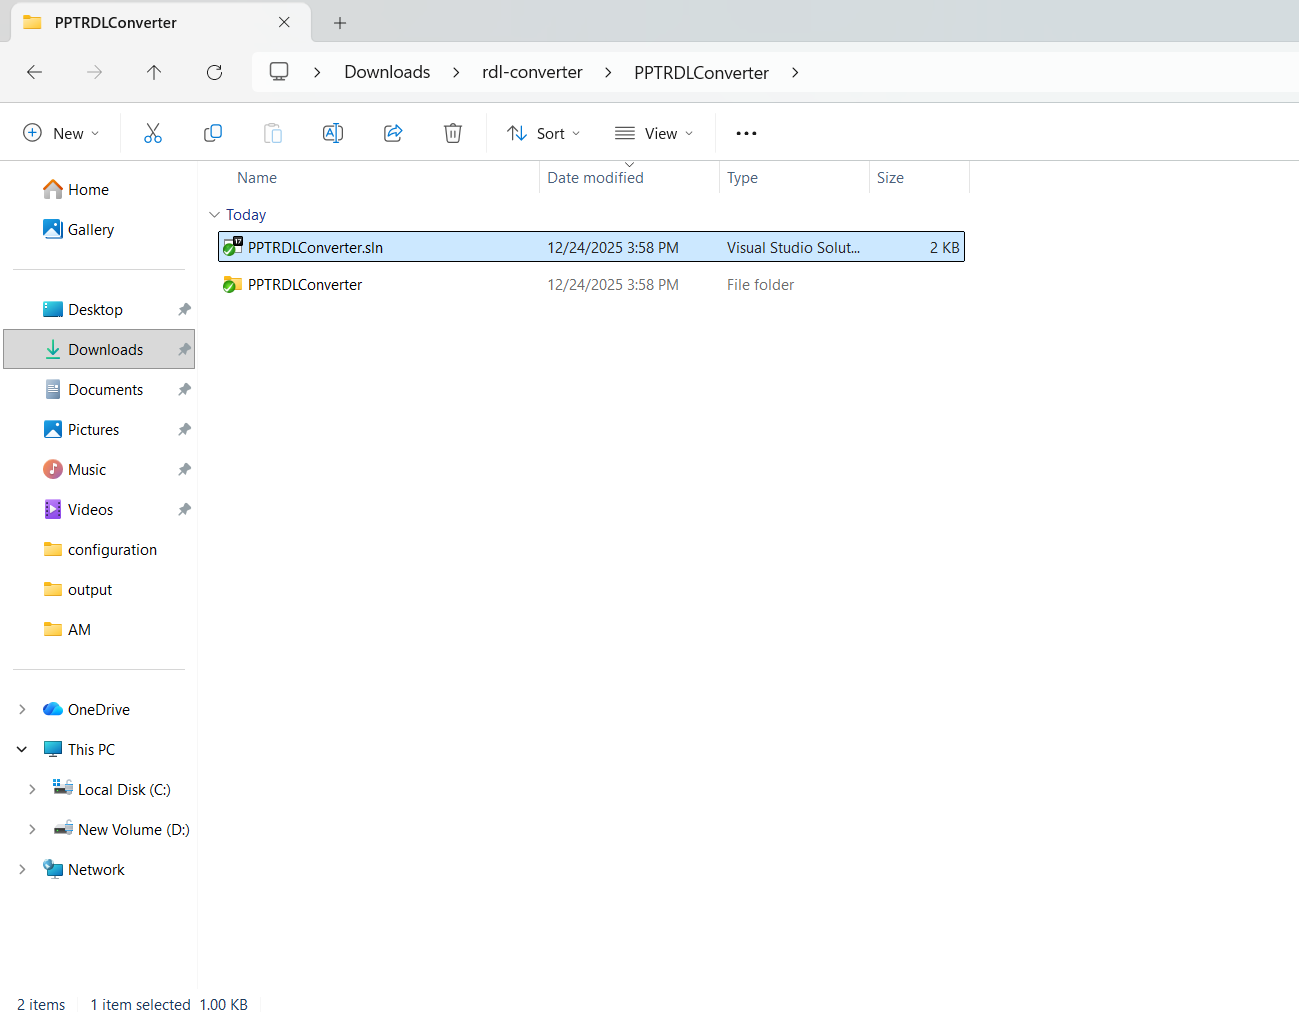
Step 2: Clone the repository.
Open your terminal or use Visual Studio’s integrated terminal. Run the following command to clone the repository to your local machine: git clone https://github.com/boldreports/rdl-converter/tree/development. This will create a local copy of the project folder. After cloning, navigate to the project folder. Locate the .sln file and open it in Visual Studio. This file loads all the necessary projects and configurations.
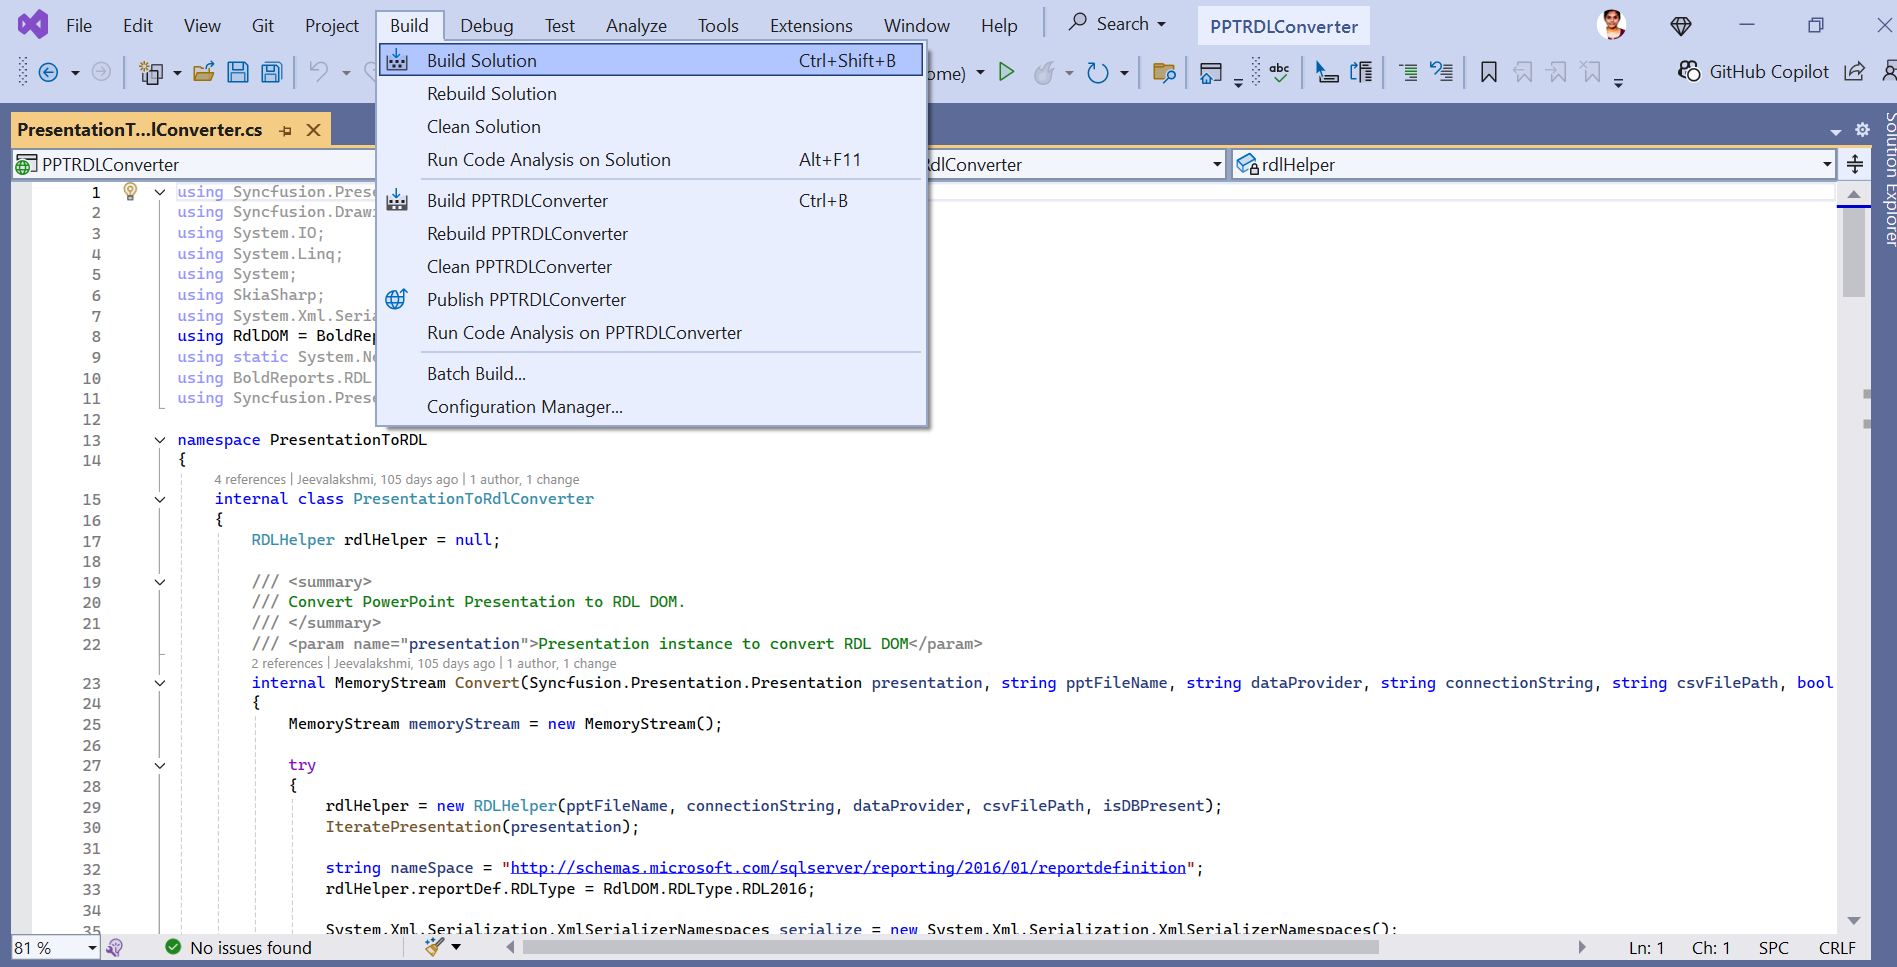
Step 3: Build the solution.
To compile the project to check for errors and prepare it for execution, select Build > Build Solution or press Ctrl + Shift + B.
A successful build means the application is ready to run.
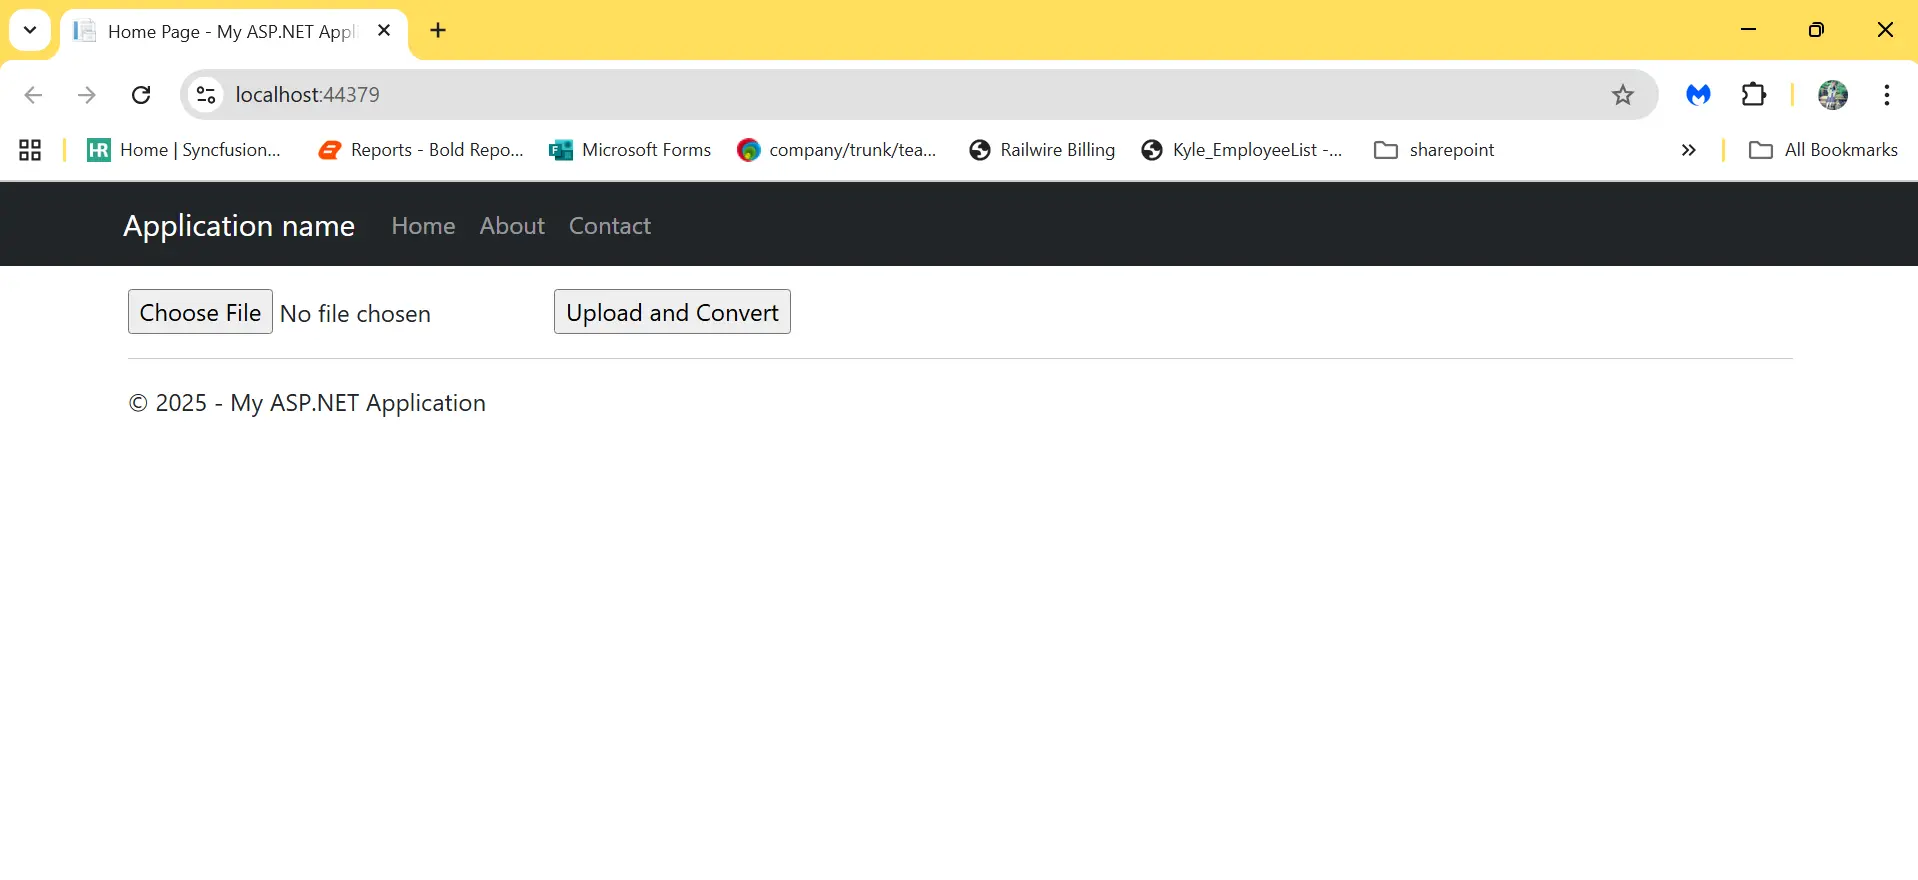
Step 4: Run the application without assuming a project name.
Instead of assuming a startup project name, which can change, set the startup project using a reliable rule. Set a startup for the project that contains the application entry point, commonly Program.cs, or the host startup for UI/API.
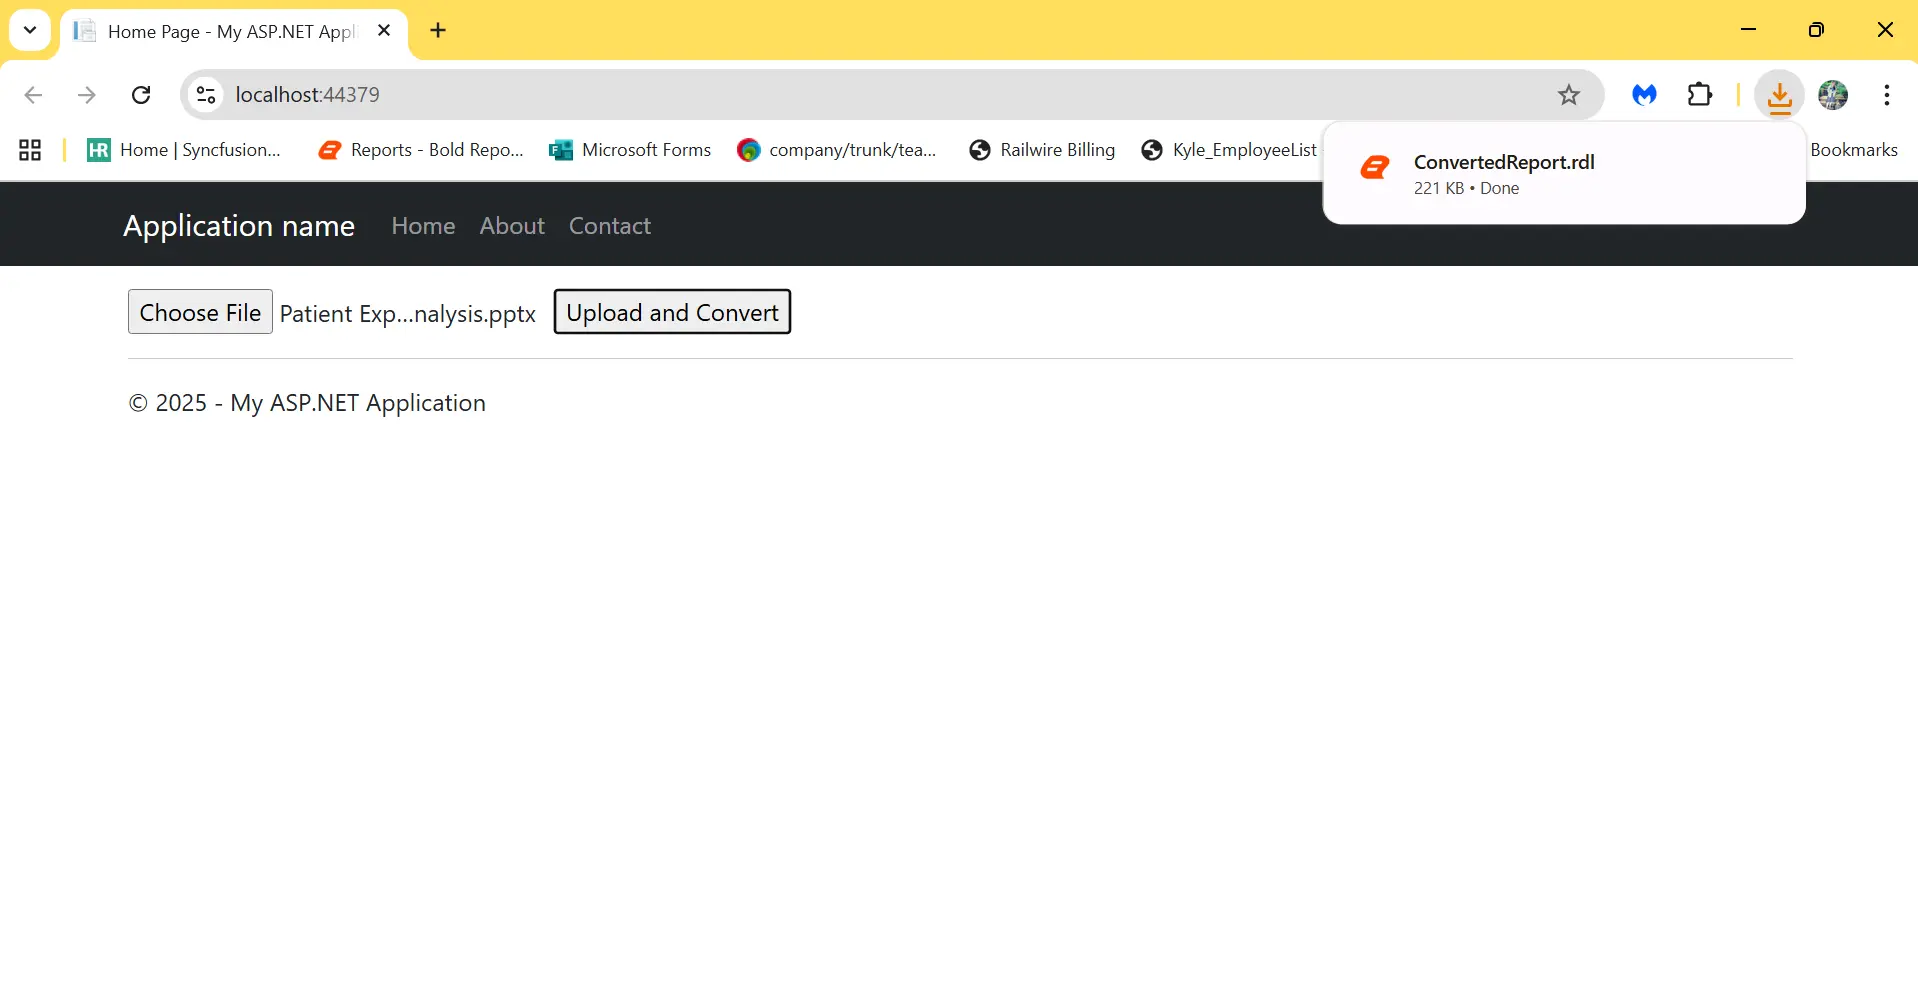
Then run the application by pressing F5 or selecting Start. The converter should run as UI, or service/API, depending on the repository. If everything is configured correctly, the application will render successfully as shown in the image below.
Step 5: Convert PPT to RDL.
Using the provided UI or API, convert the PPT to an RDL report by:
- Uploading your .pptx file.
- Selecting Convert.
The tool will process the PowerPoint file and generate an RDL file.
Step 6: Verify the output.
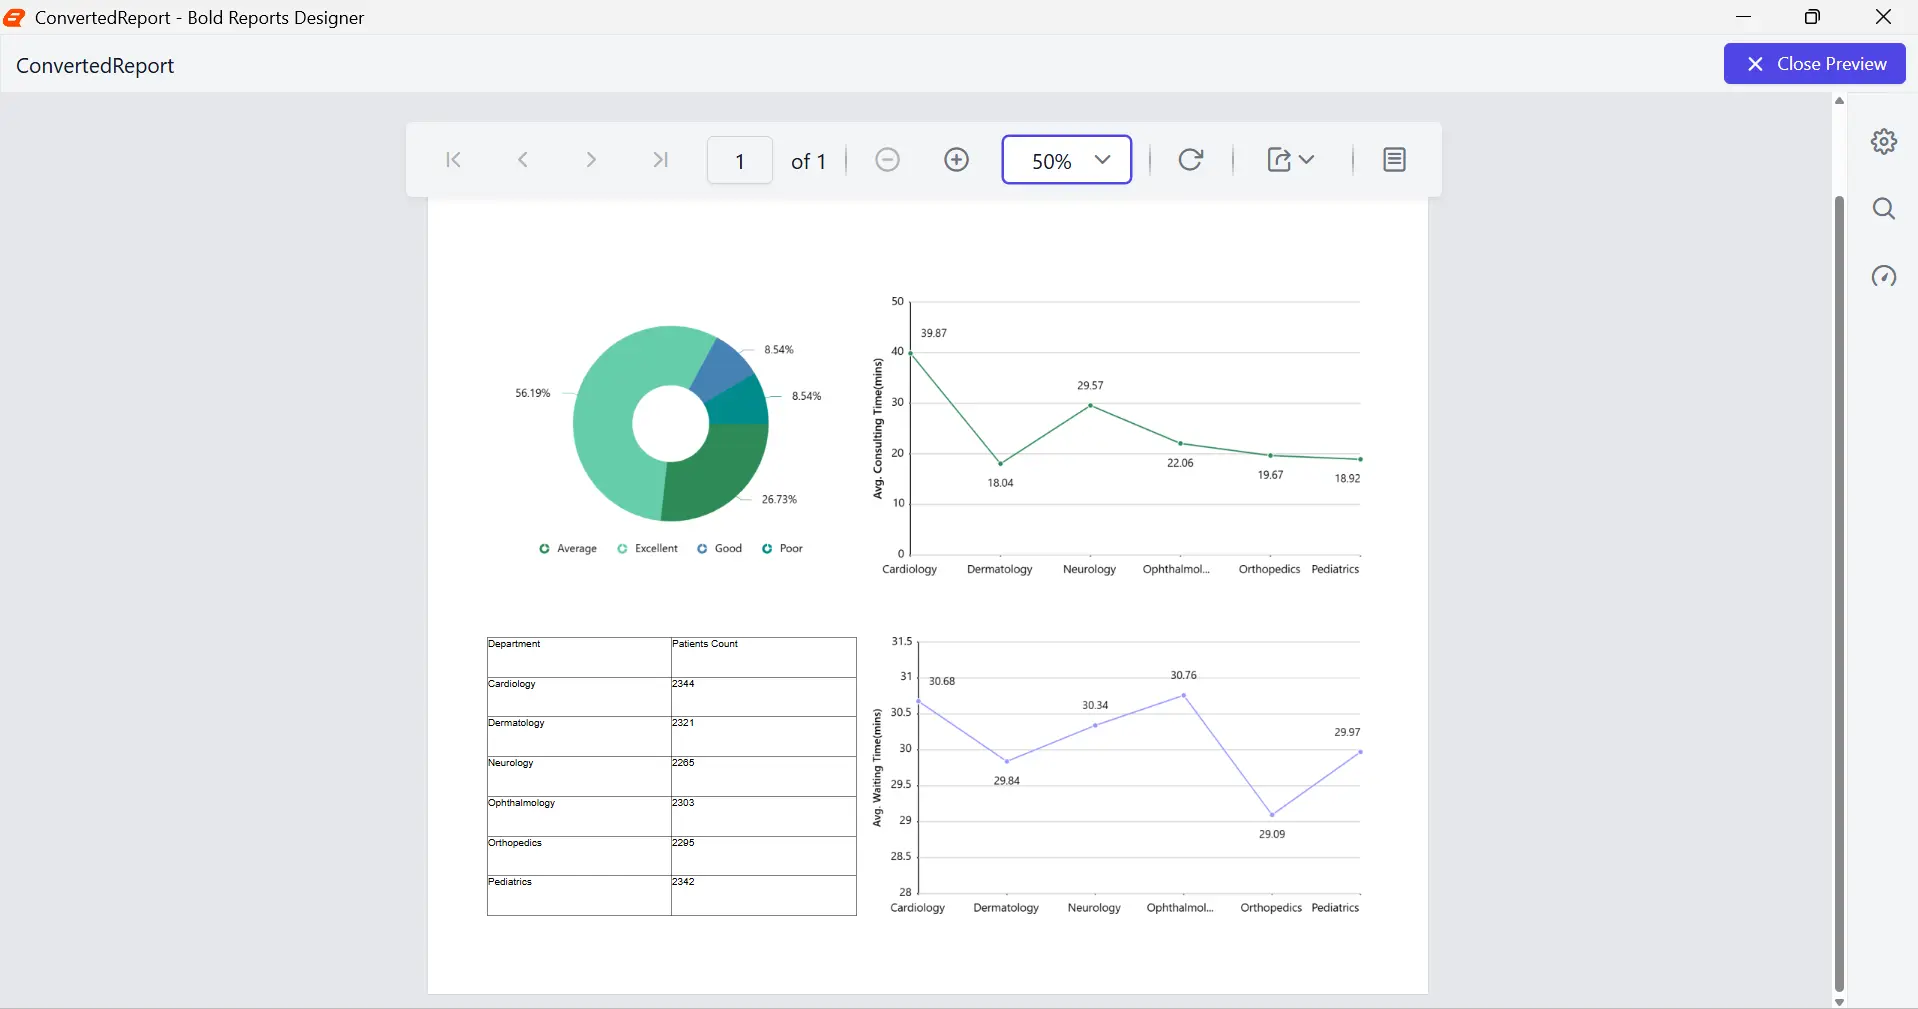
Locate the generated .rdl file in the designated output folder. To refine your report further, open the converted RDL file in Bold Reports, where you can view, edit, and save it. For detailed steps, refer to the Bold Reports documentation. Once the conversion is complete, the finalized report will appear as shown in the sample below. Open the report in the Bold Reports Report Designer to fine-tune the layout, add parameters, and connect live data sources.
This sample report demonstrates how charts, metrics, visual elements, and layout structure from the PowerPoint file are preserved in the converted RDL report, ensuring a seamless transition into your reporting workflow.
The following GIF gives a complete overview on how to convert PowerPoint files to RDL reports.
Post conversion checklist for RDL reports
Before you treat the output as production-ready, validate the essentials:
-
- Confirm margins, overall spacing, and page size, whether that’s A4, letter, or a custom size.
- Check alignment for key sections like titles, headers, footers, and table columns.
- Verify text wrapping and truncation and confirm that fonts render as expected with fallbacks if needed.
- Review images for stretching and blurriness and check shapes and lines for layering issues.
- If complex elements like SmartArt or heavily grouped visuals look off, rebuild them using report-native elements.
- If you’re turning slides into live reports, bind datasets and parameters, and confirm filters work correctly.
- Test PDF and Excel exports to ensure layout consistency across formats.
- Preview with realistic data volume to catch performance or rendering issues early.
This review ensures the report is ready for stakeholder use and operational distribution.
Final thoughts
Converting PowerPoint-based reporting into RDL helps you move from manual, slide-driven workflows to scalable, data-driven reporting that can support growing business demands.
As reporting requirements evolve, relying on static presentations introduces inefficiencies that slow updates down, create inconsistencies, and limit how effectively insights can be delivered and reused. This makes it increasingly important to adopt structured, reusable reporting approaches that combine familiar design flexibility with automation and accuracy.
The PPT-to-RDL converter from Bold Reports helps bridge this gap by transforming existing slide layouts into structured, editable RDL reports. Teams can continue using the designs they are familiar with while transitioning to dynamic, connected reporting workflows without the need to rebuild everything from scratch.
For organizations looking to modernize reporting, starting with existing PowerPoint decks is a practical first step. Try the converter with your own files and explore Bold Reports further with a free 30-day trial. Or, request a personalized demo to experience how scheduling, collaboration, and integrations can help you build a more efficient, production-ready reporting environment.
Frequently asked questions
- 1.
Is the PPT-to-RDL converter free to use?
Yes. Bold Reports offers it as a free online tool. Limits like file size or daily conversions may apply.
- 2.
Will my slide layout stay the same after conversion?
Mostly, yes. Text, images, and placement are preserved so you do not have to rebuild the layout from scratch.
- 3.
Can I connect the converted RDL to data sources?
Yes. Open the RDL in the Bold Reports Report Designer to set up data sources, datasets, and parameters.
- 4.
Do charts convert as editable, data driven charts?
Usually they keep their visual look. If you need live data charts, you may need to rebuild or bind them in the designer.
- 5.
How well does it handle complex slides?
Simple slides convert well. Complex layouts may need small fixes such as alignment or text wrapping.
- 6.
What should I check before publishing?
Review pagination, alignment, and text wrapping. Preview as HTML or PDF to confirm the layout.
- 7.
Is my PowerPoint stored after conversion?
It is typically processed for conversion and not kept. Check the converter page for the latest policy.






