
Bold Reports 2025 Year-End Review: Key Reporting Highlights

TL; DR: The Bold Reports® 2025 year-end review showcases how we addressed common reporting challenges such as slow performance, limited design flexibility, and complex data integration. This year brought major framework upgrades, smarter design tools, expanded real-time data connectivity, and enhanced monitoring capabilities. In this recap, you’ll find key reporting features introduced in 2025, real customer success stories, industry recognition, and a glimpse of what Bold Reports is building for 2026.
Introduction
Reporting teams have long faced familiar obstacles: reports that struggle to scale, design tools that slow productivity, and data sources that refuse to connect in real time. These challenges don’t just create inefficiencies; they hold businesses back from unlocking the insights needed to make confident, data-driven decisions.
In 2025, Bold Reports set out to change that. Through major performance enhancements, smarter design capabilities, and expanded data connectivity, we’ve redefined that reporting can be—faster, simpler, and more adaptable, without forcing teams to abandon their existing workflows.
The Bold Reports 2025 year-end review takes you inside this transformation. Discover how these innovations empowered reporting teams worldwide, explore real success stories, and get a glimpse of the breakthroughs shaping the future of reporting in 2026 and beyond.
Now, let’s dive into the key reporting features Bold Reports introduced in 2025.
Bold Reports Key Reporting Features You Shouldn’t Miss
The following highlights show how Bold Reports evolved in 2025 to help BI developers and report designers build faster, more flexible, and more reliable reporting solutions.
1. Performance improvements that scale across environments
Modern reporting needs to move fast, without breaking compatibility with legacy systems. In 2025, Bold Reports strengthened its core platform to support both modernization and stability, helping teams upgrade with confidence.
These Bold Reports performance and design upgrades include support for .NET 8.0, .NET 9.0, and .NET Framework 4.6.2, delivering faster execution, improved security, and optimized runtime performance across modern and legacy environments.
What this means for teams:
-
- Reports run faster and more reliably at scale.
- Developers can adopt newer .NET frameworks without disruption.
- Enterprises gain long-term stability for large reporting workloads.
2. Smarter report design with greater precision and control
Report designers need precision without complexity. To address this, Bold Reports introduced tools that reduce layout guesswork and improve visual consistency across reports.
Key updates:
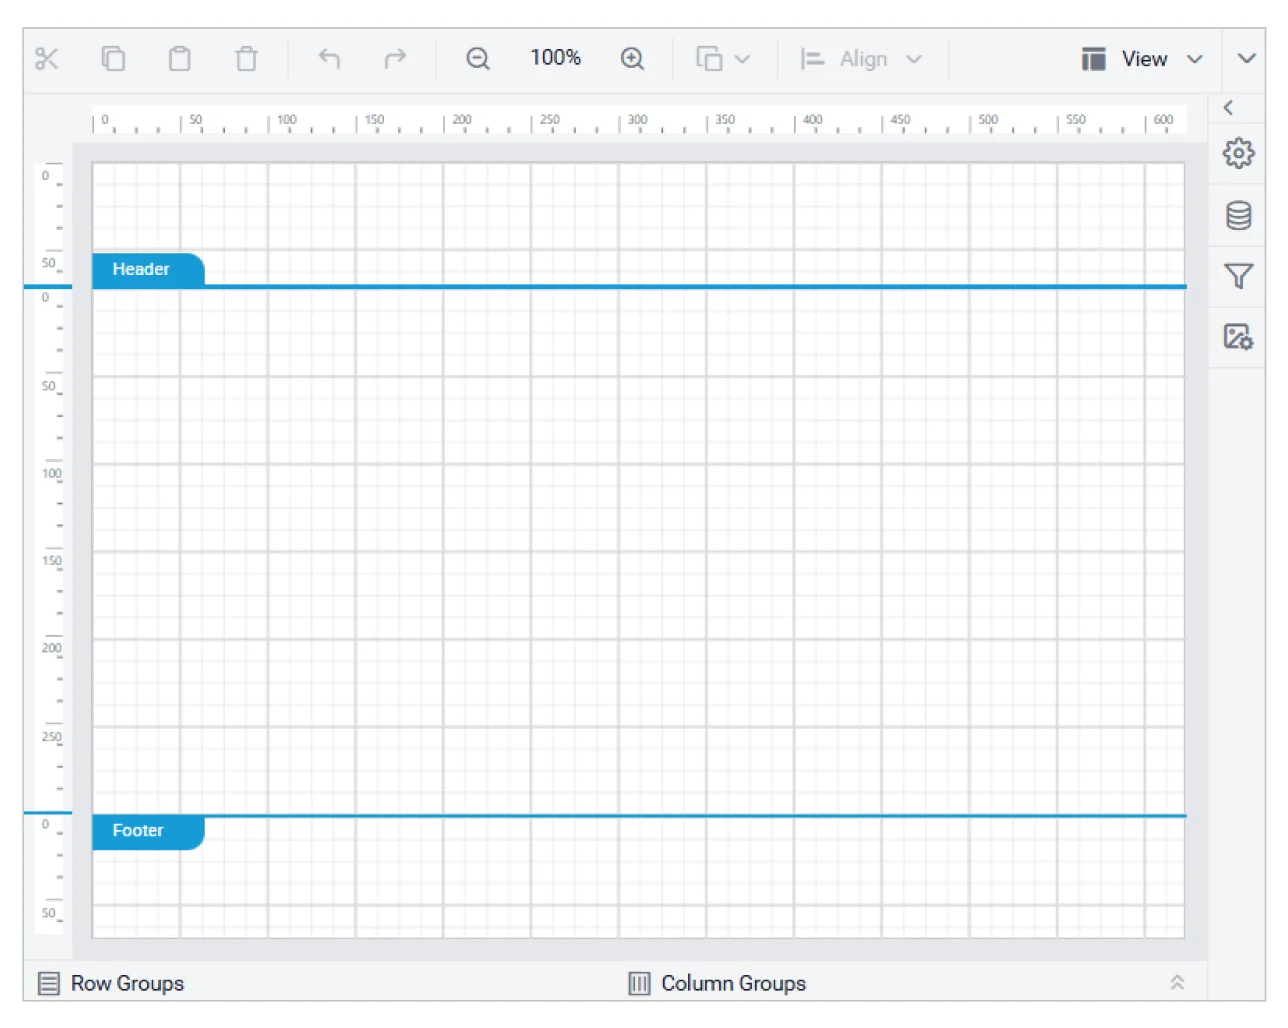
- Ruler for precise report design: Ensures accurate placement of report items for both on-screen and print layouts. This feature provides visual guidance to maintain a clean, organized structure, making it easier to export reports with consistent spacing and alignment.
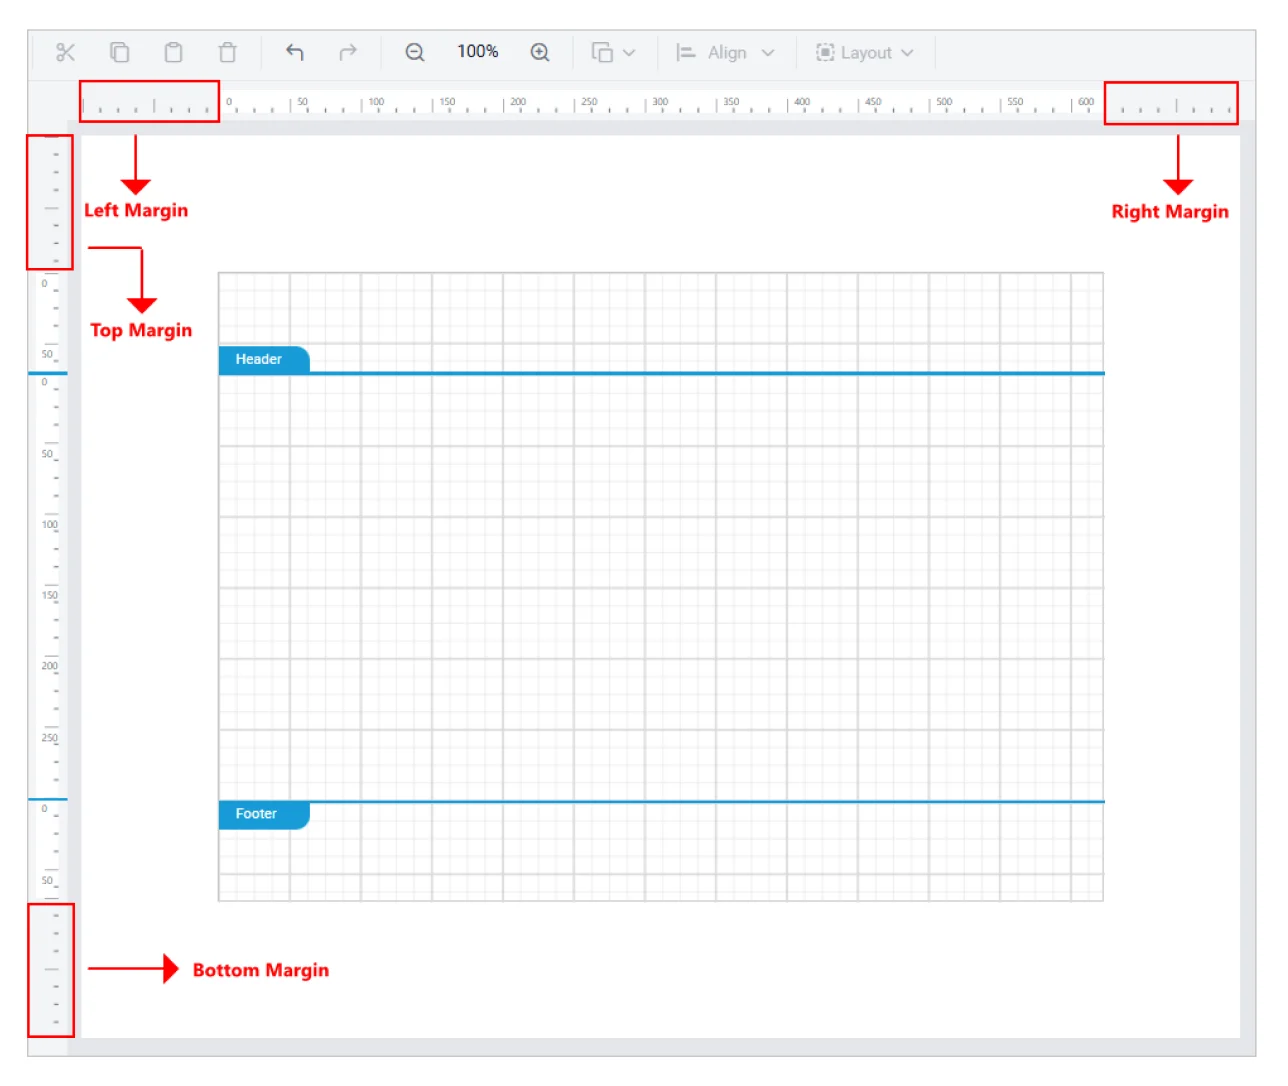
Ruler for Report Design - Visual page margin indicator: Offers a clear view of margin areas, enabling report designers to manage layout and report properties effectively during the design process.
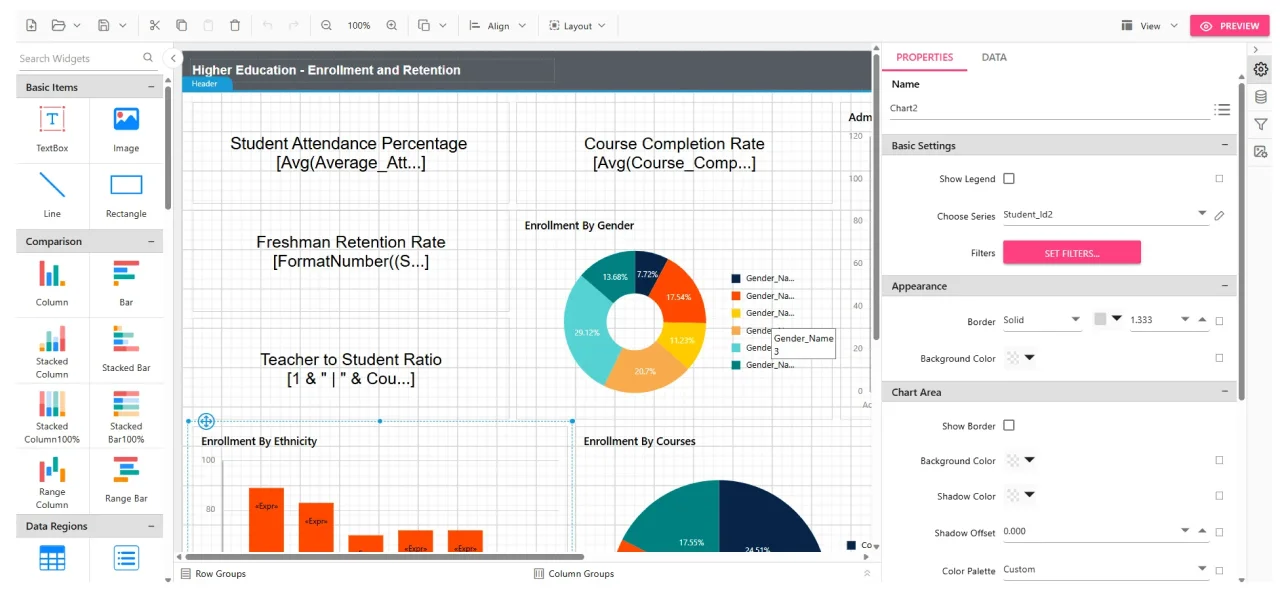
Page Margin Indicator - Material theme support: Introduces modern light and dark themes, improving usability and accessibility for a more intuitive design experience.
Material Theme Support
Together, these Bold Reports performance and design upgrades reduce layout errors, accelerate design speed, and deliver professional, print-ready reports with ease.
3. Expanded data connectivity for real-time reporting
Data integration should never slow reporting down. In 2025, Bold Reports expanded its connector ecosystem to support more real-time and on-demand reporting scenarios.
New additions include a MongoDB data connector for direct access to collections, along with on-demand connectors for SQLite, Asana, MariaDB, and Google BigQuery, allowing teams to pull data dynamically without complex pipelines. Also, with the introduction of MinIO destination support, teams can now directly export and store data in MinIO, expanding their options for cloud-native, S3-compatible storage within the Bold Data Hub.
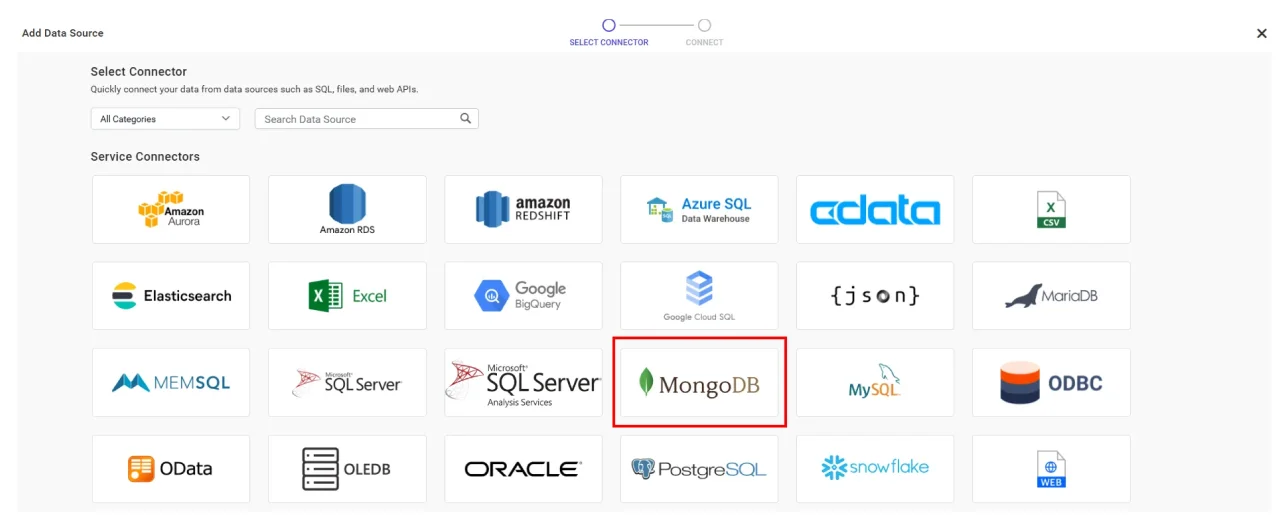
These enhancements enable:
-
- Seamless access to structured and unstructured data.
- Faster insights without added infrastructure.
- Greater flexibility across diverse data environments.
4. Rich, interactive reporting experiences
Reports shouldn’t just present data; they should tell a complete story. In 2025, Bold Reports added new capabilities to make reports more interactive and information rich.
- Custom HTML report items: Enables report designers to embed live web pages or HTML content directly into reports, creating dynamic and contextual experiences.
HTML Report Item - Custom PDF report items: Allows full pdfs to be embedded within reports, delivering consolidated, all-in-one reporting experiences for stakeholders.
PDF Report Item
These updates make reports more engaging, contextual, and easier to consume by transforming static data into interactive insights.
5. Create visually engaging reports with shape elements
Reports often lacked visual emphasis, making it hard to highlight key insights. To address this, shape elements was introduced in the Report Viewer, allowing circles, rectangles, and other shapes to be added directly into reports for better storytelling and clarity.
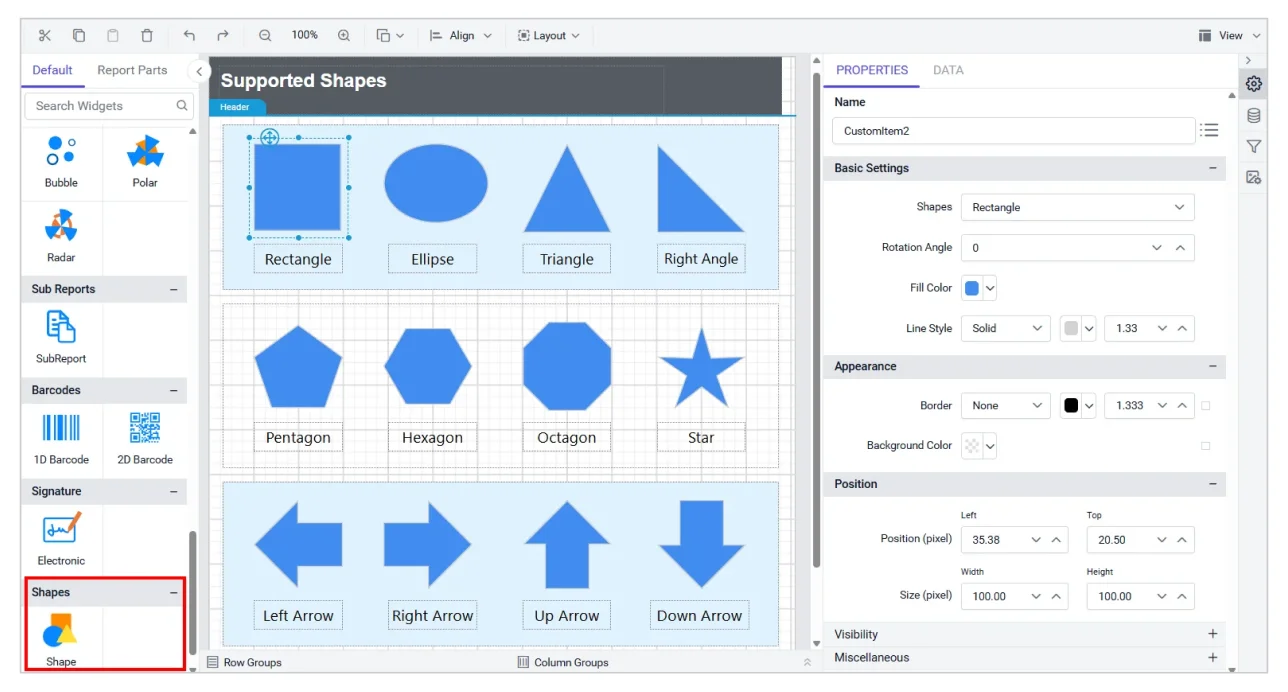
What this means for teams:
-
- Highlight critical data visually without external tools.
- Create professional, engaging report layouts.
- Improve communication of insights through design.
6. Navigate large reports effortlessly
Scrolling through lengthy reports is time-consuming and inefficient. To address this, the table of contents (TOC) item enhancement was added to the table of contents rendering, allowing report designers to jump to specific sections instantly, improving readability and saving valuable time.
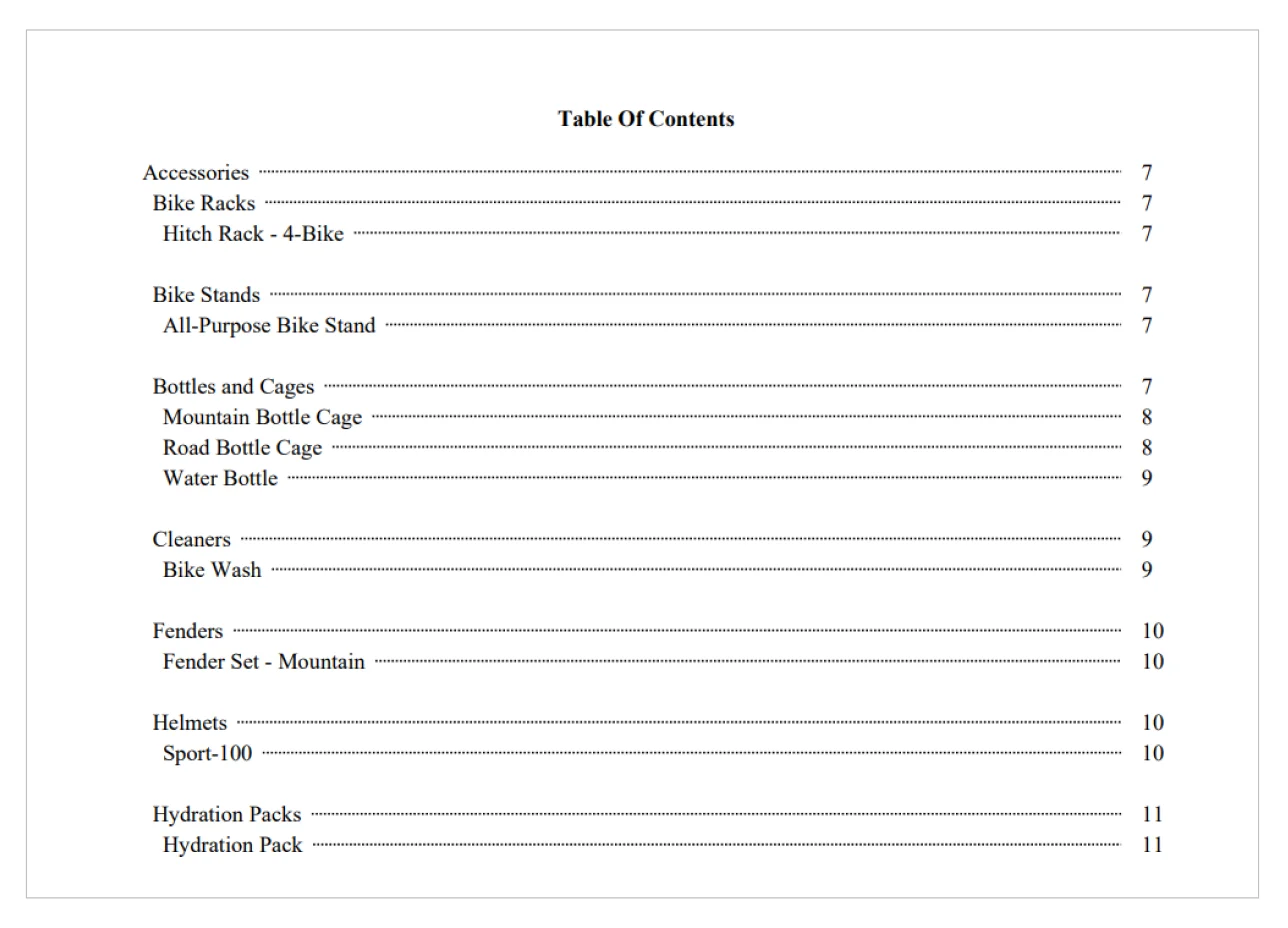
The table of content rendering now, makes navigation simple by enabling designers to jump directly to specific sections, improving readability, and reducing time spent searching for information.
What this means for teams:
-
- Faster access to relevant sections.
- Improved user experience for complex reports.
- Reduced effort in locating key data.
7. Gain full visibility into scheduled reports
Tracking scheduled reports was difficult because past executions were not visible. The enhancement of the execution history feature added execution history view on the schedule page, providing transparency, simplifying troubleshooting, and ensuring timely report delivery.
What this means for teams:
-
- Quickly identify issues with scheduled runs.
- Ensure timely report delivery.
- Improve accountability and operational efficiency.
8. Ensure secure and seamless access
Managing secure access in embedded environments was challenging. The single sign on (SSO) enhancement added OAuth and OpenID logout URL support, improving authentication, enhancing security, and delivering a seamless user experience.
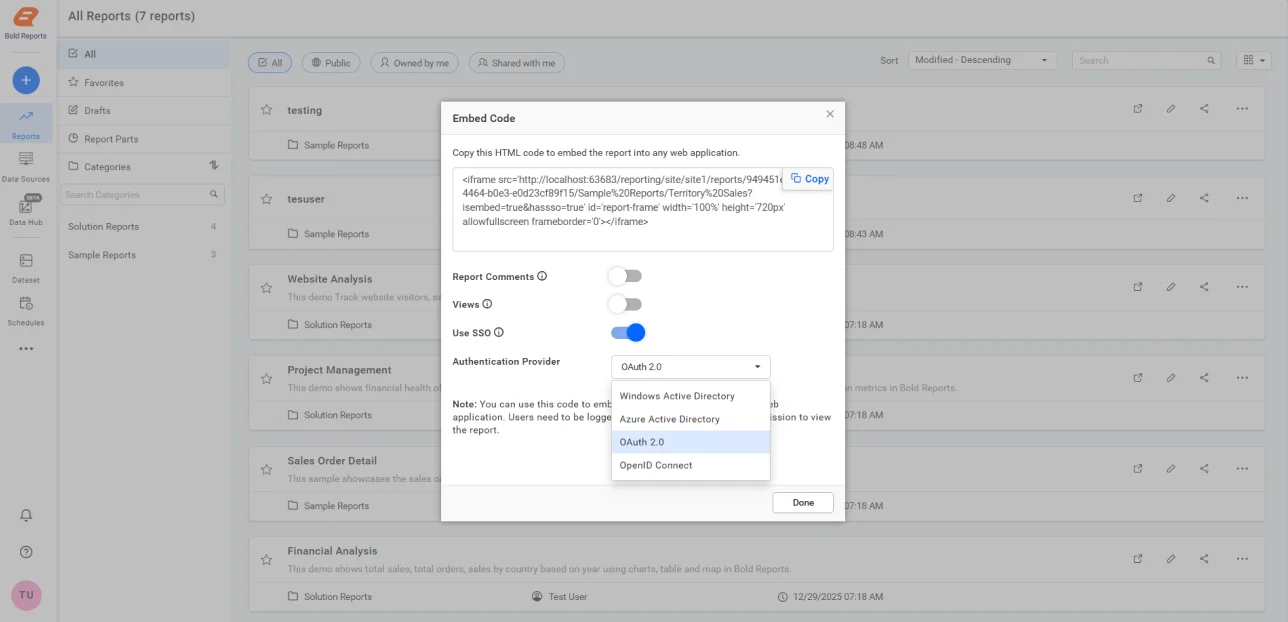
What this means for teams:
-
- Enhanced security for enterprise environments.
- Seamless authentication for embedded reports.
- Compliance with modern identity protocols.
9. Build Oracle queries faster and more accurately
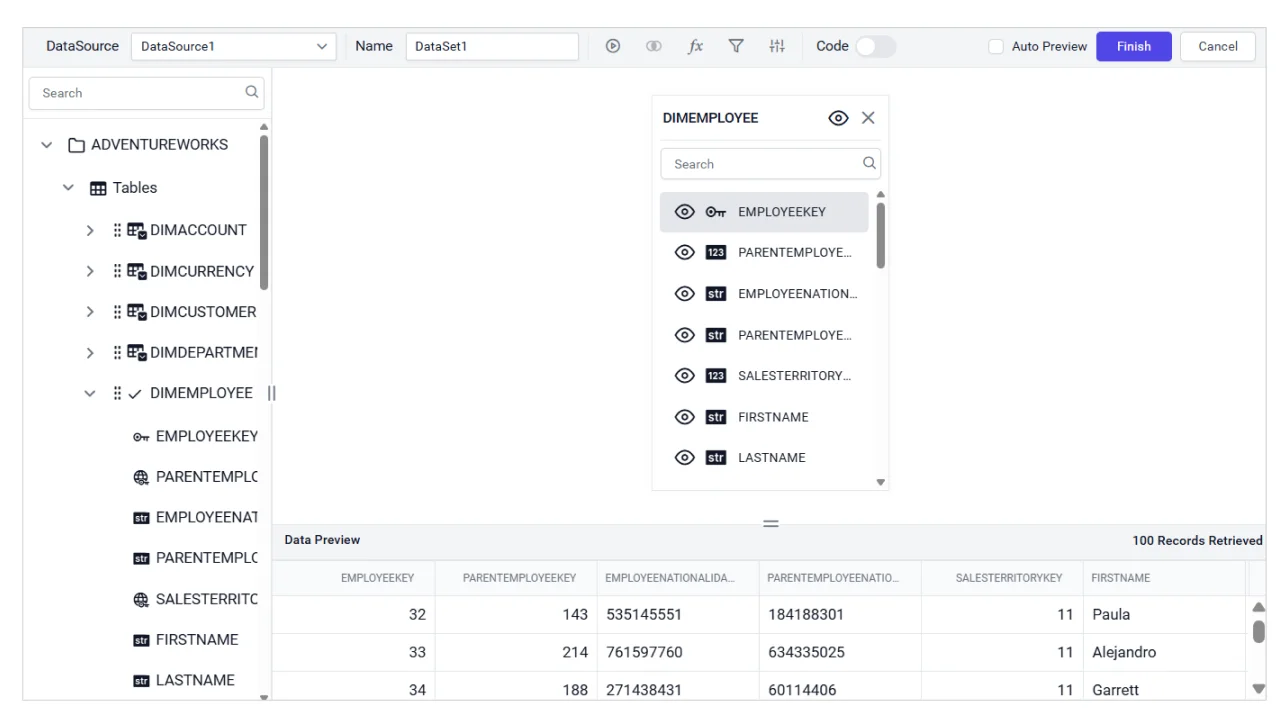
Developers faced delays when building Oracle queries due to limited schema search capabilities. To address this, we enhanced the Oracle Query Designer advanced schema search, enabling faster query creation and reducing errors for developers.
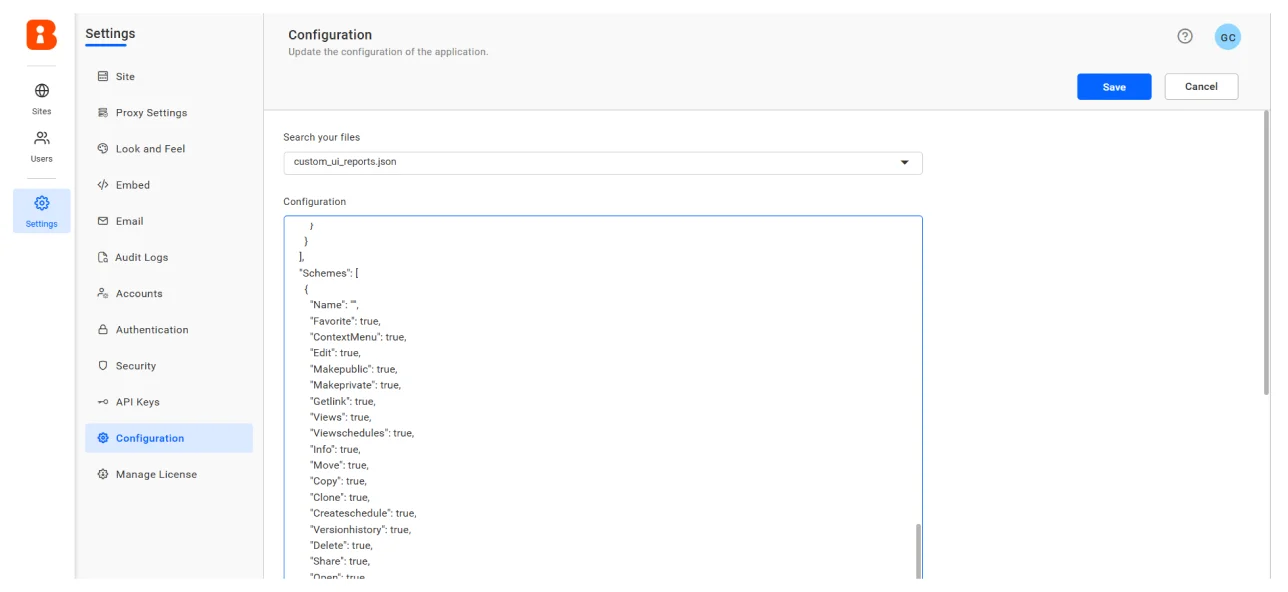
10. Customize interfaces without coding
Customizing a reporting interface required coding, creating a dependency on developers. The Custom UI JSON support introduced JSON-based customization, allowing teams to personalize layouts without technical effort, streamlining workflows, and improving flexibility.
11. Simplify permission management
Assigning permissions required multiple API calls, slowing down onboarding and administration. To address this, Bold Reports enabled multiple permissions in one API call, simplifying access management and reducing operational overhead.
What this means for teams:
-
- Faster onboarding for large teams.
- Simplified permission updates.
- Reduced administrative complexity.
With the core reporting experience strengthened, the next measure of success is real-world impact. Here’s how customers used Bold Reports in 2025.
Customer Success Stories that Defined Bold Reports in 2025
Every improvement in 2025 was driven by real reporting challenges faced by customers across industries. These organizations used Bold Reports to standardize design, modernize legacy reporting, and deliver reliable insights at scale.
These stories show how various organizations used Bold Reports to standardize design, modernize reporting workflows, and deliver reliable outputs at scale. To explore more examples, visit the Bold Reports customer stories page.
Bold Reports continues to deliver exceptional value to customers across industries, earning praise for its ease of use, flexibility, and powerful reporting capabilities. Here are some highlights of the reviews.
Bold Reports provides a comprehensive set of reporting tools that support interactive reports.
“I like Bold Reports for its intuitive drag-and-drop designer that simplifies report creation. Its wide data source support and seamless integration make it highly flexible for various applications. The interactive viewer and export options add great value for end-users.”
By Vishnu P. on G2.
Another customer also described Bold Reports as a powerful yet approachable reporting solution, emphasizing how its ease of use empowers both technical and non-technical users. They highlighted that Bold Reports makes it possible to confidently hand over report customization to regular users—something they wouldn’t attempt with tools like Access or SSRS.
Effortless Setup, Empowering Users
“I find Bold Reports to be very easy to use, which is a significant advantage for me and my team. Its user-friendly interface means I can confidently give it to regular users to modify reports, something we wouldn’t consider doing with Access or SSRS. The ease of use is not just about operating the system; Bold Reports is also very easy to set up, making the initial adoption process smooth and stress-free. Additionally, it effectively serves as our primary reporting tool for recurring static reports. The integration with other tools such as SQL Server, our claims software, and Microsoft Fabric works well, enhancing the overall functionality and efficiency. I’m particularly impressed with the way Bold Reports eliminates the need for complex infrastructure, unlike Access, thereby reducing cost and operational complexity. My positive experience is reflected in my likelihood to recommend Bold Reports to a friend or colleague, which I rate at 10 out of 10.”
By Brad M. on G2.
Want to see what others are saying? Check out more verified reviews on Bold Reports G2 Review for more insights.
Industry Recognition that Reflects Customer Trust
In 2025, Bold Reports earned recognition from G2 for excellence in embedded reporting and BI solutions, based on real customer feedback and satisfaction.
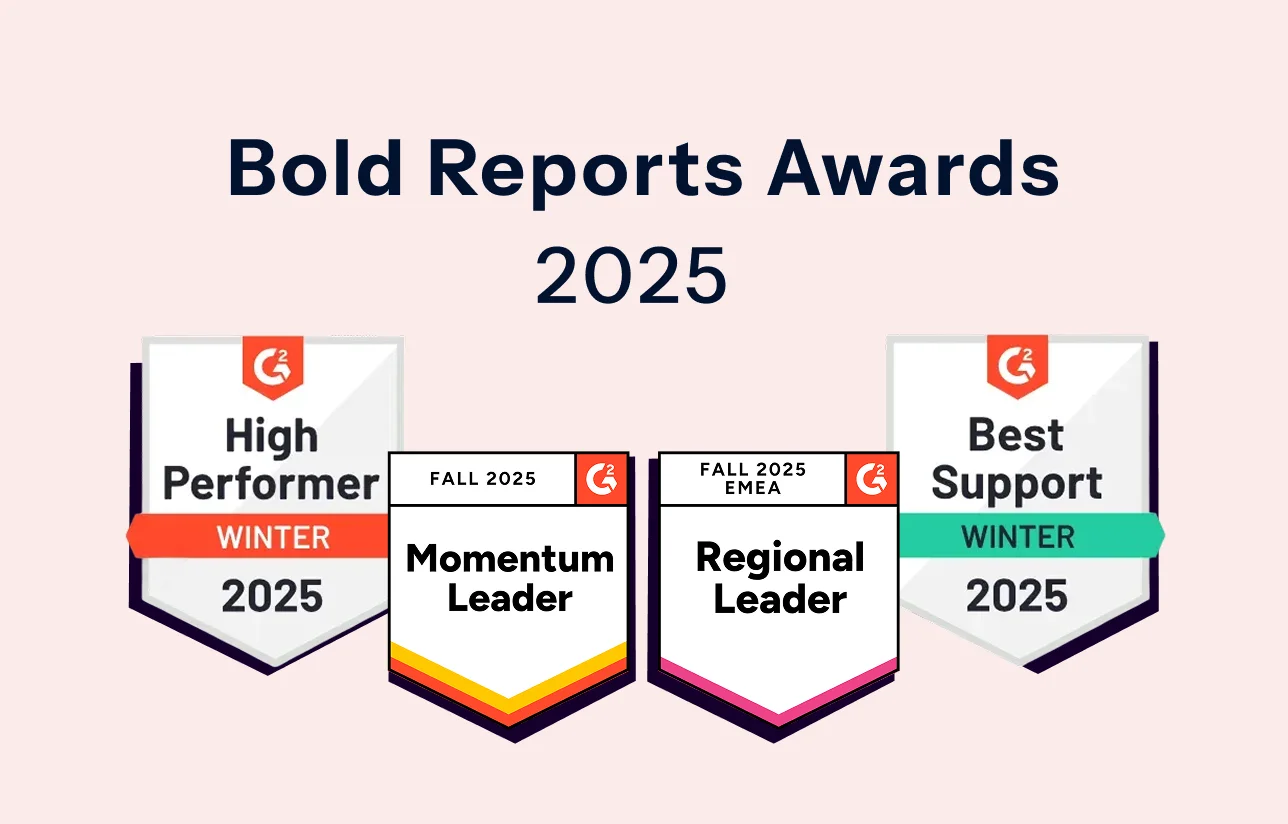
- G2 Winter Awards 2025: High Performer.
- G2 Fall Awards 2025: Leader in BI & Reporting.
These awards reflect Bold Reports’ commitment to reliability, usability, and customer-driven innovation.
What to Expect from Bold Reports in 2026
If 2025 was about transformation, 2026 will be about acceleration. Bold Reports is focused on faster rendering, lighter architecture, and smarter design experiences inspired by customer feedback.
Planned initiatives include:
- Migration to EJ2 lightweight architecture for faster rendering and no jQuery dependency.
- Multi-column layouts for professional, print-ready reports.
- AI-powered expression suggestions and cross-platform designer apps.
- Headless ETL via APIs, Azure AD integration, and improved error handling.
- Additional real-time data connectivity in Bold Reports.
Our mission remains clear: to help teams design, deliver, and scale reporting that’s faster, smarter, and easier to manage. Catch a glimpse of what’s coming next year in our product roadmap.
Looking Ahead into 2026
2025 was a milestone year, and Bold Reports® continues to evolve alongside its customers. As reporting needs grow more complex, our focus remains on simplifying design, improving performance, and expanding connectivity, without adding operational burden.
Ready to explore what’s next? Sign up for a free trial or request a personalized demo. Already signed up? Log in to begin using the latest Bold Reports features today. Thank you for being part of our journey in 2025.
Frequently Asked Questions
- 1.
What were the top innovations introduced in 2025?
Bold Reports delivered .NET 8/9 support, Material Design themes, MongoDB integration, HTML/PDF report items, and on-demand connectors like SQLite, Asana, MariaDB, and Google BigQuery.
- 2.
How do these updates improve reporting workflows?
They enhance speed, flexibility, and scalability, making report design easier, data integration faster, and overall performance more reliable.
- 3.
Who benefits most from these features?
BI developers, report designers, enterprise decision-makers, and existing customers looking for smarter, more efficient reporting solutions.
- 4.
What are Bold Reports’ goals for 2026?
Conversion typically completes in seconds, enabling faster reporting cycles.
- 5.
How can I explore these features or get started?
Sign up for a free trial, request a demo, or log in to your Bold Reports account to experience the latest updates firsthand.






