What Is Real-Time Reporting? Benefits & How It Works
TL;DR
Real-time reporting is the process of collecting, processing, and presenting data within seconds or minutes of generation, so decisions can be made based on what is happening right now instead of what happened yesterday. It differs from near-real-time reporting (minutes-to-hours delay) and batch reporting (scheduled, hours-to-days delay). Businesses use it for fraud detection, inventory monitoring, patient care, live sales tracking, and operational alerts, and developers deliver it by embedding live data and pixel-perfect reports directly into their own applications rather than relying on a separate BI dashboard tool.
What is real-time reporting?
Real-time reporting is the practice of capturing data as it is created and turning it into a readable report or visualization almost instantly, typically within seconds to a few minutes. Instead of waiting for an overnight batch job or a weekly export, decision-makers see the current state of a system, a process, or a customer interaction as it unfolds.
In practice, this looks like a warehouse system that flags a stock-out the moment inventory crosses a threshold, a support dashboard that shows a spike in error tickets within seconds of a deployment, or a delivery app that recalculates an estimated arrival time block by block as traffic changes. In each case, the report is not a snapshot of what happened yesterday; it is a live reflection of what is happening right now, which is what separates real-time reporting from traditional periodic reporting.
This matters more than ever. According to 2025 IDC data cited by IBM, 63% of enterprise use cases must process data within minutes to be useful, meaning more than half of today’s reporting work can’t wait for a traditional batch cycle. Even so, real-time reporting is not yet the default: ISG’s Analytics and Data Benchmark Research found that only 22 percent of enterprises analyze data in real time today, while ISG separately projects that by 2027, more than three-quarters of enterprises will be able to process events and streaming data in real time. In other words, the gap between “nice to have” and “table stakes” is closing fast, and businesses that build real-time reporting into their software now are positioning themselves ahead of that curve.
How real-time reporting works
Real-time reporting relies on a continuous pipeline rather than a periodic export. At a high level, four things happen in sequence, usually within seconds of each other:
1. Data capture
Events are recorded as they happen, whether that is a sensor reading, a transaction, a support ticket, or a website interaction. Most real-time systems use an event-driven approach, so each change triggers an update on its own instead of waiting to be picked up on a scheduled scan.
2. Live data connection
A live data connector streams or polls that data source at short intervals instead of waiting for a scheduled batch job, often through techniques such as webhooks, message queues, or change data capture that flag only what has changed.
3. Processing and refresh
The reporting layer recalculates aggregates, filters, and visualizations against the newly arrived data, then automatically refreshes the report. Well-built pipelines process only the incremental change rather than recomputing the entire report from scratch, which keeps refresh times low even as data volume grows.
4. Delivery
The updated report is pushed to the viewer, whether that is an embedded report inside an application, an email alert, or a scheduled notification tied to a threshold.
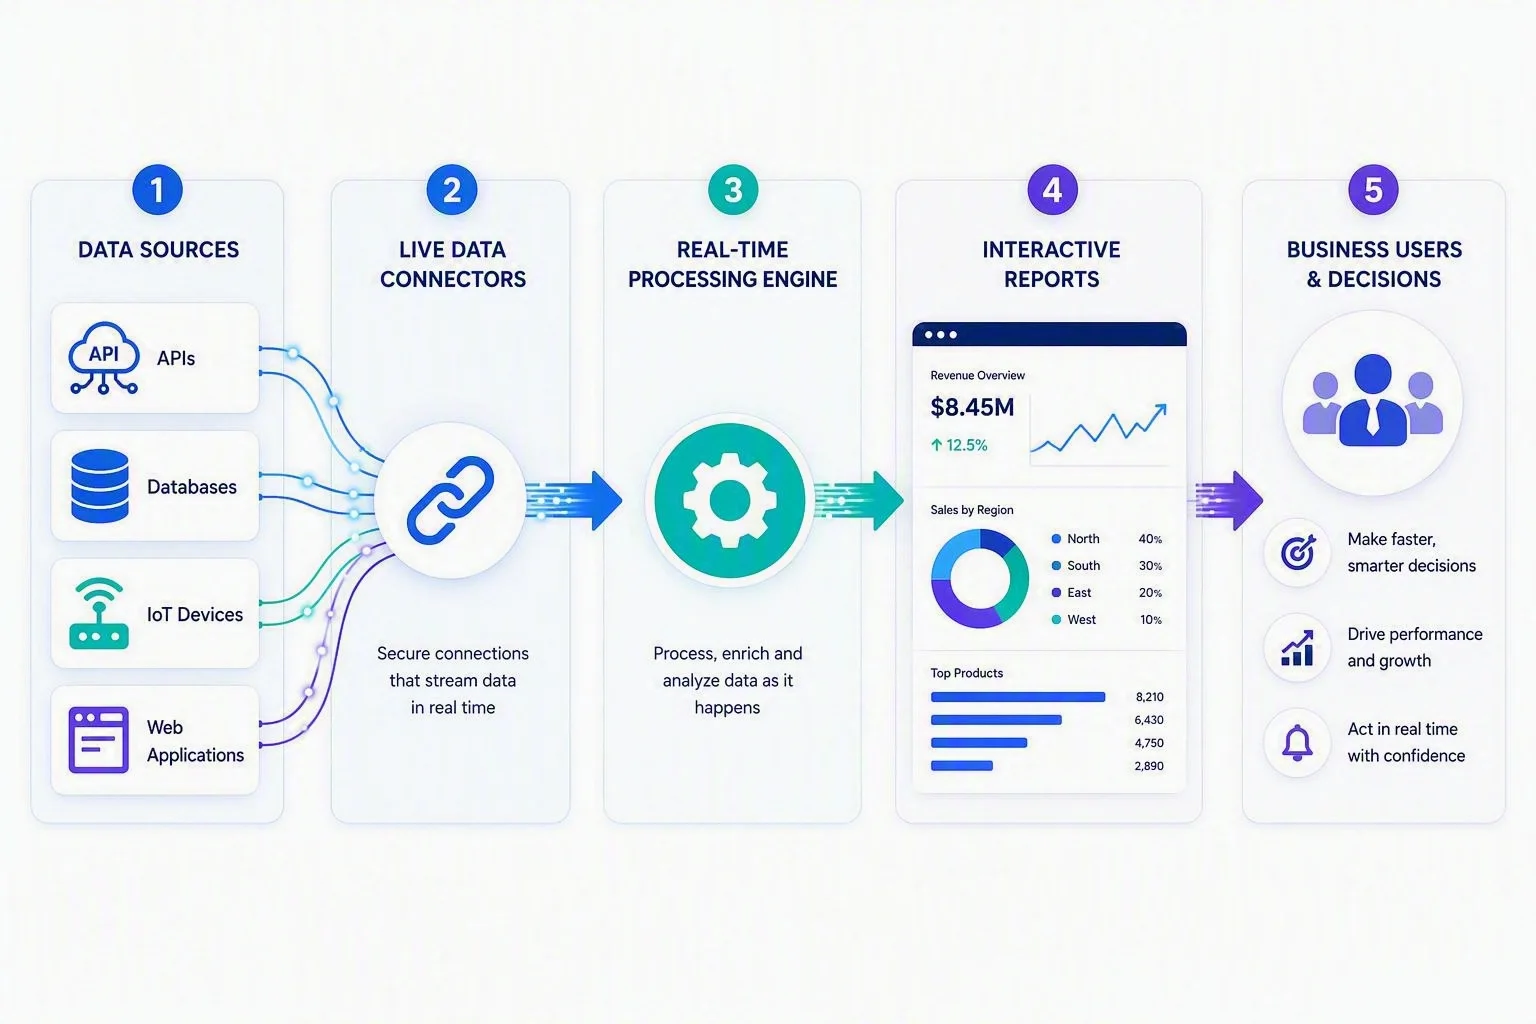
For teams building reporting into their own software, this pipeline is typically delivered through an embeddable report viewer and a set of live data connectors, rather than a standalone analytics dashboard product. That distinction matters for architecture decisions covered later in this guide. Getting it right typically means designing the report and its data connections together from the start, since a report that loads quickly but pulls from a source refreshed only once an hour is not actually real-time reporting, whatever the interface implies.
Real-time vs near-real-time vs batch reporting
Not every report needs to update every second, and choosing the wrong latency tier is a common source of wasted infrastructure spend. Here is how the three approaches compare:
| Aspect | Real-time reporting | Near-real-time reporting | Batch reporting |
| Typical data latency | Seconds to low minutes | Minutes to a few hours | Hours to days |
| Refresh trigger | Continuous stream or short polling interval | Scheduled micro-batches | Scheduled job, often overnight |
| Infrastructure complexity | Highest (streaming connectors, live refresh) | Moderate | Lowest |
| Best suited for | Fraud alerts, live inventory, operational monitoring | Sales dashboards, marketing performance, daily ops reviews | Financial close, compliance reporting, historical trend analysis |
| Cost profile | Higher (continuous processing) | Moderate | Lowest |
Most organizations do not need everything running in true real time. The practical approach is to reserve real-time reporting for the handful of metrics where even a few minutes of delay has a measurable cost, and use near-real-time or batch reporting everywhere else.
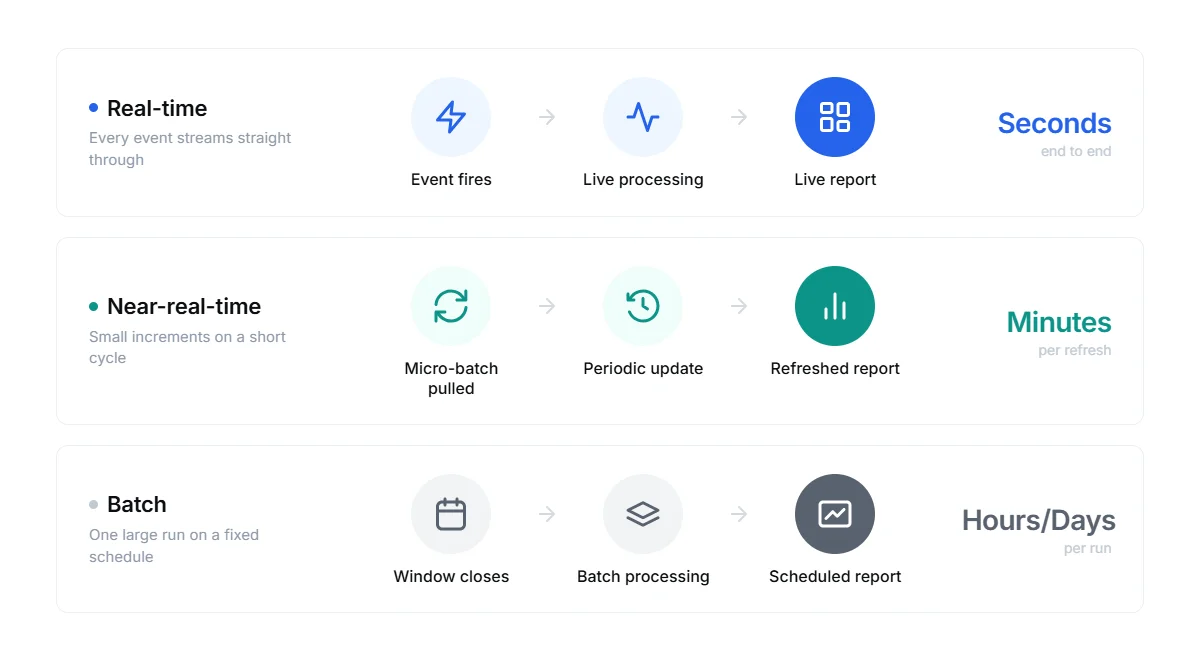
A useful way to see this in practice: an online retailer might track live inventory counts and payment fraud signals in true real time, refresh its marketing campaign performance every 15 minutes on a near-real-time cadence, and leave its month-end financial close on a nightly batch schedule. Each tier is deliberately chosen based on how costly a delay would be for that specific metric, not applied uniformly across the business.
Benefits of real-time reporting
1. Faster decisions
Teams act on what is happening now instead of reconstructing what already happened, shrinking the gap between an event and a response. This matters most in operations where a five-minute delay changes the outcome, such as halting a faulty production line or reallocating a delivery driver.
2. Earlier problem detection
Anomalies such as a fraud pattern, a defect rate spike, or a server error surface within minutes rather than at the next scheduled report. This shortens the window between something going wrong and someone finding out, often the single biggest driver of how costly an incident becomes.
3. Better customer experience
Live order status, live shipment tracking, and live account activity reduce support tickets and build trust, since customers increasingly expect the same live visibility from business software that they get from consumer apps like ride-hailing or food delivery.
4. More accurate operational visibility
Plant managers, dispatchers, and support leads work from the system’s current state rather than a stale snapshot, reducing decisions based on assumptions and increasing decisions based on current facts.
5. Competitive responsiveness
Pricing, staffing, and inventory decisions can adjust to real conditions instead of yesterday’s numbers, turning reporting from a historical record into an operational tool that shapes what happens next.
Real-time reporting use cases
Healthcare
Hospitals use real-time reporting to track bed occupancy, patient vitals, and lab results as they are recorded, helping clinical staff intervene faster and helping administrators balance patient load across departments. A nursing station display that updates the moment a monitor detects an abnormal reading can shave critical minutes off a clinical response, and administrators use the same live view to decide where to route incoming patients before a unit becomes overloaded.
Finance and fraud detection
Banks and payment processors monitor transactions as they occur to flag suspicious activity within seconds rather than during a nightly reconciliation, which is often the difference between stopping fraud and reporting it after the fact. Because fraud patterns often unfold across a handful of transactions in quick succession, a system that only reviews activity once a day will always be reporting on fraud that has already succeeded, rather than preventing it.
Manufacturing and inventory
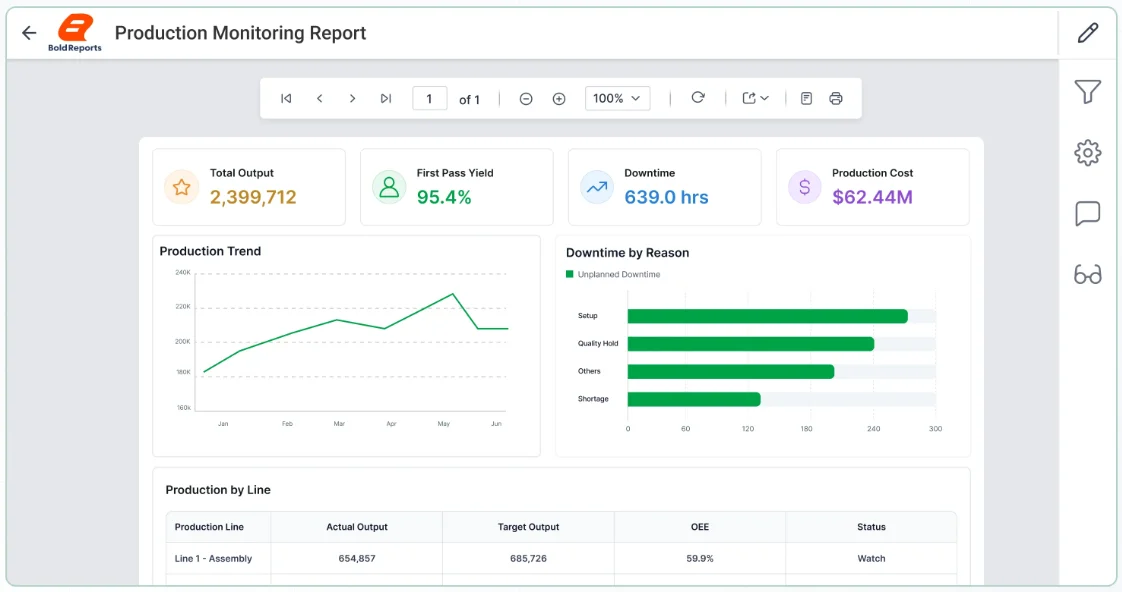
Production floors use live reports fed by IoT sensors to catch bottlenecks, quality issues, and equipment wear before they cascade into downtime, and warehouse teams track stock levels in real time to avoid stockouts or overstock. A sensor reporting a temperature or vibration reading outside its normal range can trigger a maintenance alert long before the equipment actually fails, and the same live visibility lets a warehouse trigger a reorder the moment stock crosses a threshold instead of discovering the shortfall during a weekly count.
Logistics and supply chain
Shipment tracking, fleet telemetry, and delivery ETAs update continuously so dispatchers can reroute around delays and customers can see accurate delivery windows. When a shipment is delayed at a port or a vehicle breaks down mid-route, a live report surfaces that disruption immediately, giving dispatchers time to reroute other deliveries before the delay compounds across the rest of the day’s schedule.
Sales
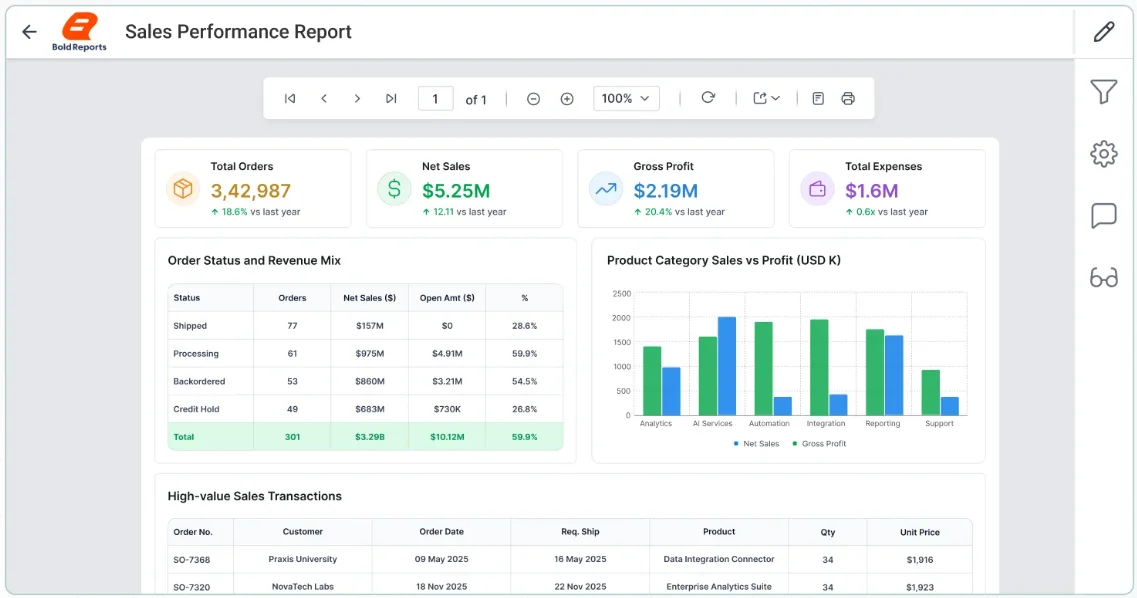
Live sales reports let regional managers see performance against target throughout the day, rather than discovering a shortfall after the quarter closes. This also makes it possible to catch a slow start to the month early enough to adjust a promotion or redirect effort, instead of learning about the shortfall only after it’s too late to act.
Digital marketing
Campaign dashboards refresh through the day so marketers can catch an underperforming ad set or a traffic spike from a viral post while there is still time to act on it. Real-time visibility into spend and conversion rate is especially valuable during a limited-time launch or sale, when a delay of even a few hours can mean an entire budget is spent on an ad set that stopped converting hours earlier.
IT and operations monitoring
Uptime, error rates, and infrastructure load are tracked continuously so engineering teams can respond to incidents in minutes instead of learning about them from a support queue. A spike in error rates or response time is often the earliest sign of a larger outage, and catching it in a live report gives engineering teams a head start before customers start noticing and support tickets start piling up.
Entertainment and ticketing
Event operators track ticket sales, venue capacity, and concession activity live during on-sale windows and event days to manage demand and staffing on the fly. During a high-demand on-sale, live sales data lets an operator open additional inventory or adjust pricing tiers within minutes, rather than waiting for an end-of-day report that arrives long after the buying window has closed.
Challenges and when real-time reporting is not the right fit
Real-time reporting is powerful, but it is not free, and it is not always necessary.
1. Infrastructure cost
Continuous data processing and live connectors cost more to run than a nightly batch job, so the metric needs to justify the spend. Teams that put every metric on a live feed by default often end up paying for real-time infrastructure that only a handful of reports actually need.
2. Data quality risk
Fast-moving data is more prone to gaps, schema drift, and incomplete records, which can produce a misleading “current” number if not handled carefully. A real-time report built on an incomplete or duplicated event stream can look authoritative while quietly showing the wrong number, which is worse than a batch report that is simply a few hours late.
3. Alert fatigue
Too many real-time thresholds create noise that teams eventually start ignoring, which defeats the purpose.
4. Not every decision is time-sensitive
Financial close, compliance filings, and quarterly trend analysis are usually better served by consistent, auditable batch or near-real-time reporting rather than a live feed.
5. Team readiness
Real-time reporting assumes someone is watching and ready to act on an alert; without that readiness, a live report becomes a faster version of a report nobody looks at.
A useful rule of thumb: build real-time reporting for the metrics where a delay of minutes has a real cost, and leave everything else on a near-real-time or scheduled cadence.
Best practices for effective real-time reporting
- Identify the metrics that actually need real-time latency, rather than defaulting everything to “live.”
- Set clear, actionable thresholds for alerts so notifications trigger only on meaningful deviations, starting conservatively and tightening them once you know what a normal range actually looks like for that metric.
- Validate data quality at the source, since real-time pipelines amplify the impact of bad data.
- Design for the viewer, not just the data. A live report that is cluttered or slow to load defeats the purpose of speed.
- Cache intelligently. Not every element of a report needs to refresh every second; selective caching keeps performance high without sacrificing timeliness.
- Secure live data connections the same way you would any other production data path, including access controls and encryption in transit.
- Review and retire unused real-time reports periodically, since requirements change and stale live reports still consume infrastructure.
None of these practices require making everything live at once. Most teams succeed by piloting real-time reporting on one or two high-value metrics, proving the value, and then expanding deliberately from there.
Delivering real-time, embedded reports with Bold Reports
Most real-time reporting content online is written from a business-intelligence-dashboard perspective, built for internal teams who log into a separate analytics tool. Developers and ISVs building reporting into their own software have a different problem: they need pixel-perfect, paginated reports with live data, delivered inside the application their customers already use, not a bolt-on dashboard product.
In practice, this usually means a developer embeds a report viewer directly into an existing application screen, wires it to a live data connector for the metrics that need to stay current, and layers in scheduling for reports that only need periodic refreshes. The result is one reporting experience inside the product, rather than users bouncing between their own application and a separate analytics tool to get the full picture.
Bold Reports® addresses that specific need through:
-
- Live data connectors that feed reports from databases, APIs, and other data sources without manual export/import cycles.
- Report Viewer, Designer, and Writer SDKs that let developers embed pixel-perfect, paginated reports directly into their own web and desktop applications, through the Bold Reports embedded reporting toolset.
- Scheduling and notifications so stakeholders receive reports and threshold-based alerts automatically, through flexible report schedules, without manually refreshing a dashboard.
- Caching controls that balance live-data freshness with performance for high-volume reports, using Bold Reports’ caching options.
- Flexible deployment, available on-premises or in the cloud through Bold Reports’ pricing and deployment plans, so real-time reporting fits inside existing infrastructure and compliance requirements.
For teams evaluating collaborative, multi-user live reporting specifically, see Bold Reports’ real-time collaborative reporting page.
Key takeaways
Real-time reporting turns live data into an immediate, actionable report instead of a historical record, and its value is growing quickly: Omdia’s IoT Enterprise Survey of over 600 enterprises across ten countries found real-time analytics has become the dominant technology priority for enterprise IoT deployments, with 82% of organizations currently using or planning to implement real-time data processing. The businesses that benefit most are not trying to make everything live; they are identifying the specific metrics where speed matters, building the right latency tier for each one, and, for teams building reporting into their own software, embedding that live data through a report viewer and connector architecture rather than routing users to a separate dashboard product. That is the approach Bold Reports supports through its Report Viewer, Designer, and Writer SDKs, live data connectors, and scheduling and notification tools
Start your 30-day free trial today or book a free demo to see how Bold Reports can transform your real-time reporting workflow. Whether you’re new to reporting platforms or switching from another tool, Bold Reports offers smooth onboarding with expert guidance every step of the way.
Frequently asked questions
- 1.
What is real-time reporting?
Real-time reporting is the process of collecting, processing, and presenting data within seconds or minutes of generation, so decisions can be based on the current state of a system rather than a historical snapshot.
- 2.
How is real-time reporting different from real-time analytics?
Real-time reporting focuses on presenting current data in a readable report or visualization as events occur. Real-time analytics goes a step further, applying calculations, models, or predictions to that live data, often to surface a recommendation rather than just a number.
- 3.
What is the difference between real-time and near-real-time reporting?
Real-time reporting helps organizations react quickly to changes, monitor live KPIs, detect issues early, improve operational efficiency, and enhance customer experiences.
- 4.
Does real-time reporting require a data warehouse?
No. Many real-time reports connect directly to operational databases, APIs, or live data connectors rather than waiting for data to be loaded into a warehouse, which is one reason latency stays low.
- 5.
Can real-time reporting be embedded into my own application?
Yes. Developers can embed live-data, pixel-perfect reports directly into web or desktop applications using a report viewer SDK and live data connectors, rather than sending users to a separate BI dashboard tool.