
What Is IT Reporting? The 2026 Guide for IT Leaders

TL;DR
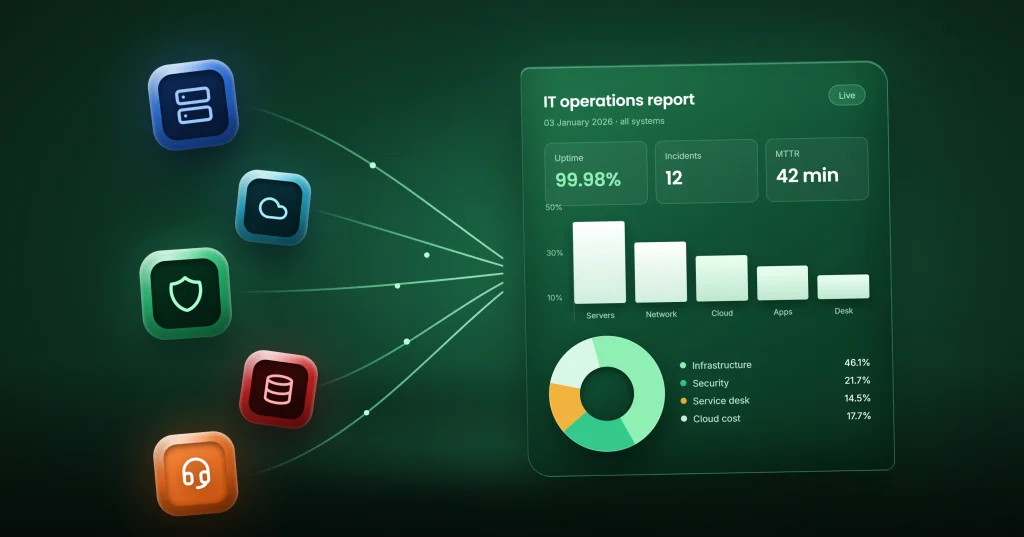
IT reporting helps organizations monitor performance, improve security, reduce costs, and make data-driven decisions. By bringing together data from infrastructure, networks, cloud environments, service desks, and IT assets, businesses gain actionable insights to improve efficiency and service delivery. With modern reporting tools, teams can automate IT reporting and turn complex data into clear, business-ready insights that drive growth.
Introduction
IT reporting is the process of collecting, analyzing, and presenting data from IT systems to monitor performance, improve operations, support compliance, and guide business decisions. As organizations manage increasingly complex IT environments, maintaining visibility into systems, services, and resources becomes more challenging. Without effective reporting, identifying issues, measuring performance, and making informed decisions can be difficult.
Poor visibility can have a significant impact. According to Uptime Institute, 54% of organizations reported that their most recent significant outage cost more than $100,000, while 16% reported losses exceeding $1 million.
IT reporting transforms operational data into actionable insights through reports helping organizations improve service delivery, strengthen security, and support data-driven decision-making.
In this guide, we’ll explore what IT reporting is, why it matters, its key benefits, common report types, and best practices for building an effective IT reporting strategy.
What is IT reporting?
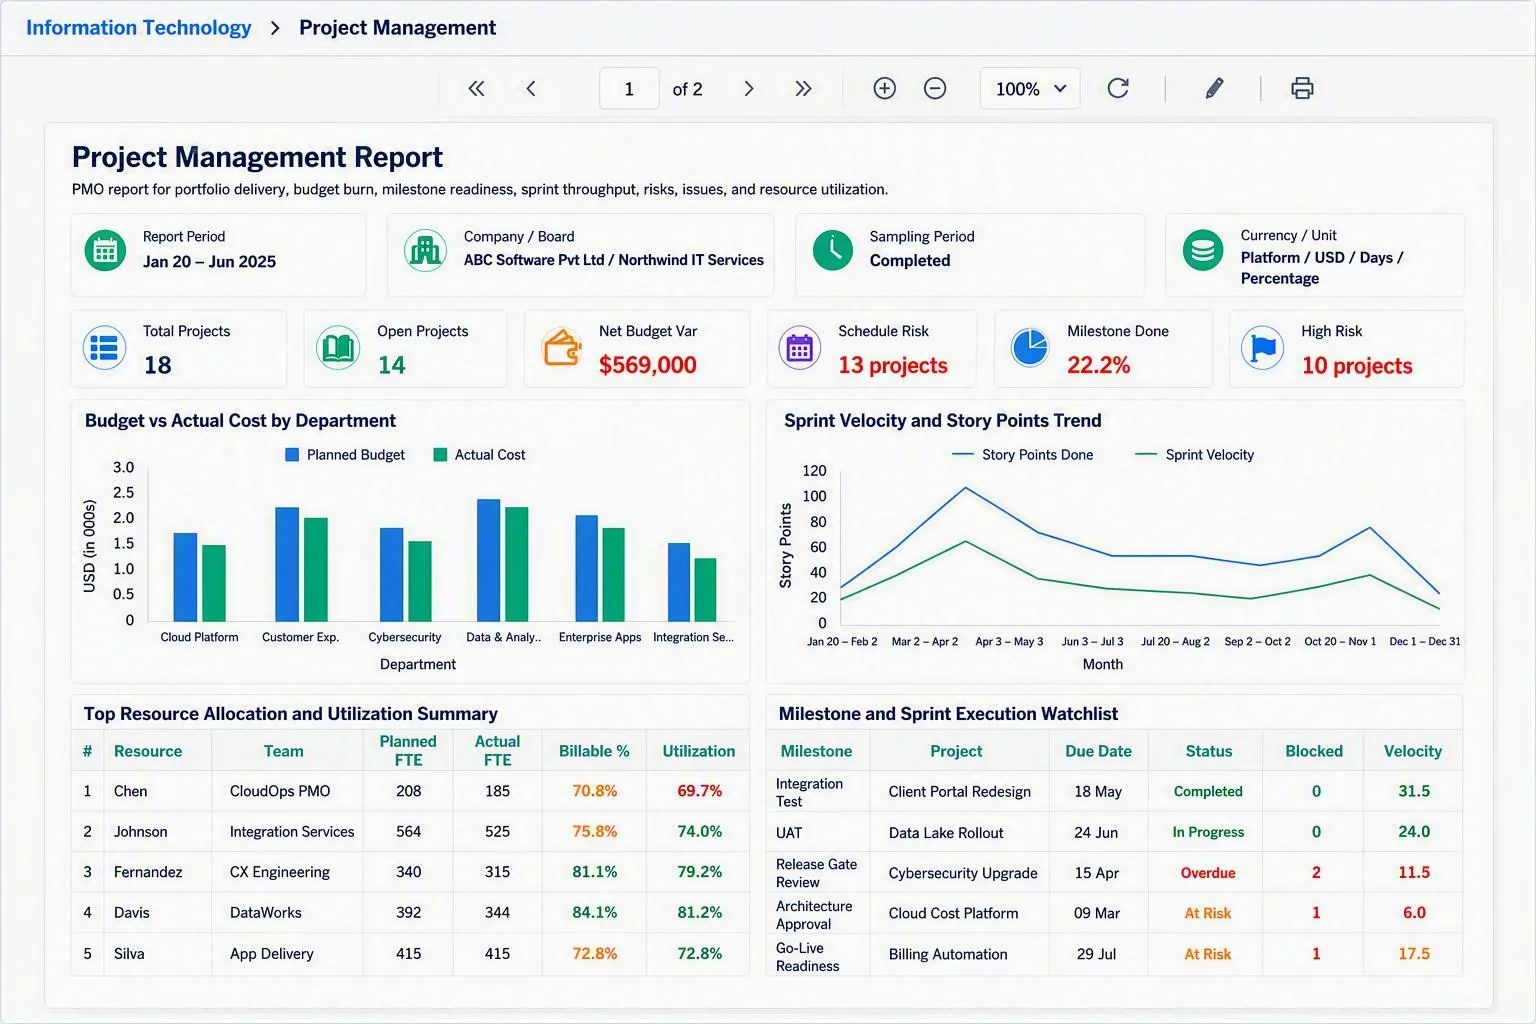
IT reporting is the process of collecting, analyzing, and presenting data from IT systems to monitor performance, improve operations, and support decision-making. Organizations use IT reports to monitor system uptime, incident trends, resource utilization, and security events, helping teams gain visibility into their IT environments and manage operations more effectively.
Benefits of IT reporting to businesses
IT reporting helps organizations transform raw IT data into actionable insights that support operational efficiency, security, and strategic decision-making. By providing a clear view of IT performance and resources, it enables businesses to manage their technology environments more effectively.
1. Improved decision-making
IT reports provide accurate, data-driven insights that help IT leaders and stakeholders make informed decisions, prioritize initiatives, and align technology investments with business goals.
2. Enhanced visibility into IT operations
Reporting gives organizations a centralized view of infrastructure, applications, networks, and services, making it easier to track performance and monitor system health.
3. Better resource utilization
IT reporting helps identify underutilized or overused resources, enabling organizations to optimize hardware, software, cloud services, and IT budgets.
4. Stronger security and risk management
Security reports help teams monitor threats, track vulnerabilities, detect anomalies, and respond proactively to cybersecurity risks.
5. Faster issue detection and resolution
Effective reporting helps organizations identify trends before they become major incidents. The Uptime Institute found that four out of five organizations believe their most recent serious outage could have been prevented through better management, processes, or configuration practices.
6. Improved compliance and audit readiness
IT reports provide the documentation needed to demonstrate compliance with regulatory requirements, security standards, and internal policies.
7. Increased operational efficiency
Automated reporting reduces manual data collection and analysis, saving time, and allowing IT teams to focus on higher-value activities.
How does IT reporting work?
While IT reporting platforms vary in their features and capabilities, most follow a similar process to collect, analyze, and present IT data. This helps organizations gain insights into performance, security, resource utilization, and overall IT operations.
Data collection
Data is collected from servers, databases, networks, cloud platforms, help desk systems, security tools, and monitoring applications in real time, on scheduled intervals, or when specific events occur.
Data integration and processing
Once collected, the data is consolidated, cleaned, and standardized to ensure consistency and accuracy. This process eliminates duplicate records, resolves discrepancies, and prepares the data for meaningful analysis.
Data analysis
The processed data is analyzed to identify trends, measure key performance indicators (KPIs), detect anomalies, and uncover potential issues. This analysis helps organizations gain insights into system performance, security threats, resource utilization, and service delivery effectiveness.
Report generation
The analyzed information is presented in reports, charts, and visualizations. These visual representations make complex IT data easier to understand and enable stakeholders to quickly identify patterns, trends, and areas that require attention.
Report delivery
Reports are shared with stakeholders through reports, email subscriptions, web portals, or business applications. Many organizations automate this process to ensure timely access to insights.
Decision-making
IT teams and business leaders use report findings to improve system performance, strengthen security, optimize resources, and support strategic planning.
Six types of IT reports
Organizations use different types of IT reports to monitor performance, manage resources, strengthen security, and support strategic decision-making. Here are some of the most common IT reports used by modern businesses.
Infrastructure performance reports
Infrastructure performance reports provide insights into the health, availability, and efficiency of IT infrastructure, including servers, networks, storage systems, databases, and cloud environments. These reports help IT teams identify performance bottlenecks, monitor uptime, and ensure systems operate reliably.
Security reports
Security reports track cybersecurity incidents, threats, vulnerabilities, and compliance activities across the organization. They help security teams assess risks, monitor security posture, respond to threats, and ensure critical systems and data remain protected.
Inventory reports
Inventory reports provide a comprehensive view of an organization’s IT assets, including hardware, software licenses, devices, and cloud resources. These reports help businesses track asset utilization, manage procurement, reduce unnecessary costs, and maintain accurate asset records.
Compliance and audit reports
Compliance and audit reports document adherence to industry regulations, security standards, and internal policies. They provide evidence of compliance, support audit processes, and help organizations identify and address potential governance or regulatory gaps.
Incident management reports
Incident management reports track IT incidents, service disruptions, and their resolutions. These reports help organizations analyze incident trends, measure response and resolution times, identify recurring issues, and improve overall service reliability.
IT service management (ITSM) reports
ITSM reports measure the effectiveness and efficiency of IT service delivery and support operations. They typically include metrics such as ticket volume, service request fulfillment, SLA compliance, resolution times, and customer satisfaction, enabling organizations to continuously improve IT services.
Real-world IT reporting examples
The following examples highlight how businesses use IT reports to improve efficiency and achieve operational goals.
Customer service performance report
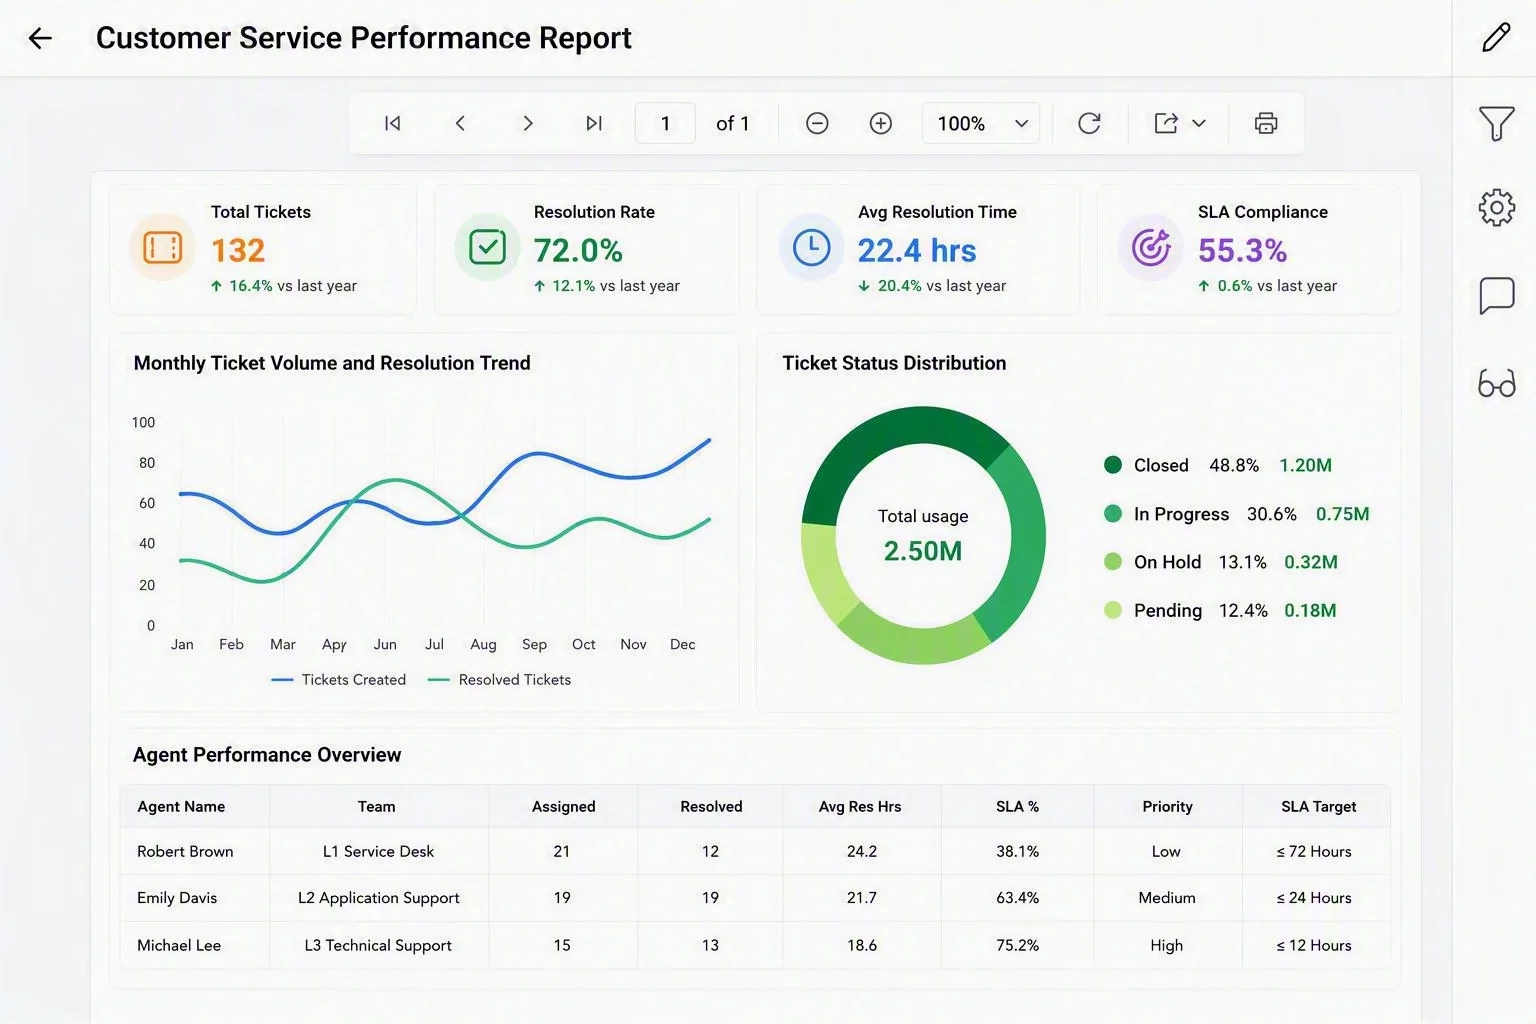
A customer service performance report helps organizations monitor key support metrics, including ticket volume, resolution rate, average resolution time, and SLA compliance. By analyzing customer support trends, ticket status distribution, and agent performance, businesses can improve service efficiency, reduce response times, and enhance customer satisfaction.
Project management report
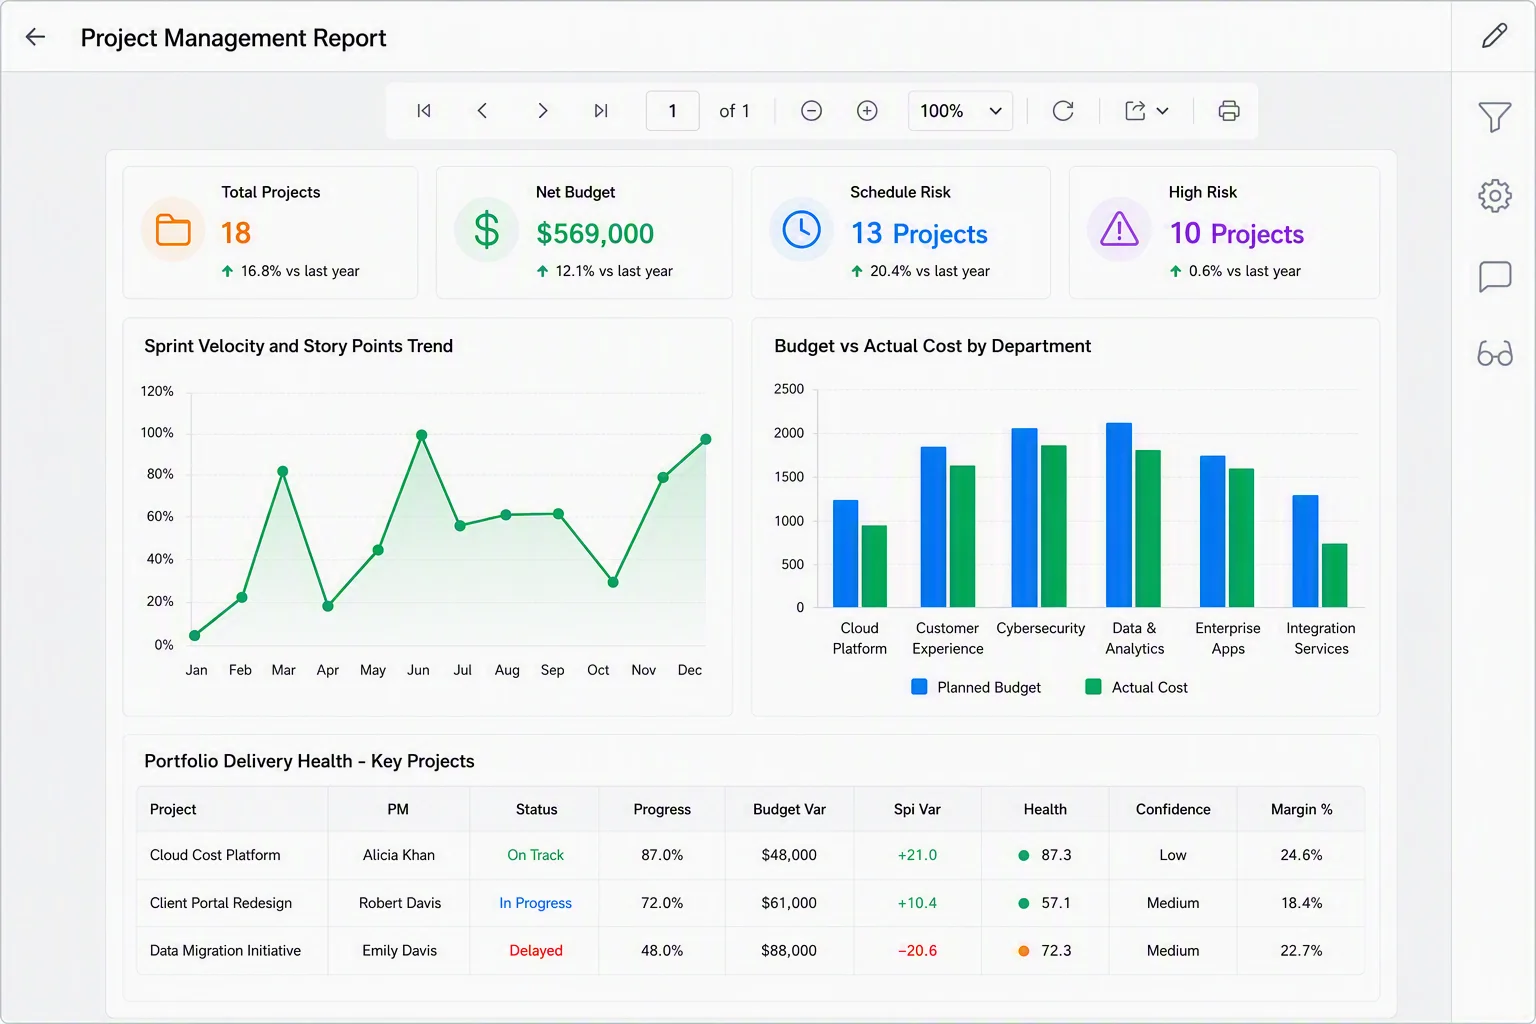
Project managers use reports to monitor project portfolios, budgets, resource utilization, schedule risks, and project health. These reports provide visibility into project progress, budget variances, delivery risks, and team performance, enabling stakeholders to make informed decisions and keep projects on track.
Six essential IT reporting metrics and KPIs to track
These metrics provide valuable insights that support proactive management and data-driven decision-making.
1. System uptime
System uptime measures the percentage of time that IT systems, applications, or services remain available and operational. High uptime ensures business continuity and minimizes costly disruptions.
Formula: System Uptime (%) = (Total Available Time ÷ Total Scheduled Time) × 100
Benchmark: Most organizations target 99.9% uptime, while enterprise and mission-critical systems often aim for 99.99% uptime or higher.
2. Mean time to resolution (MTTR)
MTTR measures the average time required to resolve an IT incident after it has been identified. A lower MTTR indicates faster issue resolution and improved IT service efficiency.
Formula: MTTR = Total Incident Resolution Time ÷ Number of Incidents Resolved
Benchmark: MTTR benchmarks vary by industry and incident severity. Critical incidents are commonly targeted for resolution within 1-4 hours, while standard incidents are often resolved within 8-24 hours
3. Incident volume
Incident volume tracks the number of IT issues, service requests, or support tickets reported during a specific period. Monitoring incident trends helps identify recurring problems and improve operational stability.
Formula: Incident Volume = Total Number of Incidents Reported During a Period
Organizations typically track month-over-month trends and aim to reduce recurring incidents over time.
4. Resource utilization
Resource utilization measures the consumption of key IT resources, including CPU, memory, storage, and network bandwidth. It helps optimize infrastructure usage, prevent bottlenecks, and support capacity planning.
Formula: Resource Utilization (%) = (Resource Used ÷ Total Resource Capacity) × 100.
Benchmark: A utilization range of 60%-80% is often considered healthy, while sustained utilization above 85% may indicate capacity constraints or performance risks.
5. Customer satisfaction score
Customer satisfaction score (CSAT) measures how satisfied end users are with IT services and support. It is typically collected through surveys after a support ticket is resolved, or a service request is completed.
Formula: CSAT (%) = (Positive Responses ÷ Total Responses) × 100
Benchmark: A CSAT score of 75%-84% is generally considered good, while 85% or higher is considered excellent.
6. SLA compliance rate
SLA compliance rate tracks how consistently IT teams meet agreed service-level targets for response and resolution times. High SLA compliance reflects reliable service delivery and greater user satisfaction.
Formula: SLA Compliance Rate (%) = (Tickets Meeting SLA ÷ Total Tickets) × 100
Benchmark: Most IT service teams target 95% or higher SLA compliance, with high-performing organizations often achieving 98%-99%.
How does IT report support security and compliance?
IT reporting supports security, governance, and regulatory compliance by helping organizations monitor controls, track audit activities, manage access, and demonstrate compliance with regulatory requirements.
Common compliance frameworks supported by IT reporting
- GDPR: Helps organizations comply with data privacy requirements by tracking how personal data is collected, stored, processed, and accessed.
- HIPAA: Requires healthcare organizations to monitor and report on access to protected health information.
- PCI DSS: Requires organizations handling payment card data to maintain security controls and audit trails.
- SOX: Requires reporting controls that support financial transparency and governance.
- NIST: Helps organizations measure cybersecurity readiness and track risk-management activities.
Why is IT reporting important for different stakeholders?
Different stakeholders require different types of IT reports to support their responsibilities and decision-making needs.
| Role | Common IT reports | Primary purpose |
| CIO / CTO | IT performance reports, technology risk reports, budget reports | Strategic planning and investment decisions |
| IT manager | SLA compliance reports, incident management reports, resource utilization reports | Service delivery and operational management |
| System administrator | Infrastructure performance reports, uptime reports, capacity planning reports | System health and availability monitoring |
| Security team | Security reports, vulnerability reports, compliance reports | Risk management and regulatory compliance |
| Help desk manager | Ticket volume reports, resolution time reports, CSAT reports | Support performance monitoring |
| Executives | Executive summary reports, KPI reports, business impact reports | High-level decision-making and business oversight |
What is the difference between RMM, observability, BI, and embedded reporting?
IT reporting overlaps with four adjacent technologies: Remote monitoring and management (RMM), observability, BI, and embedded reporting. While they share some capabilities, each serves a different purpose.
| Category | Primary purpose | Typical users | Example tools | Best for |
| RMM/PSA | Monitor and manage IT infrastructure, devices, and service operations | MSPs, IT operations teams | ConnectWise, NinjaOne, Atera | Infrastructure monitoring, ticketing, and remote management |
| Observability platforms | Analyze logs, metrics, events, and traces for troubleshooting | DevOps, SRE, engineering teams | Datadog, New Relic, Dynatrace | Application performance monitoring and root-cause analysis |
| Business intelligence (BI) | Analyze data through dashboards and interactive analytics | Business analysts, managers, executives | Power BI, Tableau, Looker | Data exploration, trend analysis, and decision-making |
| Embedded reporting | Embed reporting directly into applications
|
Business applications, IT teams, enterprises | Bold Reports | Report creation, automation, exporting, and distribution |
Still struggling to consolidate IT data across multiple systems? Request a demo to see how Bold Reports® automates IT reporting, tracks KPIs, and delivers pixel-perfect reports from a single platform.
What are the limitations of IT reporting?
1. Data silos
IT data is often spread across multiple systems, making it difficult to get a complete view of operations. Centralizing data from various sources into a single reporting platform helps improve visibility and consistency.
2. Manual reporting processes
Manual data collection and spreadsheet-based reporting are time-consuming and error-prone. Automating report generation and delivery improves efficiency and accuracy.
3. Limited real-time visibility
Traditional reports are often generated periodically, which can result in delayed insights. Organizations requiring real-time anomaly detection, alerting, or incident response typically need monitoring and observability tools alongside IT reporting.
4. Inconsistent reporting standards
Different teams may use different metrics and report formats, leading to conflicting insights. Standardizing KPIs and reporting templates help ensure consistency across the organization.
5. Scalability challenges
As IT environments grow, manual reporting becomes harder to manage. Adopting a scalable reporting solution enables organizations to handle larger data volumes and evolving reporting needs with ease.
6. Limited predictive capabilities
IT reporting is primarily designed to analyze historical and current performance. Predicting outages, capacity constraints, or future incidents often requires advanced analytics, AI, or forecasting tools.
Best practices for IT reporting
Define clear reporting goals
Establish specific objectives for your IT reports, such as monitoring system performance, improving service delivery, or tracking security risks. Clear goals help ensure reports provide actionable insights.
Focus on key KPIs
Track the metrics that matter most, including system uptime, MTTR, incident volume, resource utilization, and SLA compliance. This keeps reports relevant and easy to interpret.
Automate reporting
Automate data collection, report generation, and distribution to reduce manual effort, improve accuracy, and ensure stakeholders always have access to up-to-date information.
Use clear visualizations
Present data using charts, graphs, and reports to make complex IT information easier to understand and analyze.
Tailor reports to the audience
Customize reports based on stakeholder needs. Executives typically need high-level KPIs and trends, while IT teams require detailed operational and technical insights.
Ensure data accuracy
Accurate data is the foundation of effective IT reporting. Regularly validate data sources and eliminate inconsistencies to ensure reports provide reliable insights. Gartner estimates that poor data quality costs organizations an average of $12.9 million annually, highlighting the importance of maintaining data quality.
How to choose the right IT reporting tool
Selecting the right IT reporting solution is essential for turning complex IT data into actionable insights. The ideal solution should meet your current reporting needs and scale as your organization grows.
- Data source connectivity: The tool should connect to databases, cloud platforms, monitoring tools, help desk systems, and security applications. Limited integrations often create data silos and require manual data consolidation, making reporting more time-consuming and less reliable.
- Reporting and visualization capabilities: Look for a solution that supports detailed reports, charts, and drill-down analysis. Poor visualization capabilities can make it difficult for stakeholders to understand trends and make informed decisions.
- Automation features: The software should automatically generate and distribute reports based on predefined schedules. Manual reporting increases administrative effort, introduces errors, and delays access to important insights.
- Scalability and performance: The platform should handle increasing data volumes, users, and reporting requirements without compromising performance. Tools that don’t scale can lead to slower reporting and costly migrations later.
- Security and access control: Since IT reports often contain sensitive operational and security data, the tool should offer robust security features, including role-based access, authentication, and data protection controls. Weak security controls can increase compliance and data exposure risks.
How Bold Reports simplifies IT reporting
Managing IT reporting can be challenging when data is spread across multiple systems and reports require significant manual effort. Bold Reports simplifies the process by helping organizations centralize data, automate reporting, and deliver actionable insights at scale.
- Connect data across your IT ecosystem: Bold Reports integrates with a wide range of data sources, including SQL Server, MySQL, PostgreSQL, Oracle, cloud databases, and REST APIs, enabling organizations to consolidate IT data into a single reporting platform.
- Automate reporting workflows: Eliminate repetitive reporting tasks by automating report generation, scheduling, and distribution. This ensures stakeholders receive accurate, up-to-date reports without manual intervention.
- Build interactive reports: Create dynamic reports with filtering, parameterization, and drill-down capabilities that allow users to explore KPIs, analyze trends, and gain deeper insights into IT operations.
- Deliver pixel-perfect reports: Design professional reports for infrastructure monitoring, IT service management, security audits, compliance tracking, and executive reporting with precise formatting and layout control.
- Scale reporting across the enterprise: Whether reporting for a small IT team or a large enterprise, Bold Reports provides the flexibility and scalability needed to support growing data volumes and evolving business requirements.
- Strengthen compliance and audit readiness: Generate standardized reports that help support compliance requirements, audits, and governance initiatives with accurate and consistent data.
- Embedded reporting: allows organizations to integrate reporting directly into their applications and workflows. Instead of requiring users to switch between systems, reports can be accessed, viewed, filtered, exported, and scheduled from within the applications they already use.
Final thoughts
IT reporting plays a critical role in helping organizations monitor system performance, improve service delivery, strengthen security, and make informed business decisions. By transforming raw IT data into actionable insights, businesses can gain greater visibility into their technology environment and proactively address operational challenges. As IT environments grow more complex, traditional reporting methods often struggle with data silos, manual processes, and limited visibility. Modern IT reporting tools like Bold Reports help overcome these challenges by centralizing data, automating report generation, tracking key IT reporting metrics, and delivering real-time insights through interactive reports.
Whether you’re monitoring service desk performance, infrastructure health, or security KPIs, Bold Reports provides the scalability, flexibility, and visibility needed to support effective IT performance reporting and drive continuous improvement.
To learn more about the broader reporting concepts that support operational and business decision-making, explore our guide “What Is Reporting?”
Ready to modernize your IT reporting? Start a 30-day free trial to create powerful IT reports and give your teams the visibility they need to monitor performance, improve service delivery, and stay ahead of operational challenges.
Frequently asked questions
- 1.
What should an IT report include?
An IT report should include relevant KPIs, operational metrics, trends, incidents, performance data, and actionable insights that align with business and IT objectives.
- 2.
What is the difference between IT reporting and IT monitoring?
IT monitoring focuses on tracking systems in real time and generating alerts when issues occur, while IT reporting analyzes historical and current data to provide insights into performance, trends, and operational effectiveness.
- 3.
How often should IT reports be generated?
Report frequency depends on business needs. Operational reports may be generated daily or weekly, while executive, compliance, and strategic reports are often created monthly or quarterly.
- 4.
What role does IT reporting play in cybersecurity?
IT reporting helps security teams monitor threats, track vulnerabilities, review access activities, demonstrate compliance, and identify areas that require remediation.
- 5.
Can IT reporting be automated?
Yes. Modern IT reporting tools can automatically collect data, generate reports, schedule report delivery, and distribute insights to stakeholders, reducing manual effort and improving accuracy.
- 6.
How does IT reporting help reduce downtime?
By identifying performance trends, recurring incidents, and potential infrastructure issues, IT reporting enables teams to take proactive measures before problems affect critical business operations.
- 7.
What trends are shaping the future of IT reporting?
Emerging trends include AI-powered reporting, real-time analytics, predictive insights, automated anomaly detection, self-service reporting, and greater integration across cloud and hybrid environments.






