Marketing Reports: Types, KPIs, Examples, and Templates
TL;DR:
Marketing reports summarize performance over a defined time period and help teams prove ROI, align stakeholders, and make better decisions. Successful marketing reporting is about delivering the right insights to the right audience at the right time.
Introduction
Marketing reports help organizations communicate campaign performance, track progress toward goals, measure ROI, and support better decision-making.
The challenge is that different stakeholders need different reporting views. A campaign performance report for a marketing manager, a lead generation report for a demand generation team, and an executive ROI report for leadership all serve different purposes and answer different questions.
For agencies, SaaS providers, and software vendors, marketing reports often extend beyond internal reporting. Many organizations deliver customer-facing reports through portals, business applications, and embedded reporting experiences.
This guide covers what marketing reports are, why they matter, the KPIs worth tracking, common report types, examples, templates, best practices, and how to create reports that deliver actionable insights. While this article focuses on creating, evaluating, and using marketing reports, our Unleash the Power of Reports in Marketing blog explores the challenges marketers face when collecting, analyzing, and communicating marketing data.
What is a marketing report?
A marketing report is a document that summarizes marketing performance over a specific time period. It brings together data from campaigns, lead generation activities, websites, and marketing channels into a format that stakeholders can easily understand and act on.
Most marketing reports include a combination of:
-
- Campaign performance and engagement metrics.
- Lead generation and qualification data.
- Conversion activity and customer journey metrics.
- Marketing ROI and revenue contribution.
- Website traffic and user behavior.
- Channel and source performance.
On their own, this is just data. A marketing report organizes them into clear visualizations that help teams evaluate performance, communicate results, and make informed decisions.
Why marketing reports matter
Marketing reports do far more than summarize campaign metrics. They provide the visibility, and accountability organizations need to improve marketing performance and align marketing initiatives with broader business objectives.
Performance visibility
Marketing reports provide a structured view of how campaigns, channels, and initiatives are performing. Without reporting, performance trends can remain hidden inside individual platforms and disconnected datasets. Reports bring information together into a single narrative that highlights successes, challenges, and opportunities.
Better decision-making
Reports help organizations replace assumptions with evidence. When teams have access to accurate performance data and context, they can make more informed decisions about campaign strategy, channel investment, content planning, audience targeting, and resource allocation.
Marketing ROI measurement
Marketing leaders are increasingly expected to demonstrate business impact. Marketing reports help connect spend, leads, conversions, pipeline influence, and revenue outcomes to clarify return on investment. This visibility supports budget planning and executive accountability.
Stakeholder alignment
Different stakeholders often view marketing performance from different perspectives. Executives focus on growth and profitability. Marketing managers focus on campaigns and channels. Reports establish a shared understanding of performance that improves alignment across teams.
Strategic planning
Historical reporting provides valuable context for forecasting and planning. By analyzing trends over time, organizations can identify growth opportunities, anticipate risks, and improve future marketing strategies based on evidence.
Customer and client transparency
Many organizations use marketing reports to communicate results directly to customers and clients. Agencies share performance reports to demonstrate value. SaaS platforms embed reporting within customer portals to provide self-service visibility into results and outcomes. In these scenarios, reports strengthen relationships and improve transparency.
Marketing reports vs. marketing dashboards
Marketing reports and marketing dashboards are often discussed together, but they serve different purposes.
| Marketing Reports | Marketing Dashboards |
| Summarize performance over a defined period of time. | Monitor performance in near real time. |
| Include insights and recommendations. | Focus primarily on metrics. |
| Often shared with stakeholders and executives. | Used primarily by operational teams. |
| Commonly exported or distributed as formal reports. | Typically accessed interactively. |
| Support planning and business decisions. | Support ongoing optimization. |
While dashboards excel at monitoring day-to-day activity, reports are better suited for communicating outcomes and supporting decision-making.
Example: A digital marketing team may use a dashboard to monitor campaigns during the month. At the end of the month, that same data is packaged into a marketing report that explains overall outcomes and recommends next steps.
Most organizations use both: dashboards for what’s happening now and reports for what already happened, why, and what to do next.
Marketing reporting benchmarks and industry statistics
Industry research shows that marketers continue to face challenges with ROI measurement, fragmented data, and reporting complexity. Effective marketing reporting helps organizations overcome these challenges by providing a consistent, reliable way to track performance, communicate results, and support decision-making.
Demonstrating ROI remains a major challenge
According to HubSpot’s State of Marketing research, 33% of marketers identify measuring ROI as one of their biggest challenges. As marketing investments grow, organizations rely on reporting to connect campaign activities to business outcomes and justify spending decisions.
Marketing data is spread across multiple systems
Salesforce’s State of Marketing report found that marketers use an average of eight marketing tools and technologies. As a result, consolidating campaign, lead, and performance data into a single report remains a common challenge.
Data silos continue to affect reporting
According to the IBM Institute for Business Value, 77% of respondents agree that data silos hinder their organization’s ability to perform real-time analytics and make data-driven decisions. As marketing data becomes increasingly distributed across platforms and tools, organizations often face challenges creating consistent, unified reports.
Marketing’s contribution to business performance is increasing
According to The CMO Survey 2026, nearly three-quarters of companies rate digital marketing’s contribution to business performance as strong. Marketing leaders are placing greater emphasis on reporting metrics such as revenue contribution, pipeline influence, customer acquisition costs, and ROI to demonstrate business impact.
Marketing technology investments are driving growth
Deloitte Digital’s 2025 Marketing Investment Trends report found that organizations investing more in marketing technology than working media see 18% greater sales lift from marketing and 7% greater revenue growth overall. Effective reporting helps organizations measure the impact of these investments and communicate results to stakeholders.
Essential marketing KPIs to track
The most effective marketing reports focus on a small set of KPIs tied to the decisions their audience needs to make. Use this table as a menu of core metrics. Select only the KPIs that match your report’s purpose.
| KPI | What it measures | Why it matters |
| Marketing ROI | Revenue generated relative to marketing spend. | Quantifies business impact and affects budget decisions. |
| Revenue contribution | Revenue influenced or generated by marketing. | Shows marketing’s direct impact on growth goals. |
| Pipeline contribution | Sales opportunities influenced by marketing. | Demonstrates impact before revenue is fully realized. |
| Customer acquisition cost (CAC) | Average cost to acquire a new customer. | Measures efficiency and long-term sustainability. |
| Cost per lead (CPL) | Cost to generate a lead from a channel or campaign. | Helps compare acquisition strategies and optimize spending. |
| Marketing qualified leads (MQLs) | Leads that meet qualification criteria. | Balances lead volume with lead quality. |
| Sales qualified leads (SQLs) | Leads ready for direct sales engagement. | Aligns marketing and sales on pipeline readiness. |
| Conversion rate | Percent of users completing a desired action. | Evaluates funnel and landing page performance. |
| Return on ad spend (ROAS) | Revenue generated per dollar of ad spend. | Critical for paid search and social media optimization and scaling. |
| Customer lifetime value (CLV) | Estimated total value of a customer relationship. | Contextualizes CAC and improves profitability decisions. |
Marketing report examples and templates
Marketing reports vary based on audience, objectives, and reporting requirements. The following examples showcase common report types used to track campaign performance, advertising effectiveness, website activity, and marketing ROI. Each report is also available as a customizable template in Bold Reports.
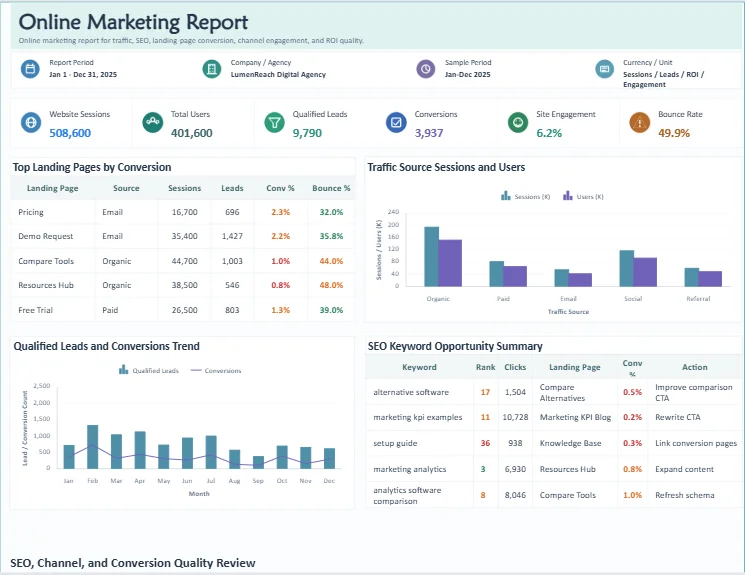
Online marketing reports
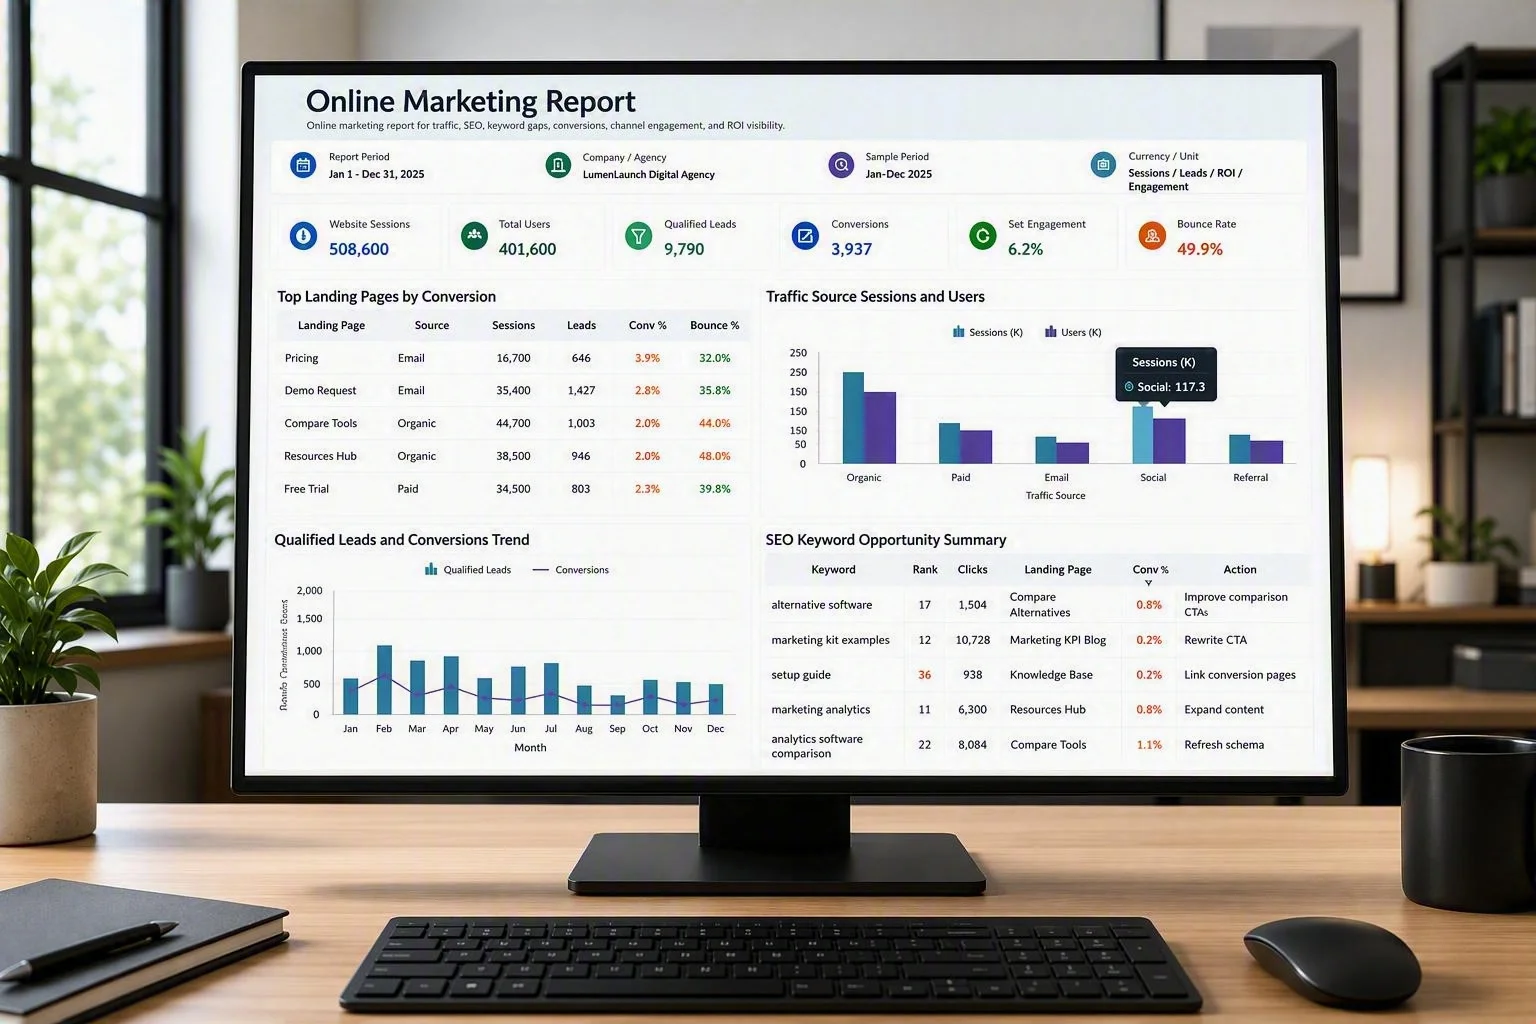
Online marketing reports provide a consolidated view of campaign performance, website activity, customer engagement, and conversion metrics across marketing channels. They help teams monitor overall marketing effectiveness, identify performance trends, and communicate results through a single reporting view.
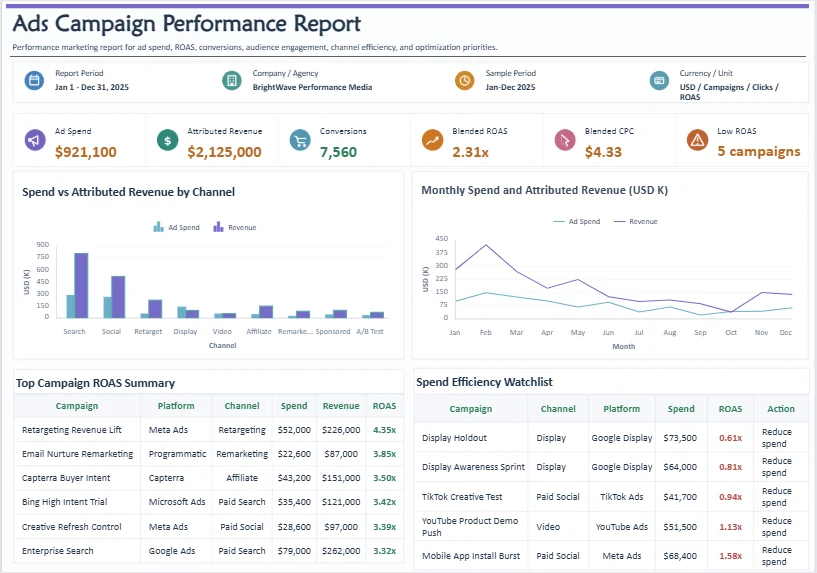
Ad campaign performance reports
Ad campaign performance reports evaluate advertising results across campaigns and platforms. Common metrics include impressions, clicks, conversions, campaign spending, and ROI, helping marketers measure campaign effectiveness, optimize budget allocation, and improve overall advertising performance.
Website analysis reports
Website analysis reports help organizations understand visitor behavior, traffic sources, engagement patterns, and conversion performance. They provide insights that support website optimization, improve user experiences, and help teams identify opportunities to increase conversions.
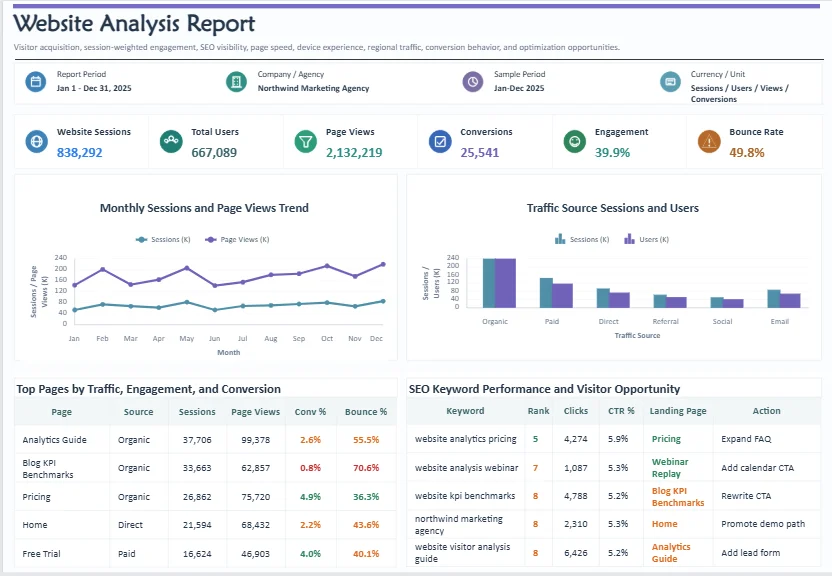
These reports are available as customizable templates in Bold Reports. Rather than building reports from the ground up, teams can use these templates as a starting point and customize them to match their KPIs, branding, reporting periods, and data sources. You can explore each template through its live demo and adapt it to your reporting requirements.
How to create a marketing report step-by-step
Follow these steps to create marketing reports that are clear, relevant, and actionable.
1. Define the audience and objective
Identify who will use the report and what decisions it should support. An executive report focused on ROI will look very different from a campaign performance report used by a marketing team.
2. Choose the reporting timeframe
Match reporting cadence to business needs. Campaign teams may need weekly reports, while executives often prefer monthly or quarterly summaries. Consistent timeframes make trend analysis easier.
3. Select the right KPIs
Choose KPIs that align with the report’s purpose. Depending on the audience, this may include ROI, CAC, pipeline contribution, MQLs/SQLs, conversion rate, or ROAS.
4. Consolidate your data sources
Marketing data often comes from multiple platforms. A centralized reporting process creates a more complete view of performance.
5. Use visualizations to highlight insights
Charts, KPI scorecards, and comparison tables make reports easier to understand. Prioritize visuals that show trends, changes over time, and performance vs. targets.
6. Add context and recommendations
Metrics alone rarely tell the full story. Explain what changed, why it changed, and what action you recommend next. Context helps stakeholders understand performance trends and make more informed decisions.
7. Automate report delivery
Scheduled report generation and distribution reduce manual effort and ensure stakeholders receive timely, consistent updates.
Marketing reporting software: What to look for
When evaluating marketing reporting software, look for:
-
- Automated scheduling and delivery for recurring stakeholder updates.
- Flexible data connectivity to unify cross-platform metrics.
- Customizable templates for different audiences.
- Self-service access for interactive viewing where appropriate.
- Role-based access controls so users only see what they should.
- Export options such as PDF, Excel, and Word for sharing and offline analysis.
- Embedded reporting for portals, SaaS apps, and customer-facing experiences.
Organizations need structured, pixel-perfect reports that can be embedded, scheduled, customized, and securely distributed across multiple audiences.
Best practices
As reporting programs mature, several themes consistently emerge:
-
- Prioritize KPI consistency: Consistent KPI definitions improve accuracy, alignment, and confidence.
- Focus on context, not just metrics: Reports create more value when they explain what changed and what action to take.
- Keep reports decision-focused: Highlight the KPIs that drive decisions instead of listing every available metric.
- Tailor reports to the audience: Executives need outcomes; operational teams need diagnostic details.
- Standardize and automate: Templates and automation improve consistency and scale.
Ultimately, successful marketing reporting is about delivering the right insights to the right audience at the right time.
Marketing reports by team and use case
The metrics included in a marketing report often depend on the team using it. While organizations may rely on the same underlying data, different stakeholders need different levels of visibility and insight:
-
- Marketing managers: Focus on campaign results, channel performance, budget utilization, and marketing ROI to evaluate overall marketing effectiveness.
- Digital marketers: Track website traffic, engagement metrics, conversion activity, and source performance across channels to identify optimization opportunities.
- Performance marketers: Monitor campaign efficiency, customer acquisition costs, conversion rates, and return on investment to improve campaign outcomes.
- Demand generation teams: Analyze lead volume, lead sources, qualification rates, and pipeline contribution to measure acquisition effectiveness and growth potential.
- Executives and stakeholders: Review high-level metrics such as revenue contribution, marketing ROI, growth trends, and business impact to support strategic planning and investment decisions.
The best marketing reports are tailored to the audience consuming them. Aligning reports with stakeholder needs improves decision-making and reporting effectiveness.
Common marketing reporting mistakes
-
- Tracking too many metrics: Including too many KPIs makes reports difficult to read. Focus on the metrics that support decisions and remove unnecessary data.
- Reporting without context: Metrics are more meaningful when compared against goals, benchmarks, or previous reporting periods. Context helps stakeholders understand whether performance is improving or declining.
- Focusing only on short-term results: Short reporting periods can hide larger trends. Review performance over time to identify meaningful patterns and opportunities.
- Using disconnected data sources: When data comes from multiple systems, inconsistent reporting can occur. Standardized reporting processes help improve accuracy and trust.
- Relying on manual reporting: Manual reporting takes time and increases the risk of errors. Automated reporting helps deliver consistent and timely performance updates.
Delivering marketing reports at scale with Bold Reports
As reporting requirements grow, organizations often need more than real-time dashboards. Executive scorecards, customer-facing reports, campaign summaries, ROI analyses, and stakeholder reports frequently require structured, shareable, and highly formatted reporting.
Bold Reports helps organizations design, generate, manage, and deliver pixel-perfect reports through flexible embedded reporting capabilities:
-
- Pixel-perfect report design for executive and customer-facing reports.
- Reusable report templates that improve reporting consistency.
- Parameterized reports for filtering by campaign, channel, region, or reporting period.
- Automated report scheduling and distribution.
- Embedded reporting for business applications and customer portals.
- Support for multiple data sources.
- Secure access controls and governance features.
By combining these features, Bold Reports helps organizations streamline reporting workflows while maintaining consistency and control.
Final thoughts
A marketing report is only effective if it reaches the right audience with the right metrics at the right time. Use this guide to determine what your report should include, then customize it to support your specific reporting goals.
Ready to put this into practice? Start a free trial of Bold Reports or explore the full marketing reporting solution to see how teams create, customize, and deliver reports for campaign performance, lead generation, website activity, and marketing ROI.
Frequently asked questions
- 1.
What is the best way to structure a marketing report?
A marketing report should follow a clear structure: executive summary, KPI overview, performance analysis, key insights, and recommendations. This helps stakeholders quickly understand results and identify the next steps.
- 2.
What metrics should executives see in a marketing report?
Executive reports should focus on business outcomes rather than operational activity. Common executive-level KPIs include revenue contribution, marketing ROI, CAC, pipeline contribution, and growth trends.
- 3.
How do you present marketing data to stakeholders?
Organize data around business objectives, use clear visualizations, and include brief insights that explain what the results mean. Stakeholders usually care more about outcomes and next steps than raw metrics.
- 4.
What makes a marketing report actionable?
An actionable marketing report goes beyond metrics by highlighting trends, explaining performance changes (with context), and recommending specific actions stakeholders can take.
- 5.
How can teams streamline recurring marketing reports?
Use reusable templates, automated scheduling, centralized report management, and standardized KPI definitions. This reduces manual work and improves consistency.