
Pixel-Perfect Reporting in 2026: 7 Reasons Enterprises Use It
TL;DR:
Pixel-perfect reporting remains essential in 2026 as a trusted, audit-ready source of truth for enterprise reporting. Unlike dashboards, it ensures precise formatting, reliable outputs across formats, and automated reporting, making it critical for regulatory compliance, operational reporting, and data-driven decision-making. Additionally, industry trends show that over 65% of enterprises prioritize consistent report formatting for audit readiness, reinforcing its importance in modern enterprise reporting and document generation workflows.
Introduction
For years, pixel-perfect reporting has been a foundational part of enterprise reporting, powering financial statements, compliance documents, and operational workflows that demand precision. In 2026, even as dashboards and AI analytics transform how businesses explore data, one challenge has become more visible: inconsistent outputs across users and formats. What one team sees isn’t always what gets reported, creating gaps in trust and decision-making.
This is where pixel-perfect reporting continues to play a critical role. Unlike dashboards, pixel-perfect reporting tools deliver a fixed, reliable version of data, ensuring reports remain consistent across PDFs, Excel, and shared outputs. This level of accuracy is essential for organizations that need audit-ready, structured reporting.
Today, enterprises operate with two needs: flexible analytics for exploration and consistent reporting for execution. Pixel-perfect reporting bridges this gap by providing controlled, consistent, and trustworthy outputs.
In this guide, you’ll learn what pixel-perfect reporting is, why enterprises still rely on it, real-world use cases, and the best pixel-perfect reporting tools available.
What is pixel-perfect reporting?
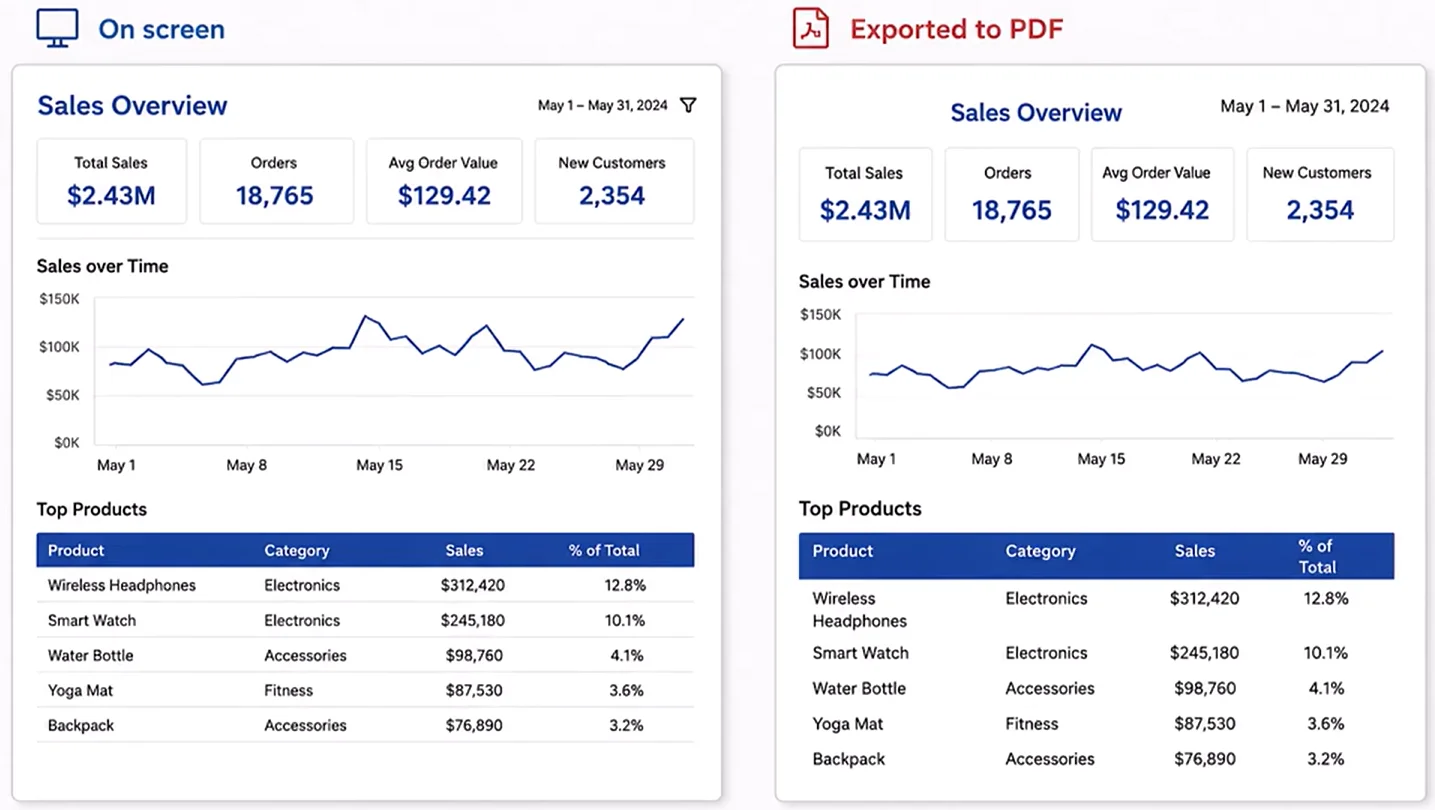
Pixel-perfect reporting refers to generating reports that appear exactly as designed, without any shifts in layout, spacing, or formatting. It ensures every chart, table, font, and visual element is rendered consistently across preview, print, and export formats. Unlike interactive dashboards, these reports are designed for structured, print-ready outputs that preserve their format across all channels.
This approach ensures:
-
- Consistent layout and formatting across all outputs
- Compliance-ready reporting for regulated industries
- Reliable paginated reports that support enterprise reporting and document generation
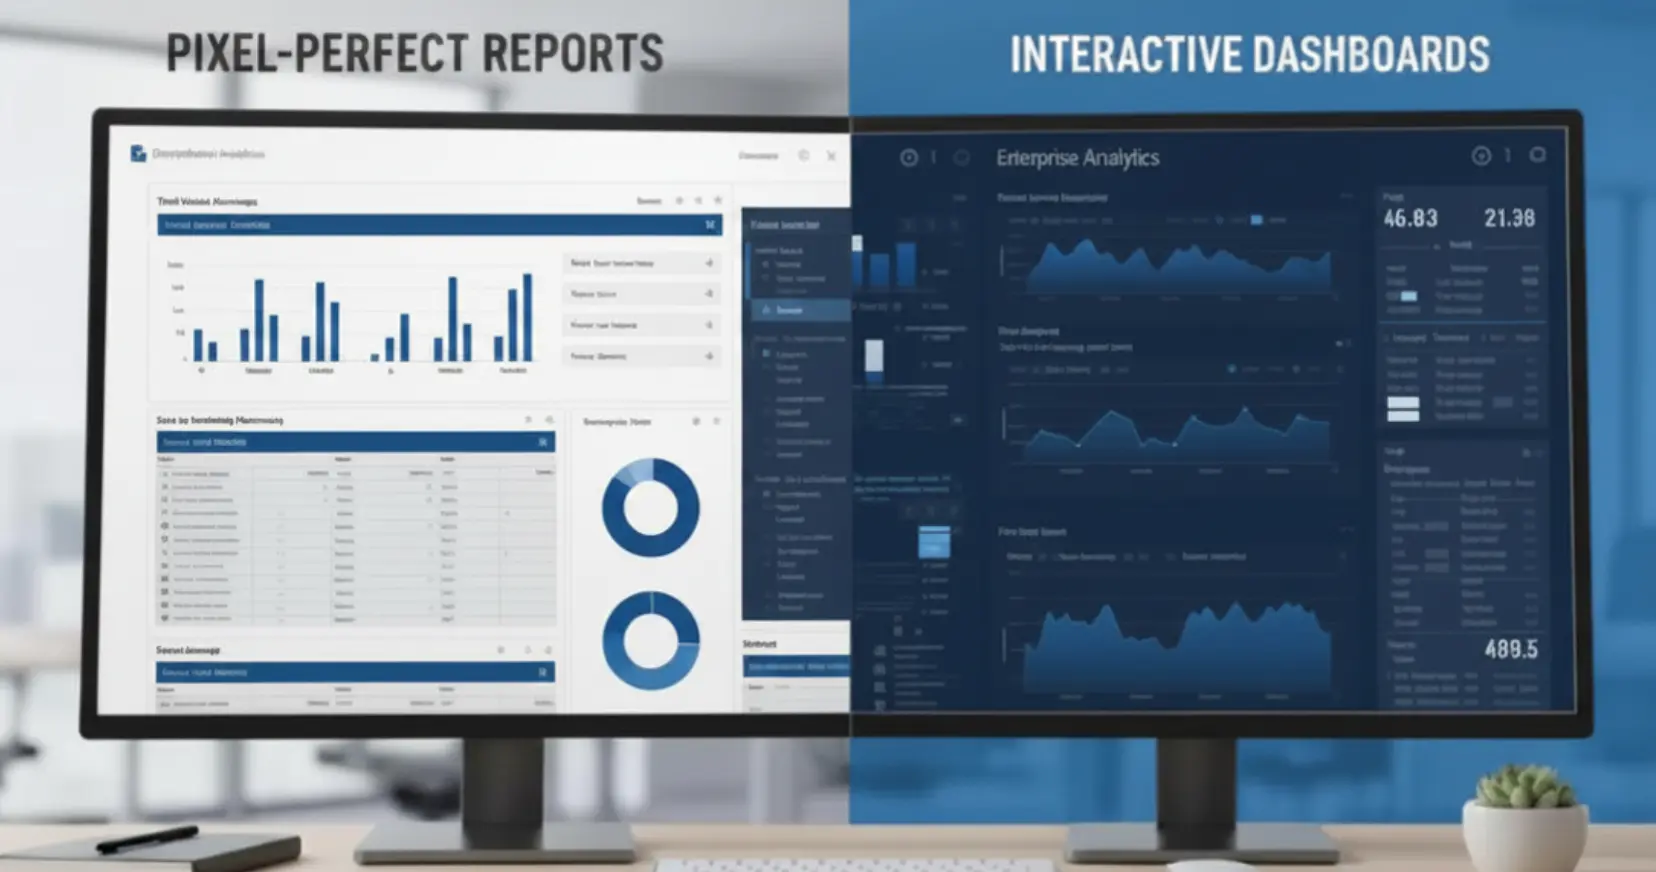
Pixel-perfect reports vs. interactive dashboards: What’s the difference?
To understand where pixel-perfect reporting fits, it’s important to compare it directly with dashboards:
| Feature | Pixel-perfect reports | Interactive dashboards |
| Core purpose | Designed to create formal, structured reports for operations, compliance, and external use
|
Built to provide real-time visibility into key metrics and trends. |
| Compliance and formatting | Ensures exact layout, formatting, and pagination for audits, financial reports, and compliance documents | Limited control over strict formatting and compliance requirements |
| Branding | Fully controlled layouts with consistent branding and professional, client-ready design | Limited control over consistent presentation across views and exports |
| Data presentation | Presents detailed data through text, tables, and visuals across multiple pages | Focuses on interactive charts, graphs, and quick visual insights |
| Business impact | Supports revenue growth through white-labelled, client-facing reports and premium reporting features | Supports internal decision-making and performance tracking |
| Interactivity | Static outputs with limited interaction to maintain consistency | Highly interactive with filters, drill-downs, and dynamic exploration |
In short, dashboards are built for exploration, while pixel-perfect reports are built for precision and accountability.
7 key reasons why enterprises use pixel-perfect reporting
Dashboards have transformed how organizations explore data, but they don’t replace the need for structured, reliable reporting.
Recent enterprise insights reveal:
-
- Nearly 70% of teams spend time fixing report exports manually
- Over 60% of SaaS platforms now embed reporting as a product feature
Enterprises still depend on consistent, presentation-ready output to support compliance, operations, and client communication.
1. Compliance and regulatory reporting require exact formatting
In regulated industries like finance and healthcare, even small inconsistencies in layout, alignment, or pagination can lead to audit failures or compliance risks.
Pixel-perfect reporting ensures:
-
- Precise layout, alignment, and pagination.
- Consistent structure across reports.
- Audit-ready outputs every time.
This reduces compliance risk and ensures reports always meet regulatory standards.
2. Dashboards are exploratory, while enterprise reports are operational
Dashboards are built for real-time analysis and exploration, but enterprise workflows depend on consistency.
Teams need:
-
- Finalized, static documents.
- Standardized output for approvals.
- Reliable records for documentation.
Pixel-perfect reporting delivers structured, unchanging outputs that decision-makers can trust.
3. Enterprises need brand-controlled and client-ready output
Customer-facing documents, such as invoices and statements, must consistently reflect your brand.
Pixel-perfect reporting gives full control over:
-
- Layout, fonts, and colors.
- Document structure and presentation.
- Consistency across all outputs.
The result is polished, professional reporting that reinforces brand credibility.
4. Enterprise workflows still depend on documents and PDFs
Despite digital transformation, documents remain central to many enterprise processes.
Poorly formatted exports can:
-
- Break workflows.
- Create manual rework.
- Delay approvals.
Pixel-perfect reporting eliminates these issues by generating reliable, print-ready outputs across PDF, Word, and Excel.
5. Global enterprises need localization and multilingual precision
Global reporting introduces challenges such as:
-
- Multiple languages.
- Regional formats (currency, date, number formats).
- Local compliance variations.
Pixel-perfect reporting preserves formatting across all variations, ensuring consistency at scale without compromising quality.
6. Manual report fixing slows enterprise teams down
Many teams still spend hours:
-
- Fixing layout issues.
- Adjusting exports.
- Rebuilding reports manually.
With pixel-perfect reporting, reusable templates, and automation, repetitive work is eliminated, freeing teams to focus on analysis instead of formatting.
7. Pixel-perfect reporting helps drive expansion revenue
In SaaS, reporting is more than an internal tool; it’s a customer-facing feature.
High-quality, structured reports enable:
-
- White-labeled client deliverables.
- Premium reporting features.
- More value in product offerings.
This creates stronger customer experiences and opens the door to upsell and expansion opportunities.
Best pixel-perfect reporting tools for enterprises
Choosing the right reporting software is critical for enterprise reporting and scalable document generation.
Pixel-perfect reporting tools comparison
| Tool | Pricing | Strength | Weakness |
| Bold Reports | Flexible (custom pricing based on deployment & users) | SSRS-compatible, pixel-perfect reporting, easy embedding for SaaS | Pricing transparency is limited (custom quote model) |
| SSRS | Licensed (part of SQL Server licensing models) | Strong SQL Server integration, reliable paginated reporting | Rigid architecture and dependency on Microsoft ecosystem |
| Telerik Reporting | Subscription (per developer/year licensing) | Strong .NET ecosystem support, custom report designer, embedded reporting with built-in designers | Limited HTML rendering and advanced interactivity support |
| SAP Crystal Reports | Licensed (one-time per user + server licenses) | Advanced formatting, reliable print-ready output, enterprise-grade reporting | Outdated UI and usability constraints |
| Stimulsoft Reports | Subscription (annual, per developer licensing) | Cross-platform support (.NET, JS), flexible report design
|
Licensing complexity and steep learning curve |
| JasperReports | Subscription + free open-source edition | Highly customizable, open-source flexibility
|
Strong dependency on Java + complex technical setup |
1. Bold Reports
Bold Reports® is an enterprise-grade pixel-perfect reporting solution designed for precise formatting, SSRS-compatible reporting, and seamless embedding. It enables teams to design, manage, and deliver highly formatted, audit-ready reports at scale, making it ideal for SaaS platforms and data-driven enterprises.
Best for:
-
- SaaS platforms and enterprises.
- Embedded reporting.
- Data-driven applications.
Start your 30-day free trial to create and deliver pixel-perfect reports inside your applications without manual effort.
2. Microsoft SQL Server Reporting Services (SSRS)
SSRS is a server-based reporting platform from Microsoft used to create, deploy, and manage paginated reports. It allows organizations to generate structured, print-ready reports from SQL databases and other data sources and deliver them via web, email, or applications.
Best for:
-
- Microsoft-centric enterprises.
- Legacy operational environment.
3. Telerik reporting
Telerik Reporting is a .NET-based embedded reporting solution designed for web and desktop applications. It allows developers and business users to create, view, and export reports directly within applications using integrated report viewers and design tools.
Best for:
-
- .NET developers.
- Embedded reporting scenarios.
- Enterprise app integration
4. SAP Crystal Reports
SAP Crystal Reports is a business intelligence reporting tool used to create highly formatted, pixel-perfect reports from a wide range of data sources, including databases, spreadsheets, and enterprise systems.
Best for:
-
- Traditional enterprise environments.
- SAP-based ecosystems.
- Operational reporting workflow.
5. Stimulsoft Reports
Stimulsoft Reports is a reporting tool designed to create, manage, and deliver reports across web, desktop, and mobile applications. It supports multiple development environments, including .NET and JavaScript, making it a flexible choice for enterprise and SaaS reporting.
Best for:
-
- Cross-platform development teams.
- Enterprise and SaaS solutions.
- Embedded reporting in applications.
6. Jasper Reports
Jasper Reports is a widely used open-source reporting engine designed for Java-based enterprise environments. It enables pixel-perfect report generation with extensive customization and integration support.
Best for:
-
- Java environments.
- Custom reporting implementations.
Key features enterprises look for in pixel-perfect reporting tools
Enterprises evaluating report generation tools and reporting software prioritize:
- Precise layout and design control: The tool must offer full control over report design, ensuring fixed layouts and precise alignment. Without this, reports can shift across formats, leading to inconsistencies and rework.
- Multiformat export reliability: Reports should export seamlessly to PDF, Excel, and Word without breaking structure or formatting. Poor export support can result in misaligned data, missing elements, and manual corrections.
- Scalability and performance: The solution must efficiently handle large datasets and high-volume report generation. Poor scalability can result in slow processing and operational delays.
- Integration capabilities: The tool must seamlessly integrate with existing systems, databases, and applications for efficient data flow. Limited integration creates data silos, duplication, and workflow inefficiencies.
- Enterprise-grade security: The platform must deliver robust data protection through encryption, role-based access control, and comprehensive audit trails. Strong governance ensures secure data management, enforces compliance, and maintains accountability. Without it, enterprises risk breaches, penalties, and loss of stakeholder trust.
Industries that depend heavily on pixel-perfect reporting
These use cases highlight how enterprise teams rely on structured reports to ensure accuracy, clarity, and professional presentation.
1. Financial industry
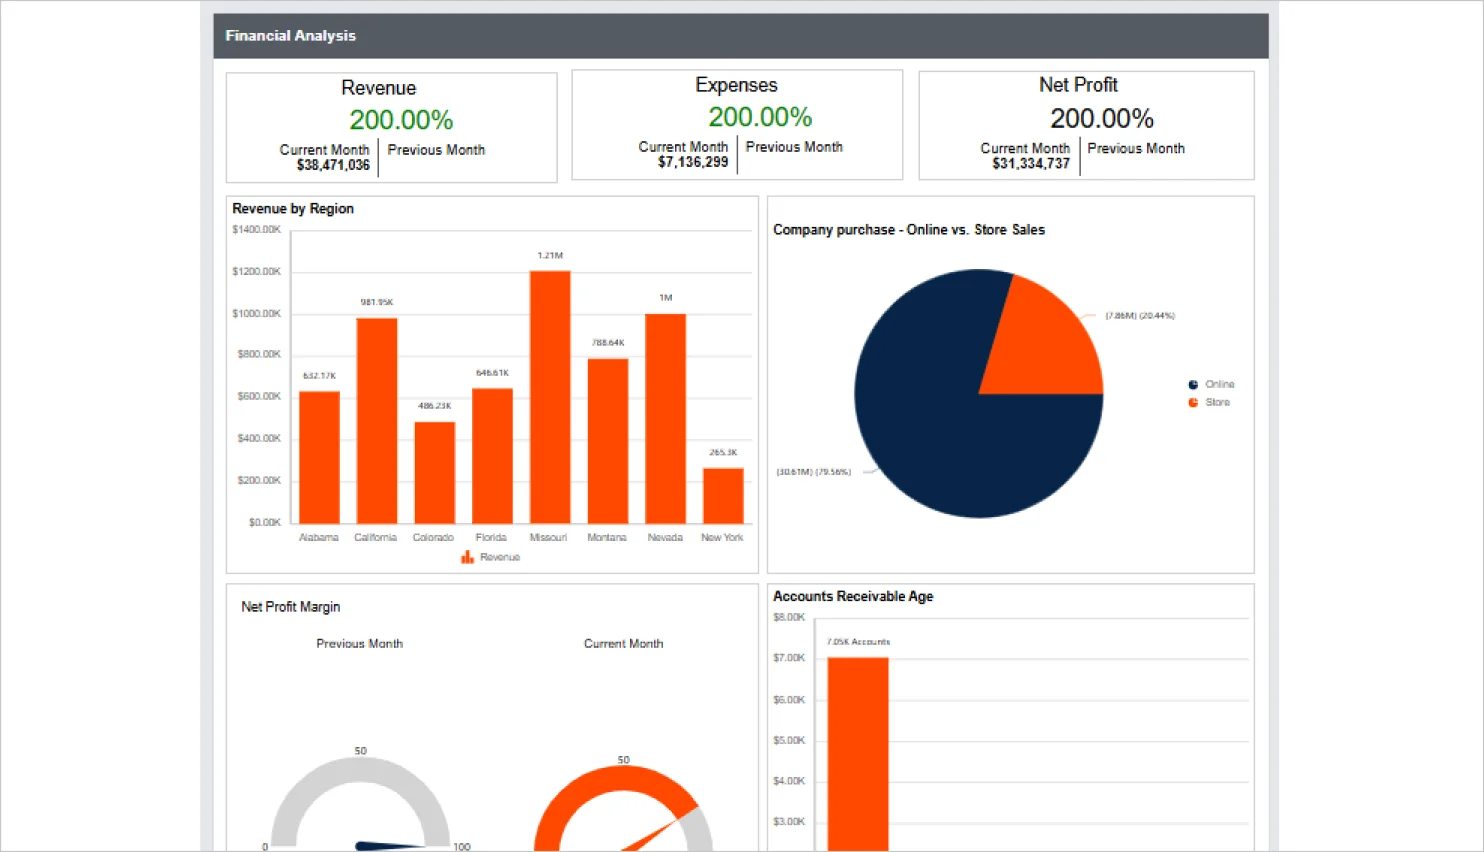
Finance operates in compliance-driven environments where fragmented data and inconsistent reports can lead to errors, audit delays, and increased risk. Standardized reporting ensures that financial metrics such as revenue, expenses, and profit remain accurate and consistent.
With pixel-perfect reporting, finance teams can:
-
- Maintain audit-ready reports with standardized formatting.
- Deliver accurate output for compliance and disclosures.
- Ensure precision across financial statements.
This strengthens compliance, improves audit readiness, and ensures confident financial decision-making.
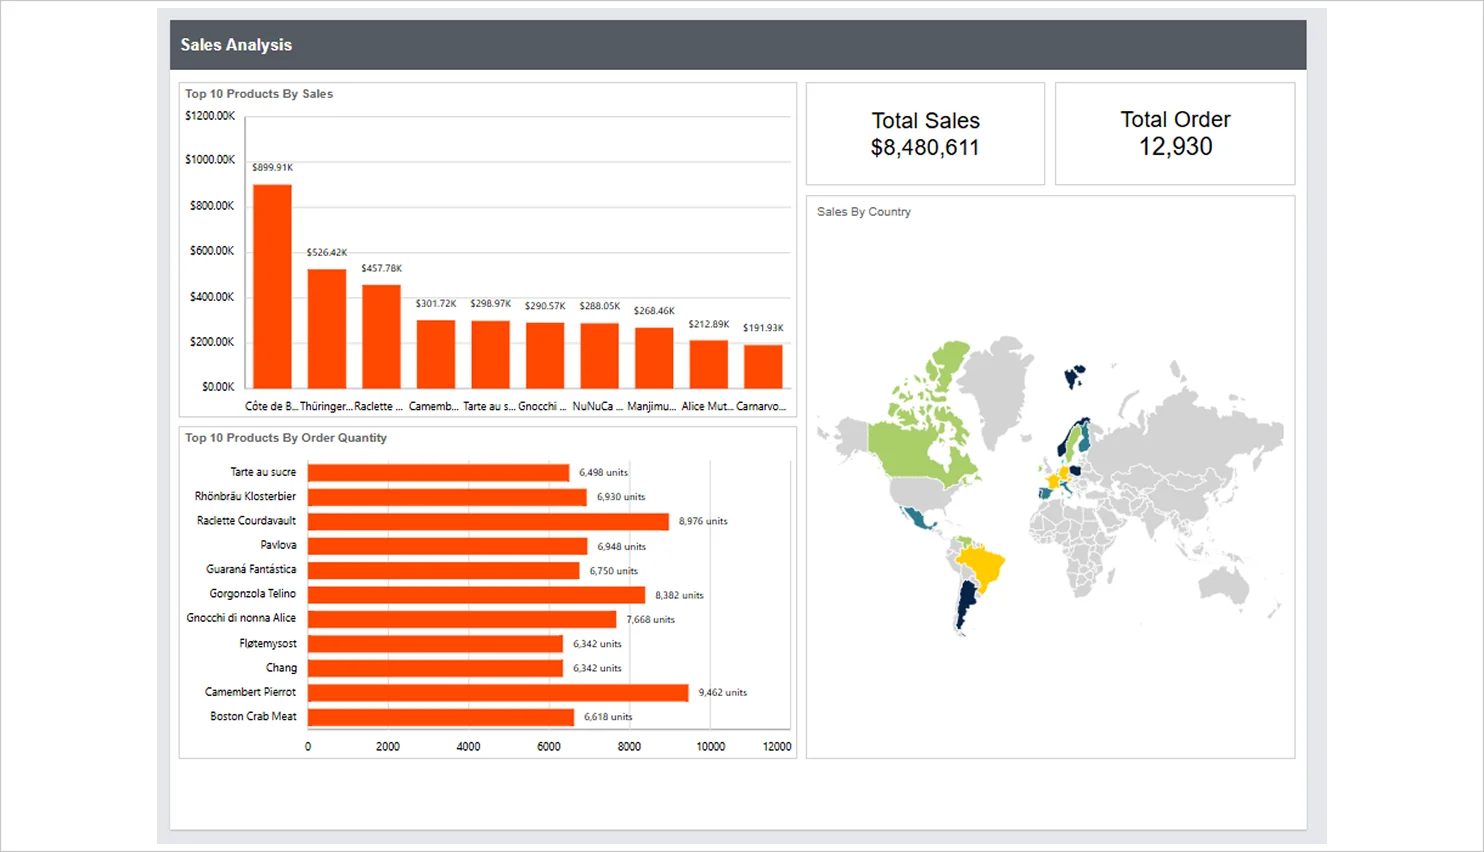
2. Sales industry
Sales teams need a clear view of performance across products, regions, and time periods. When data is scattered, identifying trends and making timely decisions becomes difficult. Structuring key metrics into unified reports simplifies comparison and improves clarity.
With pixel-perfect reporting, sales operations can:
-
- Consolidate revenue, pipeline, and conversion data into unified reports.
- Track performance consistently across regions and product lines.
- Standardize reporting for forecasting and reviews.
This improves performance visibility, accelerates decision-making, and uncovers new opportunities for growth.
3. Marketing industry
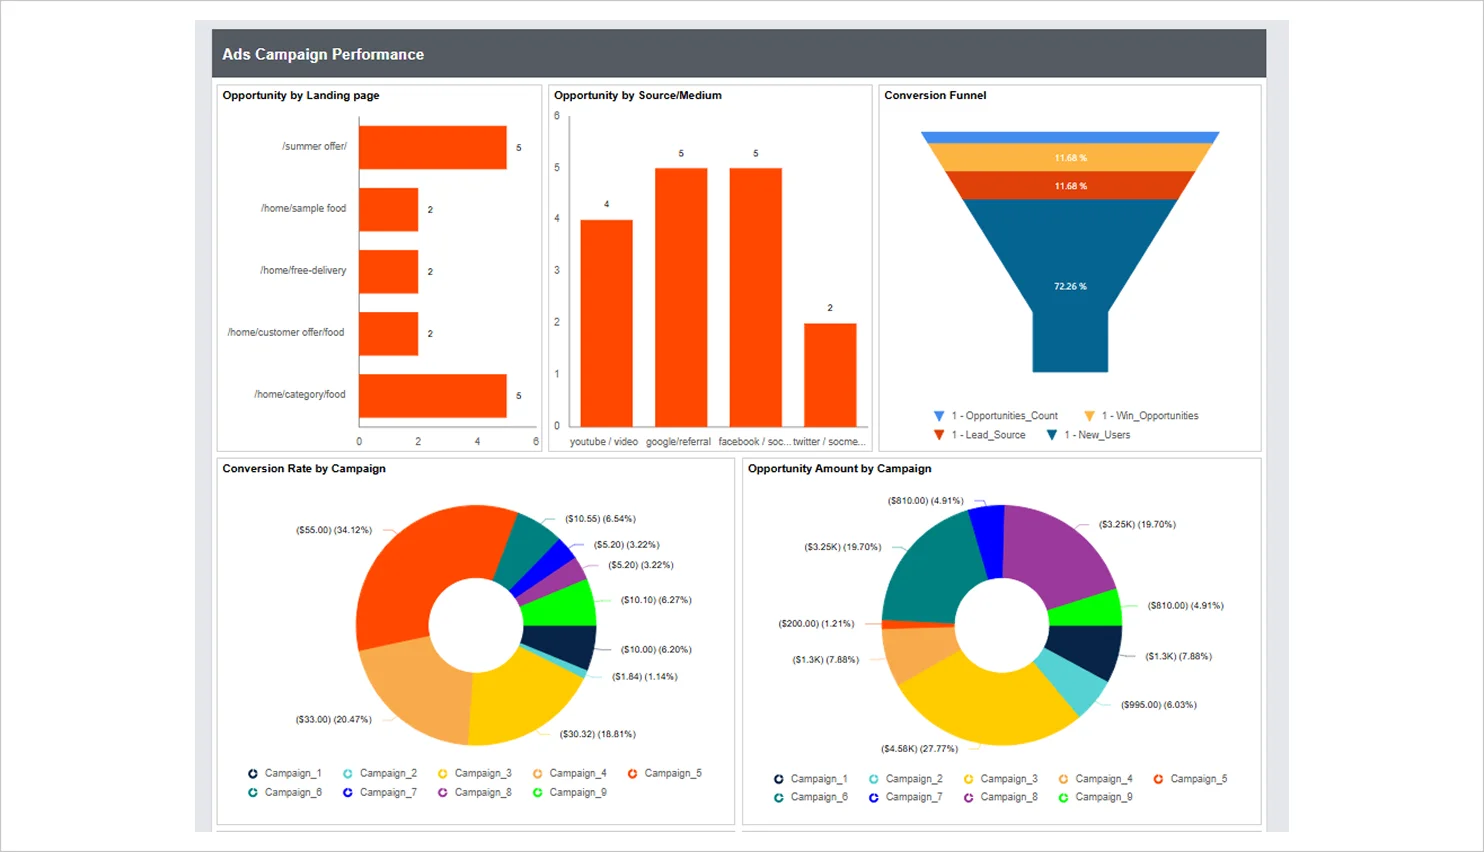
Marketing requires accurate and consistent insights to evaluate campaign performance across channels and reporting periods. Disconnected data and inconsistent formats create gaps in analysis and slow optimization. Consolidating campaign data into structured reports creates a unified, easy-to-interpret view.
With pixel-perfect reporting, marketing operations can:
-
- Combine multi-channel campaign data into unified reports.
- Track key metrics such as conversions, cost per lead, and ROI consistently.
- Present performance insights in clear, professional formats.
This enhances reporting clarity, reduces inconsistencies, and enables faster campaign optimization.
4. Education industry
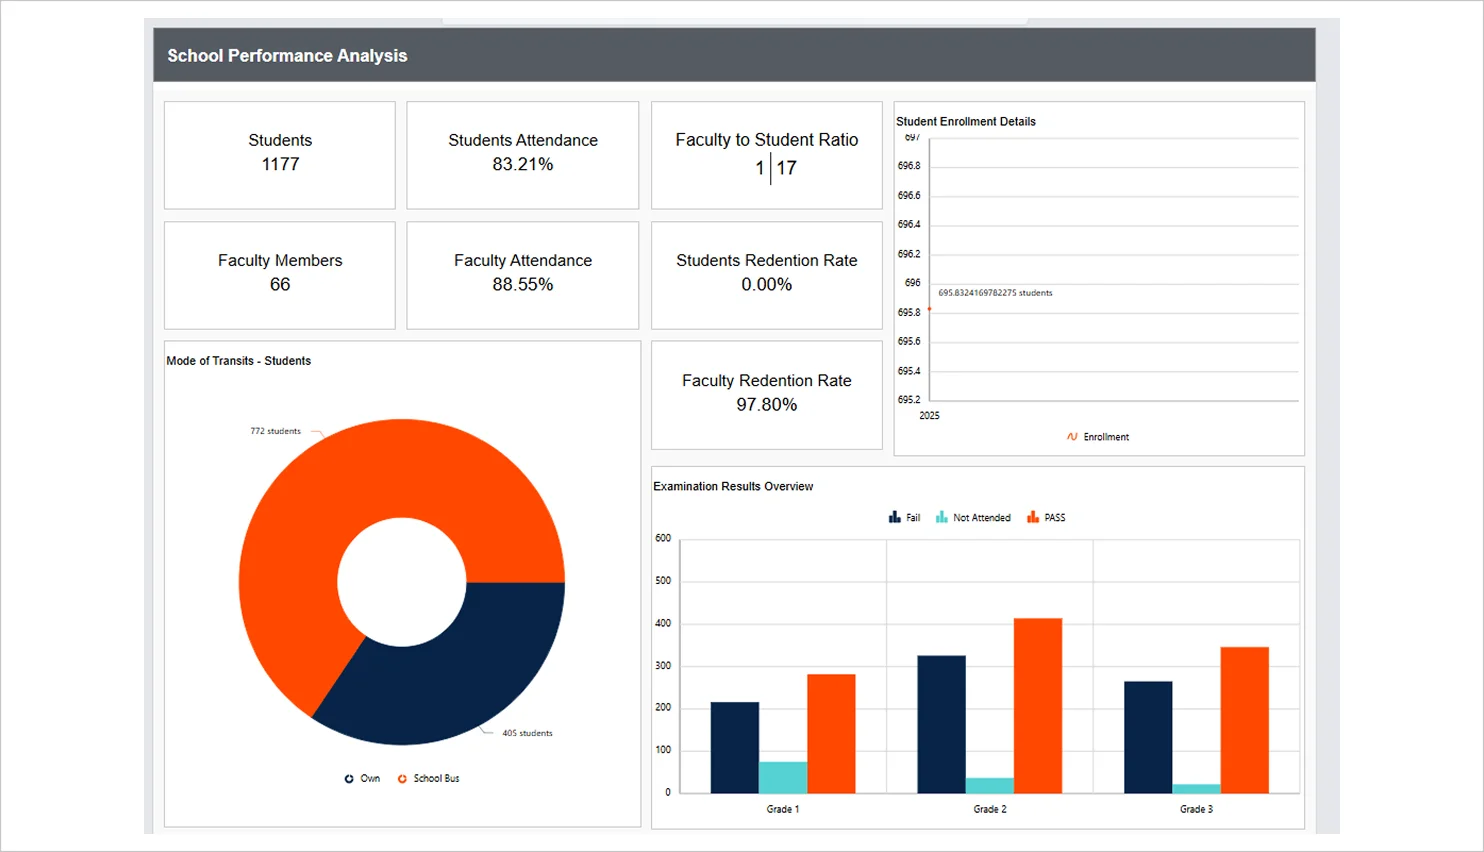
Educational institutions depend on accurate, consistent data to track performance and outcomes. When data is fragmented across departments, it causes inconsistencies and delays. Standardized reporting improves clarity and simplifies analysis across terms and departments.
With pixel-perfect reporting, institutions can:
-
- Consolidate academic and administrative data into standardized reports.
- Track attendance, performance, and outcomes consistently.
- Produce uniform reports for evaluations and accreditation.
This improves reporting accuracy and supports more effective academic planning and decision-making.
5. Entertainment industry
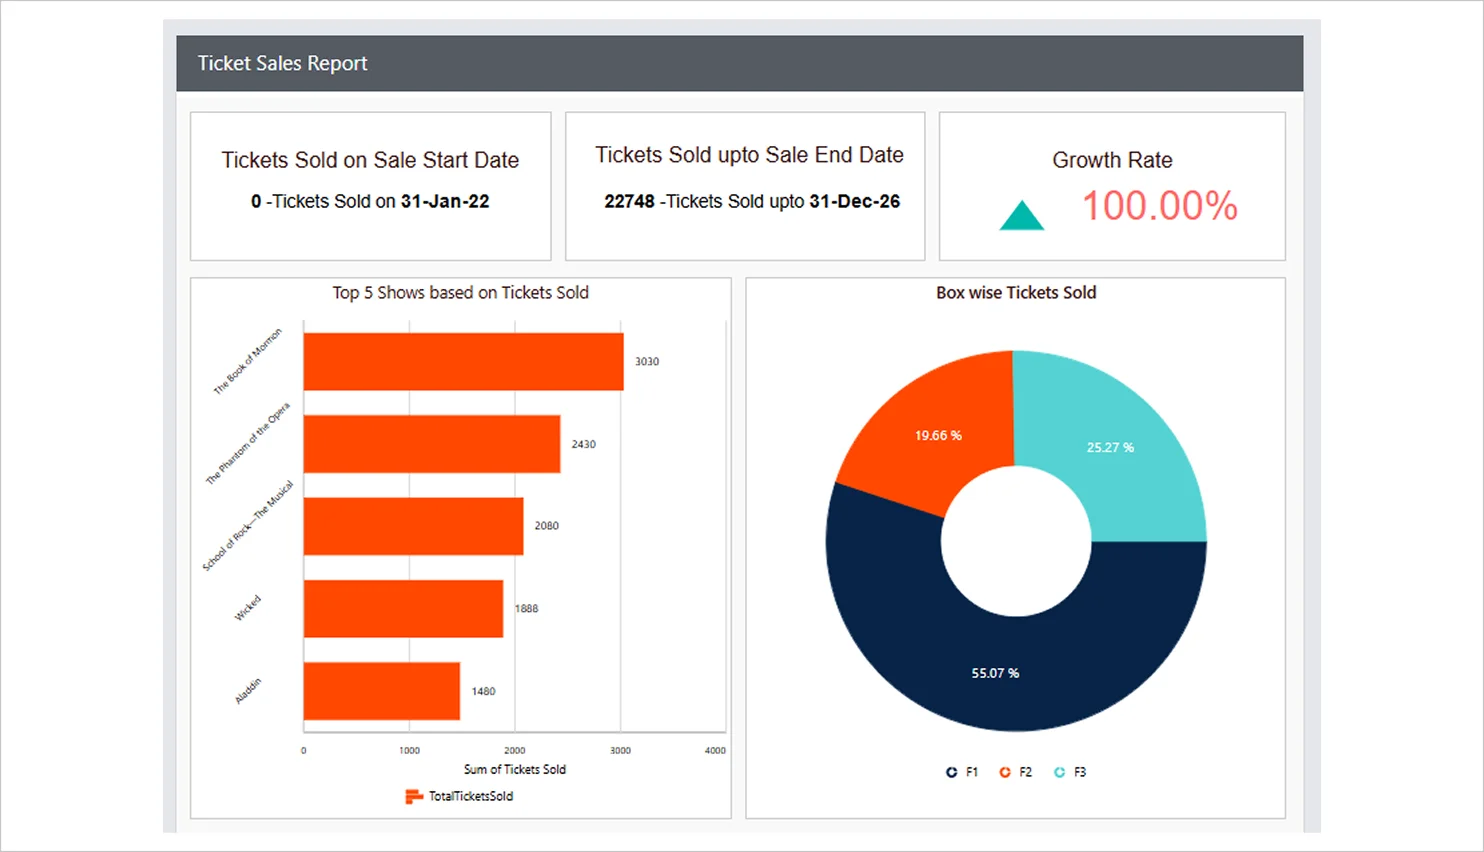
Entertainment organizations track performance across events, platforms, and audiences. When data is scattered, visibility drops, and analysis becomes difficult. Consolidating it into consistent reports improves clarity and trend analysis.
With pixel-perfect reporting, organizations can:
-
- Combine ticket sales, engagement, and revenue.
- Track performance across events and time.
- Standardize reporting for planning and forecasting.
This improves visibility into performance, streamlines reporting processes, and supports more informed planning and revenue optimization.
Why Bold Reports is built for enterprise pixel-perfect reporting
Bold Reports enables enterprise reporting, embedded reporting, and scalable document generation with high precision. Key capabilities include:
- RDL support with simplified migration: Native compatibility with RDL files enables teams to reuse existing SSRS reports, minimizing redevelopment efforts and accelerating the transition from legacy reporting systems.
- True pixel-perfect rendering: Ensures reports maintain exact layout, formatting, and alignment across preview, print, and export formats without inconsistencies, delivering consistent, reliable, and presentation-ready outputs.
- Compliance-ready reporting: Supports secure, standardized report generation with role-based access and consistent formatting, helping enterprises meet regulatory and audit requirements.
- Embedded reporting: Enables seamless integration of reports into applications, delivering in-app reporting experiences within existing workflows.
- Developer-first extensibility: Offers robust APIs and SDKs for customization, automation, and scalable report integration across enterprise applications.
- Flexible licensing model: Supports scalable pricing based on deployment requirements, reducing costs tied to fixed per-user licensing.
- Automation and scheduling: Enables automatic report generation and distribution, reducing manual effort.
Final thoughts
As organizations scale, the need for paginated reports, enterprise reporting systems, and reliable document generation tools continues to grow. Pixel-perfect reporting remains essential for bridging analytics and execution. In industries where formatting precision is critical, even minor inconsistencies can disrupt workflows, delay approvals, and reduce trust in reported data.
While dashboards support exploration, they cannot replace structured reporting for audits, official documents, and client communication. Pixel-perfect reporting ensures consistent formatting, reliable data presentation, and seamless delivery across formats like PDF, Excel, and Word.
By reducing manual effort and standardizing report generation, organizations improve efficiency, maintain accuracy, and scale reporting with confidence. Bold Reports enables enterprises to deliver consistent, high-quality output.
Start a 30-day free trial or request a demo to create pixel-perfect reports in minutes and eliminate reporting inconsistencies with accurate, audit-ready output at scale.
Frequently asked questions
- 1.
What is pixel-perfect reporting in Bold Reports?
Pixel-perfect reporting in Bold Reports refers to creating paginated reports with precise layout and formatting, ensuring every element appears exactly as designed for printing or exporting.
- 2.
What is paginated reporting?
Paginated reporting refers to multipage, fixed-layout reports optimized for printing and structured output.
- 3.
What is the difference between pixel-perfect reporting and operational reporting?
Pixel-perfect reporting focuses on precise layout and formatting, while operational reporting focuses on workflows and performance tracking.
- 4.
Do pixel-perfect reports support large datasets?
Yes, they are designed to handle large and complex datasets while maintaining layout integrity across multiple pages.
- 5.
Can pixel-perfect reports be scheduled and automated?
Yes, reports can be automatically generated and delivered on a schedule, ensuring consistency without manual effort.
- 6.
Is it possible to preview the print layout before exporting?
Yes, you can preview the report layout directly in the designer to ensure everything appears correctly before exporting or sharing.
- 7.
Can I control page breaks and print layout?
Absolutely. Bold reports gives you full control over page breaks, margins, and layout settings making it easy to create clean, structured, and print-ready reports.






