
Webinar Notes: Embedding Reports in React Applications
TL;DR:
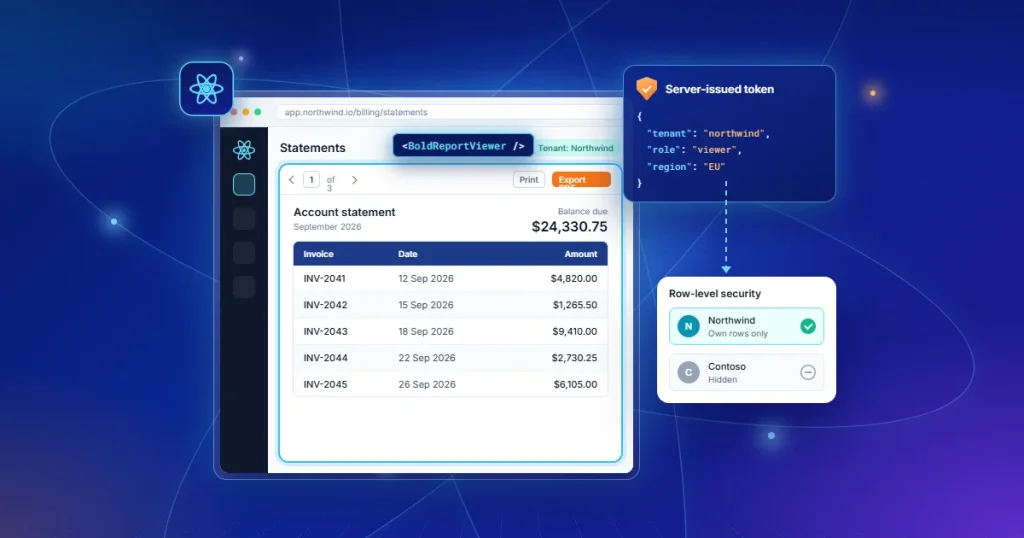
Embedding reports in React works best when the browser only renders and your backend decides what each user may see. This recap shows how a React app hosts the Bold Reports viewer and designer, and how a server-issued token carries report parameters and tenant attributes so each customer sees only their own rows.
Introduction
Almost every application eventually needs a report: an invoice, a statement, a shipping manifest. Users expect these documents to be structured, printable, and exportable, and they expect them inside the app they already use.
In our recent webinar, “Embedding Reports in React Apps: Deep Dive into Integration & Customization,” Sanmati M, a software engineer at Bold Reports® who works with customers and developers on embedded reporting, covered the architecture behind that expectation and then built it live. Sanmati scaffolded a React app, added the report viewer and designer, and moved on to a row-level security demo for two tenants.
The session was pitched at React and front-end developers, backend and full-stack engineers, solution architects, SaaS product owners, business analysts, and support teams. These notes cover the reasoning, the setup steps, and the security model, so you can apply them to your own project.
Session timestamps
-
- [00:00] Welcome and speaker introduction
- [01:17] Who reporting serves and the session roadmap
- [02:23] Why reporting still matters next to dashboards
- [03:39] The hidden cost of building reporting yourself
- [04:25] Common reporting use cases
- [05:40] Build or buy a reporting platform
- [06:10] How a report request flows through the stack
- [07:18] The platform used in the demo
- [08:12] Live demo: scaffolding the React app
- [12:09] Adding the viewer and designer components
- [15:09] Why security belongs on the server
- [16:39] Secure token generation
- [17:56] Row-level security demo with two tenants
- [18:53] Custom attributes on a Bold Reports site
You can watch the full webinar recording on YouTube, embedded below. Use the timestamps above to jump to the section you need.
Paginated reports still matter next to dashboards
A dashboard shows what is happening right now, while a paginated report is a document you can save, export, print, or submit for compliance. Sanmati opened with this distinction because it explains why reporting remains a core requirement even in apps that already have live charts.
| Dashboards | Paginated reports | |
| Main job | Real-time summary, screen-first, good for a glance | Exact page layout, identical on screen, in PDF, and on paper |
| Typical output | A live view to explore | Exportable reports, printable documents, compliance filings, executive summaries |
| Moment of use | Checking what is happening now | Closing a quarter, filing a record, shipping an order |
The examples in the session were concrete. A finance team cannot close a quarter with a dashboard screenshot. Healthcare organizations need patient reports, logistics companies need shipping manifests, and retailers need an invoice for every transaction.
Four reporting use cases keep showing up in embedded apps
The session grouped reporting needs into four patterns because the requirements for an invoice differ from those of a self-service builder:
-
- Embedded reporting: invoices, receipts, and statement views inside the application.
- Self-service reporting: an authorized drag-and-drop builder in the browser, so users design their own reports instead of waiting on developers.
- Operational reporting: inventory sheets, warehouse manifests, and daily logs.
- Regulatory and multi-tenant reporting: isolated data per customer, with per-tenant branding.
Sanmati concluded that reporting is no longer a nice-to-have. For many applications, it is a core business requirement, which raises the build-or-buy question.
Building a reporting engine costs more than it looks
A first version looks easy: a few tables on a page, a print button, a PDF export. The cost arrives later, and the webinar listed where it comes from:
-
- Layout complexity: nesting, dynamic tables, and running totals.
- Cross-browser printing: inconsistent page breaks and formatting.
- Multiple export formats: Excel formulas and PDF embedded fonts.
- Performance at scale: paging and virtualization for large datasets.
- Framework maintenance: version upgrades and re-coding when the front end changes.
The last item is easy to underestimate. If your company moves from React to Angular, how much of the reporting code has to be rewritten? Sanmati framed these as the hidden costs that turn a simple feature into a long-term maintenance project.
The session then set the two routes side by side:
| Factor | Build a custom engine | Buy a reporting platform |
| Starting point | Export pipelines and print rules built from zero | Viewer and designer deploy on day one |
| Output formats | You build PDF, Excel, and print output yourself | PDF, Excel, and print output out of the box |
| Scaling and rendering | You own paging and page rendering | Handled by the vendor |
| Ongoing effort | High developer effort for maintenance | Developers stay on core features |
| Control | Full code-level control over rendering and layout | Rendering follows the platform’s engine and report format |
Building fits teams that need full control over every rendering detail and can fund its upkeep. Buying fits teams that would rather spend that engineering time on their core product.
A report request passes through five stages before it renders
Sanmati followed one click on a sales report from start to finish. Each of the five stages has a single responsibility:
- User: requests a report from the interface.
- React application: renders the viewer. It holds no secrets and has no database access.
- Backend API: acts as the security checkpoint. It validates the user and issues the token.
- Reporting service: handles layout, pagination, and export generation.
- Database: returns only the rows the token permits.
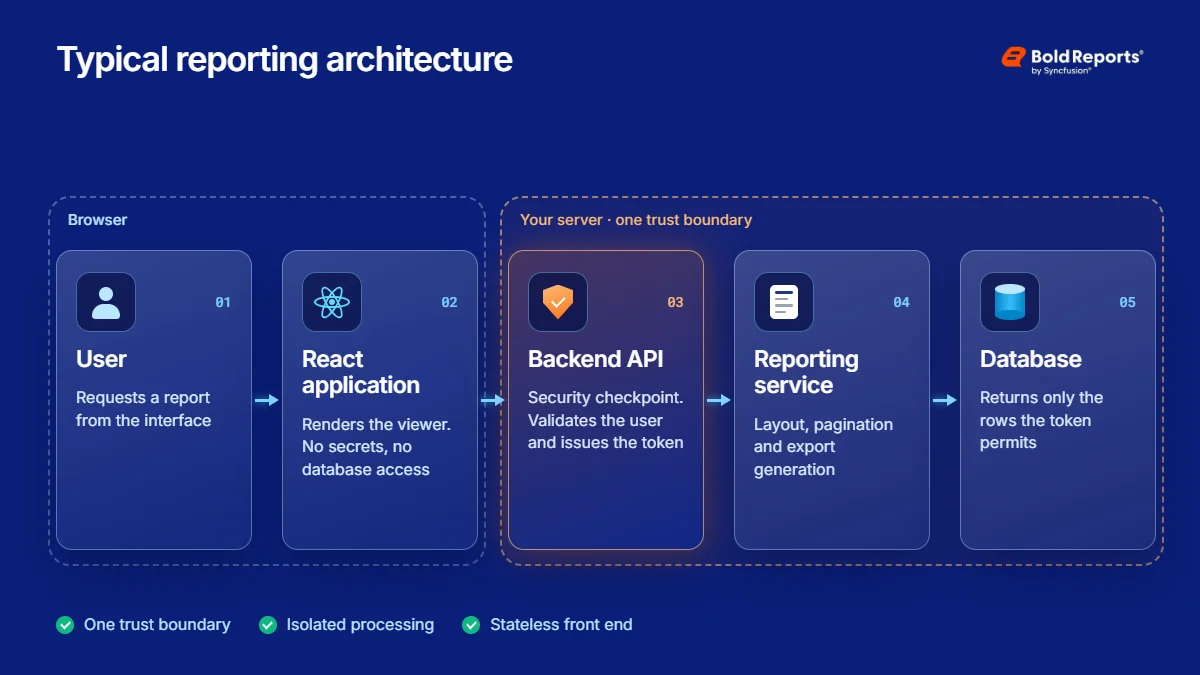
Three properties follow from this design:
-
- One trust boundary: every report request passes through your own API first.
- Isolated processing: a 500-page export cannot slow down the main application.
- Stateless front end: React ships screens, not credentials.
The session’s architecture slide adds the surrounding picture. The reporting platform sits between the data sources (the slide shows PostgreSQL, Oracle, MySQL, MongoDB, Snowflake, and CSV or files) and the places reports are consumed: embedded applications, customer portals, internal business platforms, and exported reports. That separation is what makes the system secure, scalable, and maintainable.
The standard RDL format keeps report definitions portable
The demo ran on Bold Reports, an embedded reporting platform that includes a report viewer and designer, export functionality, authentication support, React integration, and multi-tenant support. It can run on-premises or in the cloud.
Sanmati stressed the file format. Bold Reports stores reports in the standard RDL format, so a report definition is not locked into a proprietary format and stays portable to any tool that reads the standard. RDL is an XML file format, documented in Microsoft’s MS-RDL specification. Sanmati also noted that many of the architecture principles in the session apply regardless of platform.
How do you scaffold a React app for the Bold Reports components?
Sanmati asked attendees to follow the overall workflow rather than every line of code, since the commands and snippets are shared in the documentation. The demo took five steps:
- Install the tooling and create the app. The demo installed Create React App globally and generated an app named reports.
- Add the class helper. From the reports folder, install create-react-class.
- Add the Bold Reports package. Without it, the React application cannot communicate with Bold Reports.
- Expose jQuery globally. Bold Reports needs a jQuery object, so the demo created a globals.js file in src and imported it at the top of index.js.
- Create two component files. One file holds the viewer, and the other holds the designer.
npm install create-react-app -g create-react-app reports cd reports npm install create-react-class --save npm install @boldreports/react-reporting-components@latest |
The globals.js file registers React and jQuery on the window object:
import jquery from 'jquery'; import React from 'react'; import createReactClass from 'create-react-class'; import ReactDOM from 'react-dom'; window.React = React; window.createReactClass = createReactClass; window.ReactDOM = ReactDOM; window.$ = window.jQuery = jquery; |
For a written walkthrough of the same setup, see How to Embed RDL Reports in a React App. One note on tooling: the terminal in the recording prints a deprecation notice for create-react-app, and the React team lists current starting points at react.dev. Check the Bold Reports React documentation for the setup that matches your build tool.
Which properties does the React report viewer need?
The viewer needs four properties. Sanmati added the BoldReportViewerComponent tag to viewer.js, after the script and style imports that the Bold Reports package requires:
<BoldReportViewerComponent

  id="reportviewer"

  reportServiceUrl={serviceUrl}

  reportServerUrl={serverUrl}

  serviceAuthorizationToken={token}

  reportPath="/Samples/Sales.rdl"

/>
|
-
- reportServiceUrl: the URL of the backend processing API.
- reportServerUrl: where the report files are stored.
- serviceAuthorizationToken: a bearer token that proves the user may see the report, issued by your own backend.
- reportPath: which report to load, as a path inside the report server.
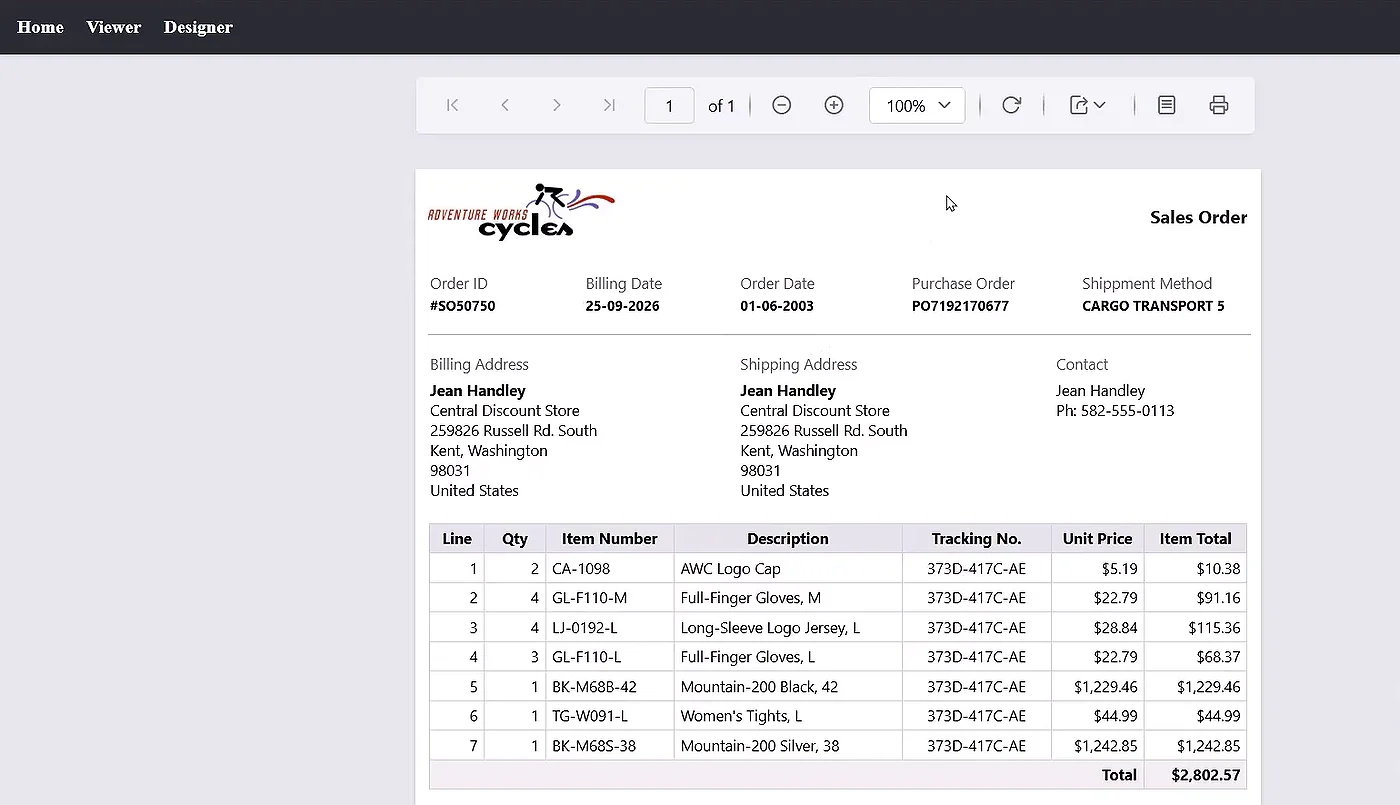
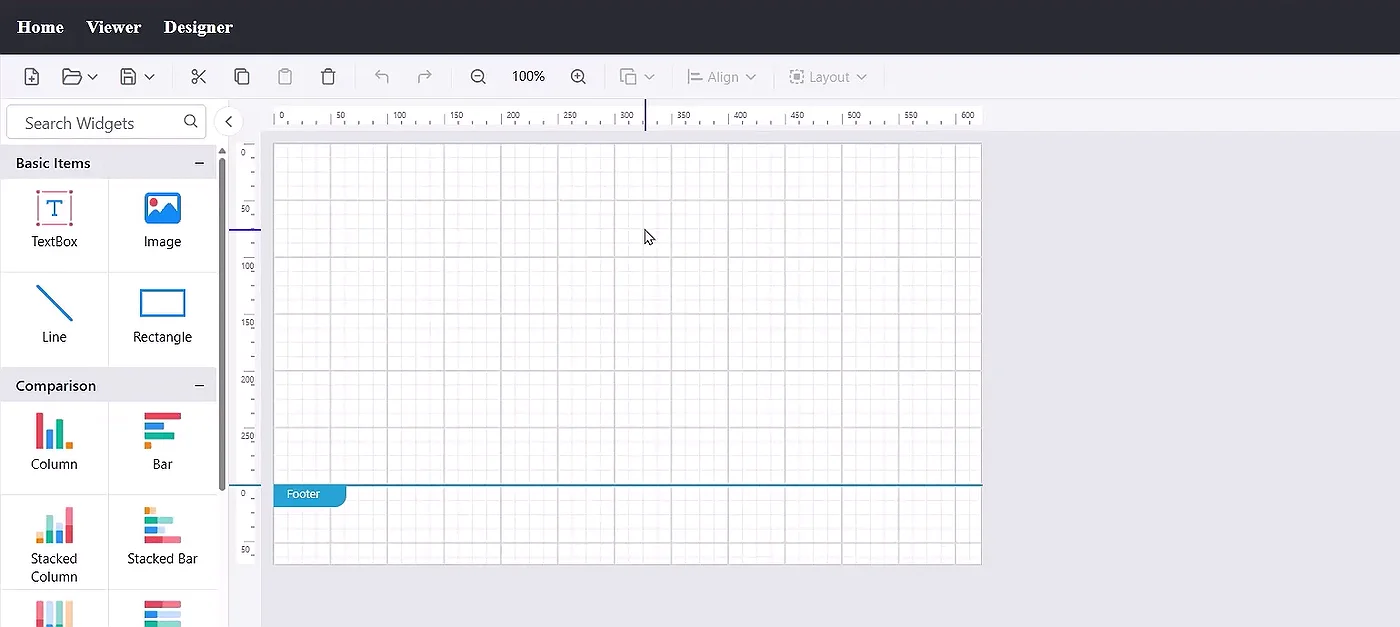
The designer follows the same pattern. Swap in BoldReportDesignerComponent with the same connection details, a service URL, a server URL, and a service authorization token, and your users can author layouts in the browser. After npm start, the demo app showed a small navigation menu with Home, Viewer, and Designer links. The viewer rendered the report at the configured path, and the designer loaded as well. The report viewer tutorial and the report designer tutorial walk through each component in more detail.
Report security belongs on the server
Reports often carry financial records, customer data, healthcare information, or employee details. A common mistake is to assume the browser can enforce access rules. Anything enforced in the browser can be edited there, so your backend must decide permissions, parameters, and tenant mapping before a report renders.
The session defined five server-side requirements:
- Authentication: who the user is, verified with secure login tokens.
- Authorization: what the user may see, checked on every report request.
- Tenant isolation: Client A can never reach Client B’s data.
- Row-level security: filters are injected on the server and never accepted from the client.
- Secure API communication: server-to-server calls carry the report credentials.
How does secure token generation carry permissions to the report?
The webinar’s answer is a server-issued token. When a user opens a report, the React app asks your backend API for a report session. The backend validates the user’s identity and permissions, calls the token endpoint server-to-server, and returns an encrypted token. The browser receives only an opaque string, so the user cannot read or change what is inside it.
Three things travel inside or alongside that token:
-
- ReportParameters: filters set on the server, locked inside the token, so the browser can neither read nor rewrite them.
- CustomAttributes: tenant identity that travels with the request. Values such as a tenant ID, company ID, region, or user role are injected into queries at render time, and the slide’s example is a TenantSchema value.
- reportDesignerSettings: data panels frozen for designers. Users format and lay out reports freely while connection strings stay read-only.
In Sanmati’s words, the token becomes the secure channel that carries user permission, report filters, and tenant information from the backend to the reporting service. The Bold Reports documentation describes the embedToken property as a token configured with user details, custom attributes, and report parameters, used instead of a service authorization token. See the report viewer API reference and the Embed Secret Key API guide for details, and our earlier webinar notes on embedding reports securely for the wider set of embedding options.
How does row-level security work for two tenants in Bold Reports?
The row-level security demo used two customers, Alpha Corp and Beta Solution, running the same report against their own data. The goal was that two different companies using one report definition each get their relevant records.
The setup started in the Bold Reports site administration:
- Open the Manage Sites In the demo, the ACME CRM site belongs to Alpha Corp.
- Open the site and select the Attributes
- Add a custom attribute that holds the tenant’s database name. On the demo site, a DatabaseName attribute carries the value crm_alphacorp.
- Reference that custom attribute in the database connection string, so the report connects to the database that matches the tenant.
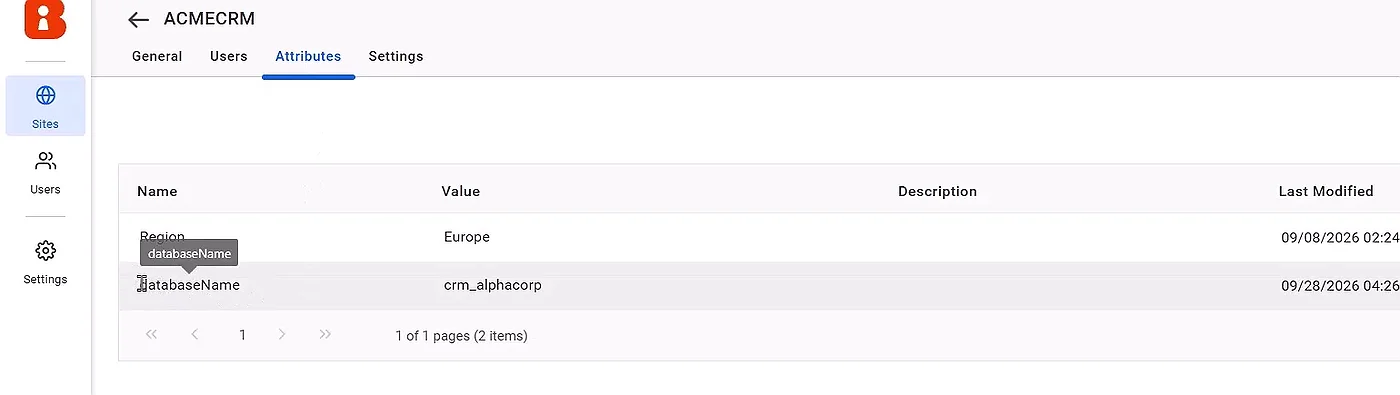
The report definition stays the same for every tenant. Only the attribute values change, and the server applies them at render time, keeping tenant selection out of the browser. For a wider look at this pattern, see how Bold Reports approaches multi-tenant reporting.
What are the best practices for embedding reports in React?
The session’s guidance reduces to a handful of habits:
-
- Keep credentials out of the front end. The React app renders the viewer and never stores database credentials.
- Route every report request through your own API. One trust boundary is easier to audit than several.
- Issue tokens on the server. Put report parameters and tenant attributes inside the token, not in browser code.
- Enforce access rules on the server. Authentication, authorization, tenant isolation, and row-level security all belong there.
- Freeze designer data panels. Use reportDesignerSettings so users can format reports but not alter connection strings.
- Isolate report processing. A separate reporting service keeps a large export from slowing the main application.
Takeaways for React teams embedding reports
-
- Dashboards and paginated reports do different jobs, and applications need the second whenever a document has to leave the screen.
- Building a reporting engine yourself adds ongoing cost in layout, printing, exports, performance, and framework upgrades.
- A viewer needs four properties, and the designer reuses the same connection details.
- Security is a server responsibility: authenticate, authorize, isolate tenants, and apply row-level security before a report renders.
- A server-issued token can carry report parameters and custom attributes, so tenant data stays separated.
Want to try embedding reports in React on your own data? Watch the recording, then start a Bold Reports trial or request a free demo to see the viewer and designer in your own project.
Frequently asked questions
-
- 1.
Why do React applications still need paginated reports when they have dashboards?
Dashboards show what is happening now and suit exploration. Paginated reports are documents with an exact page layout, identical on screen, in PDF, and on paper. Applications need them for invoices, statements, manifests, and compliance filings, where you must save, export, print, or submit a file.
- 2.
Where should row-level security be enforced in a React reporting app?
On the server. Anything enforced in the browser can be edited there, so your backend should decide permissions, report parameters, and tenant mapping before a report renders. In the webinar, filters are injected server-side and never accepted from the client.
- 3.
What does the React report viewer need to render a report?
Four properties: reportServiceUrl for the backend processing API, reportServerUrl for where report files are stored, serviceAuthorizationToken as proof of access issued by your own backend, and reportPath for the report to load. The app also needs the Bold Reports React package and a window.jQuery object.
- 4.
How do tenant attributes reach a report at render time?
Your backend generates an encrypted token that includes report parameters and custom attributes such as tenant ID, company ID, region, or user role. The browser receives only the opaque string. When the report runs, it injects those values into queries, so each user sees only permitted records.
- 5.
Can the same setup host the report designer?
Yes. Swap the viewer component for BoldReportDesignerComponent and reuse the same connection details: a service URL, a server URL, and a service authorization token. Data panels can be frozen through reportDesignerSettings, so users can format and lay out reports freely while connection strings stay read-only.
- 6.
Are Bold Reports locked into a proprietary report format?
No. Bold Reports stores reports in the standard RDL format, so definitions stay portable to any tool that reads the standard. Sanmati also noted that many of the session’s architecture principles, such as server-side security and a single trust boundary, apply regardless of which reporting platform you choose.
- 1.






