
How to Create a Year-Over-Year Report in Bold Reports

The year-over-year (YOY) growth metric shows the long-term success of a company and its strategies. This blog serves as a comprehensive guide for companies looking to harness the power of year-over-year reporting. By following our step-by-step instructions, businesses can create a YOY report in Bold Reports® and unlock their potential for sustainable growth.
Understanding year-over-year (YOY) growth analysis
YOY growth is a commonly used financial metric for assessing the success of a company’s operations. By comparing a company’s revenue, profits, or other financial metrics from one year to the next, stakeholders can gauge the business’s rate of development, scalability, and market traction.
Why is YOY growth analysis important for businesses?
Identifying Long-Term Trends and Growth Opportunities
YOY growth analysis helps businesses compare metrics from different years and distinguish between short-term fluctuations and long-term trends. It also helps identify growth opportunities by identifying areas with consistent growth. Businesses can capitalize on these trends, such as investing in a steady-growing product line and identifying potential markets and segments for expansion and diversification.
Performance Evaluation and Benchmarking
Businesses utilize performance evaluation to assess the effectiveness of their strategies and initiatives. YOY growth analysis offers a clear picture of a company’s progress by comparing financial metrics, sales data, and other relevant indicators from one year to the next. This method highlights trends and identifies areas for improvement.
Informed Decision-Making
YOY growth analysis is crucial for efficient decision-making and resource allocation. This data-driven approach helps businesses identify areas for improvement, maximize growth, and optimize profitability, ensuring a more effective and efficient business strategy.
Enhancing Financial Planning
Utilizing YOY data leads to more accurate budgeting and risk management. It provides a comprehensive understanding of past performance, enabling businesses to develop effective financial plans and forecasts.
How to Create a Year-Over-Year Report with Bold Reports
Bold Reports enables users to create a YOY report using date filters and time-based filtering expressions. This allows users to define specific date ranges for data comparison across different years.
Create a Year Report
To create a yearly report, we need to create a data source and dataset first. For this demonstration, we are going to use the JSON data connector. Following the Bold Reports documentation, we create a data source and generate a dataset for the YOY report.
Revenue Details Query
{
"details": [
{"Year": 2023, "Revenue": 8753, "Expenses": 6500},
{"Year": 2024, "Revenue": 9240, "Expenses": 8700}
]
}
Create year-over-year table
- Drag and drop a Tablix element from the item panel onto the Report Designer surface. Assign the previously created Revenue Details dataset to the table.
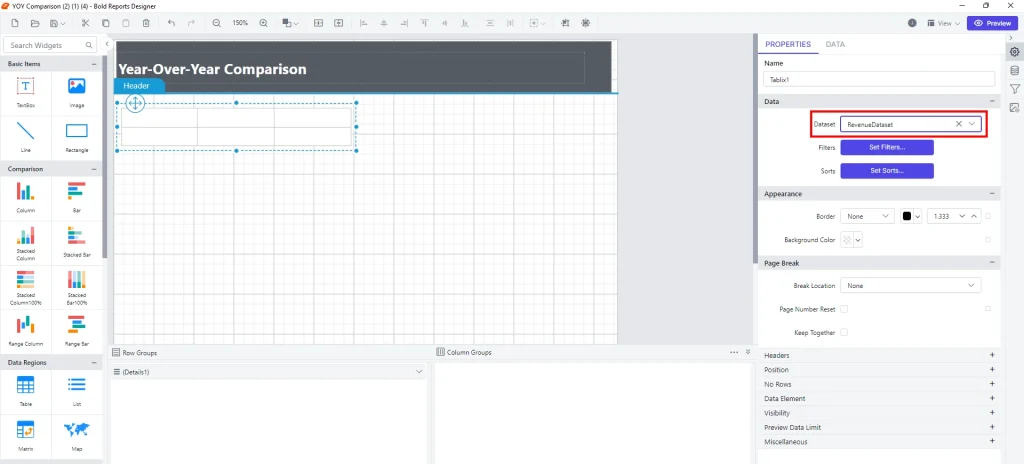
Adding the table - After adding the table, add the necessary columns.
- Then, to add a new row, navigate to the Insert menu and select Insert Row. Choose Outside Group – Below to place the new row beneath the current group of rows in the table.
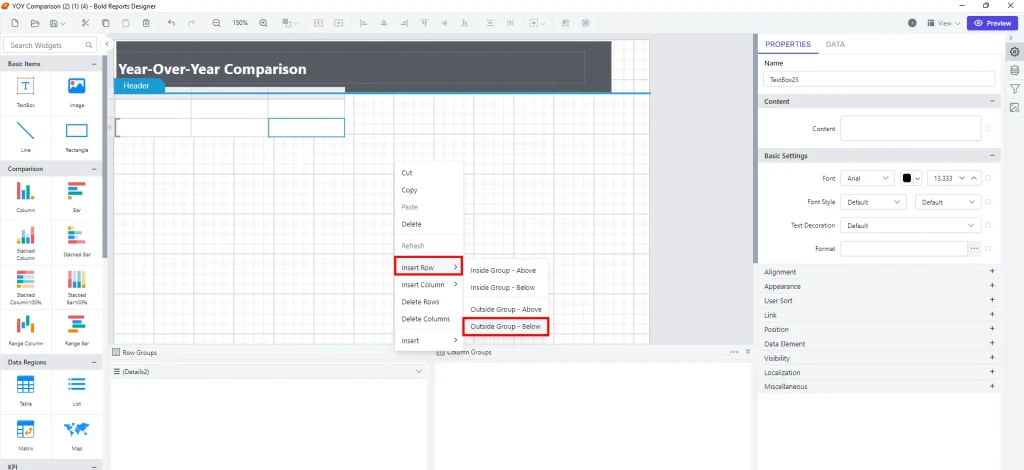
Adding rows to the table - Assign the required values to the table and calculate the revenue using the following expression:
=Fields!Revenue.Value – Fields!Expenses.Value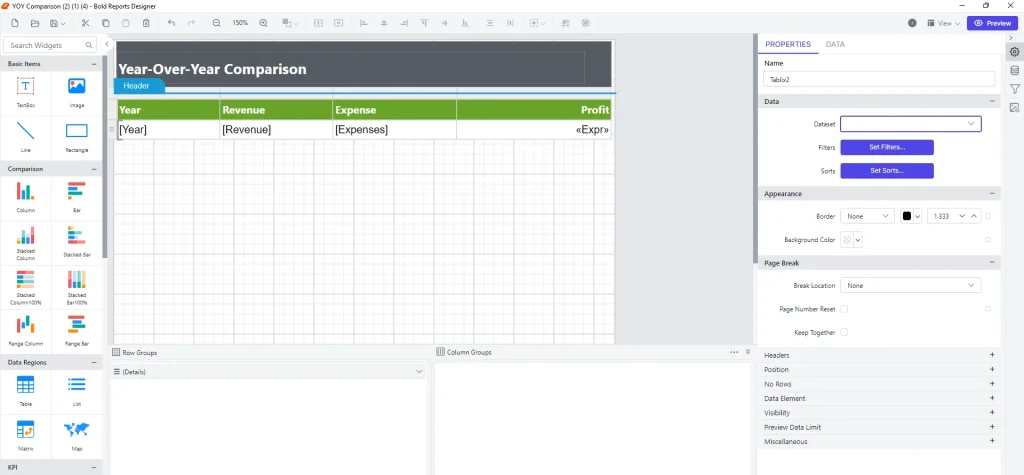
Assigning values to the table - Add expressions to calculate the YOY change for revenue, expenses, and profit. This means you’re figuring out how much these amounts have increased or decreased compared to last year.
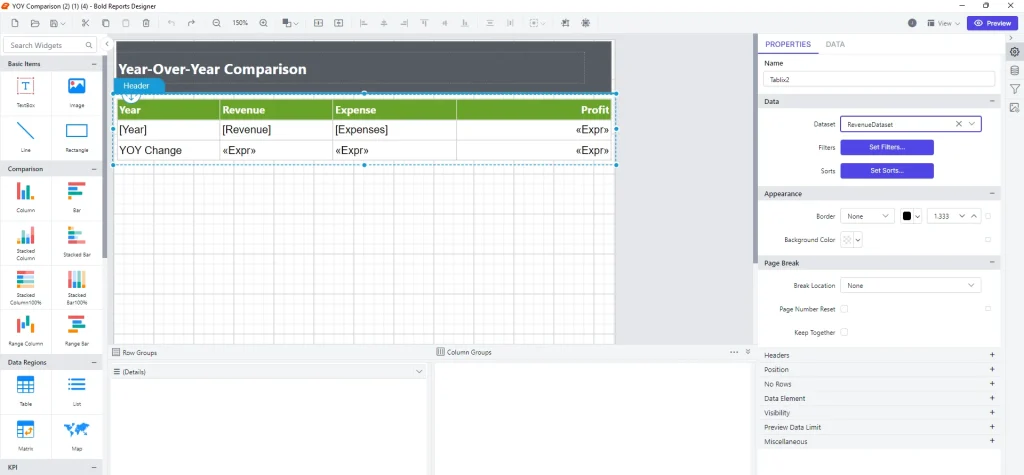
Adding expressions to calculate revenue, expenses, and profit in the report
Preview and Export
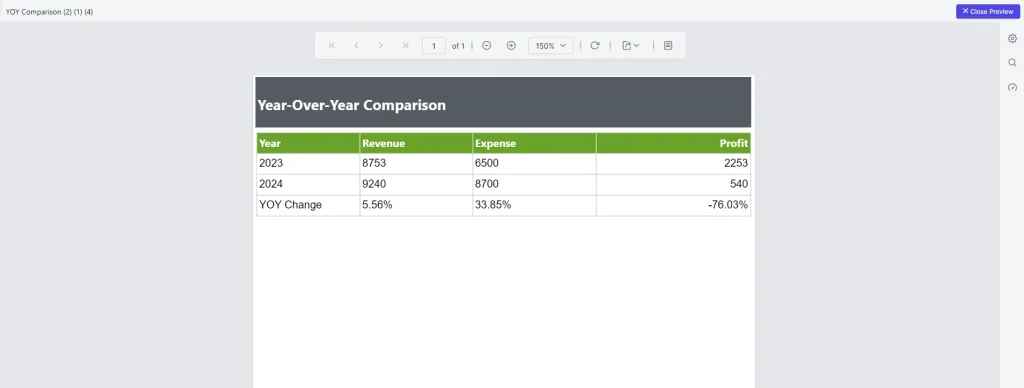
Step 1: We can preview the report by switching from Design to Preview in the top panel. This way, we can ensure that all data is correctly displayed, and calculations are accurate.
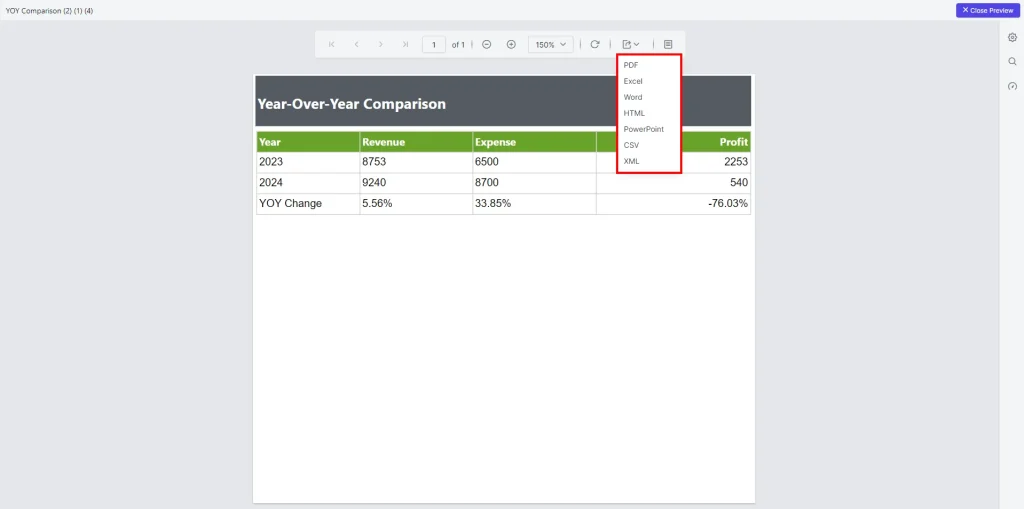
Step 2: Easily export the report in your preferred format, like PDF or Excel, or directly share it via the Bold Reports sharing options.
You can download a sample report from GitHub using the following link: Year over year comparison report.
In conclusion, year-on-year reports are indispensable tools for businesses seeking to gain a comprehensive understanding of their performance trends and make data-driven decisions. By leveraging Bold Reports’s intuitive reporting features, organizations can create insightful YOY reports that facilitate strategic planning, performance evaluation, and goal setting based on historical data analysis.
Bold Reports® offers a 30-day free trial with no credit card required. We welcome you to start one and experience Bold Reports for yourself.






