
What Are Paginated Reports? How Can You Create and Use Them?

Struggling to generate detailed, structured, and print-ready reports from massive volumes of information? You’re not alone. Many professionals, from analysts to IT teams, face the same challenge. That’s where paginated reports come in to simplify this process by breaking down complex data into organized, visually appealing, and actionable pages. In this blog, we’ll break down what paginated reports are, why they matter, and how you can easily create one using Bold Reports®.
What are paginated reports?
Paginated reports are detailed, structured reports divided into pages in the same manner as physical reports. They are designed for print-ready presentations and documents like invoices, account statements, or regulatory filings.
The following table differentiates paginated reports from other commonly used report types.
| Characteristic | Paginated reports | Interactive reports | Ad hoc reports |
| Layout | Fixed layout optimized for printing and presentation. | Dynamic layout that adapts to user interaction. | No predefined layout. |
| Purpose | Formal reporting with a consistent format for distribution. | Real-time data analysis and exploration. | Answer specific questions, analyzing data as needed. |
| Data handling | Suitable for large datasets, readable across multiple pages. | Flexible handling of data for interactive exploration. | Real-time data analysis, often with smaller datasets. |
Key features of paginated reports in Bold Reports
- Pixel-perfect layouts: Users can create pixel-perfect layouts with correct alignment and formatting in Bold Reports. This delivers professional-level documents that maintain consistency in various outputs and formats.
- Organized data display: The platform accommodates the display of massive datasets in an understandable format for easy viewing and review without compromising context. It allows users to generate reports that show all the necessary data.
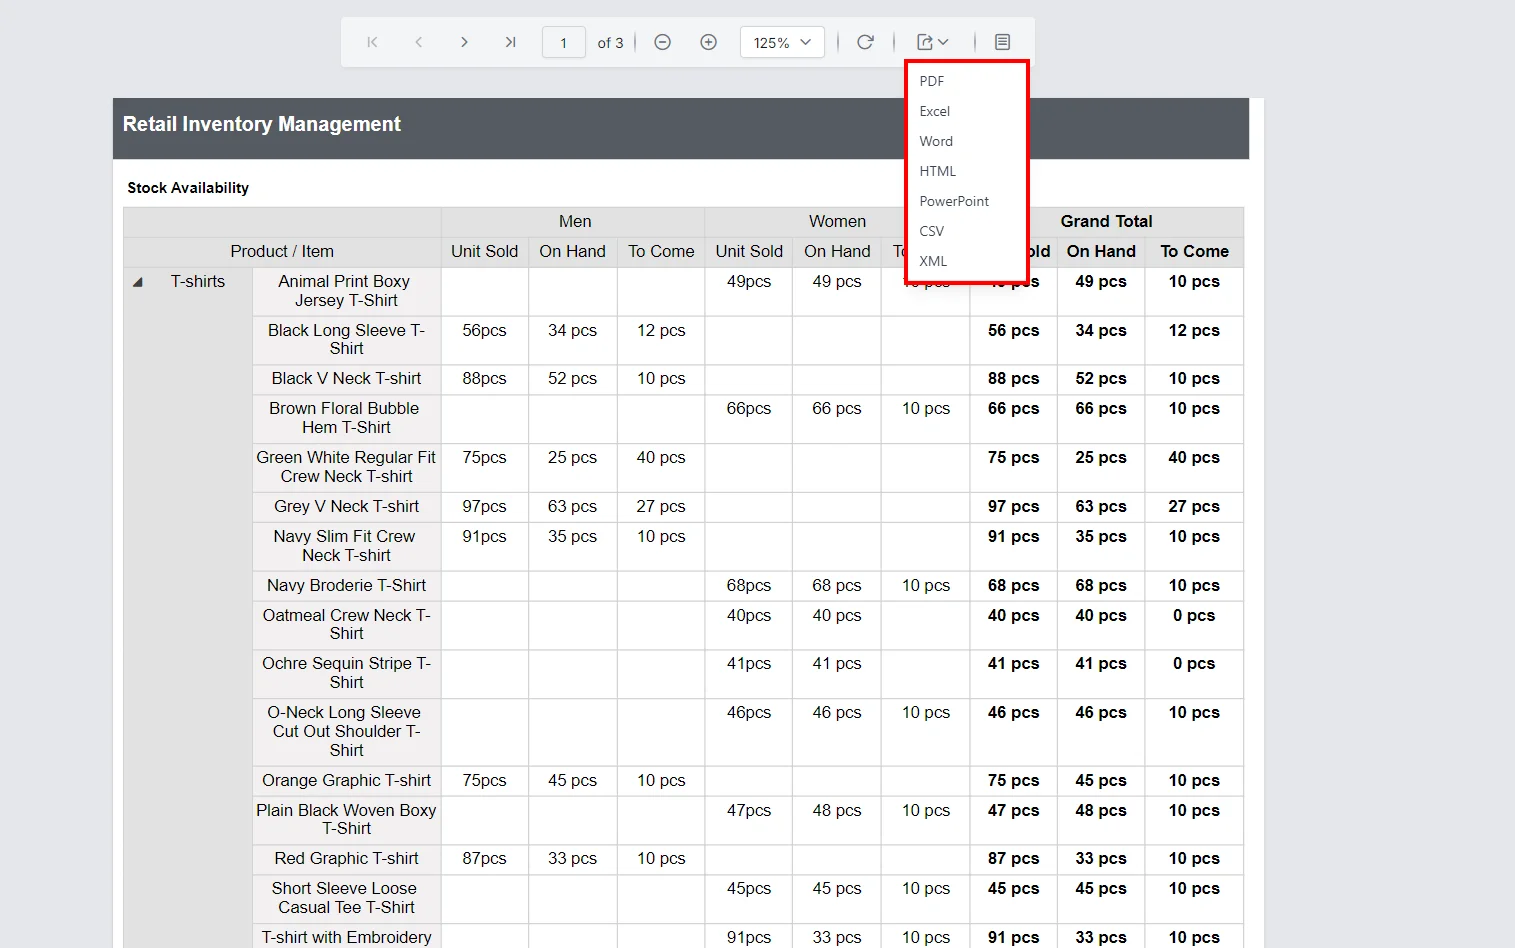
- Export flexibility: Paginated reports can be exported by users in any desired format, like PDF, CSV, XML, and HTML, for easy sharing and distribution of reports that meet the needs of the target audience.
- Control over detailed formatting: Bold Reports provides user-controllable formatting so reports can fit company guidelines and customizations. Users can customize margins, headers, and footers.
- Scheduling and automation: Bold Reports allows users to automate and schedule the generation and sending of reports so stakeholders can receive their updates more conveniently.
- Support for report parts: Bold Reports supports reusable report parts like headers, footers, and data regions. These can be reused among different reports.
- Drill-down support: The drill-down feature offers users a mechanism for obtaining detailed information by drilling down from aggregated data layers. Stakeholders can obtain a better understanding of the report and make better-informed decisions.
- Drill-through functionality: The drill-through function allows users to transition from summary reports to detailed data. They can obtain a deeper understanding of trends and figures, making it easier to perform an in-depth examination of business performance.
Now that we have seen the features of paginated reports available in Bold Reports, let’s explore how to create paginated reports by using Bold Reports.
How to create a paginated report in Bold Reports
Step 1: Create a new report
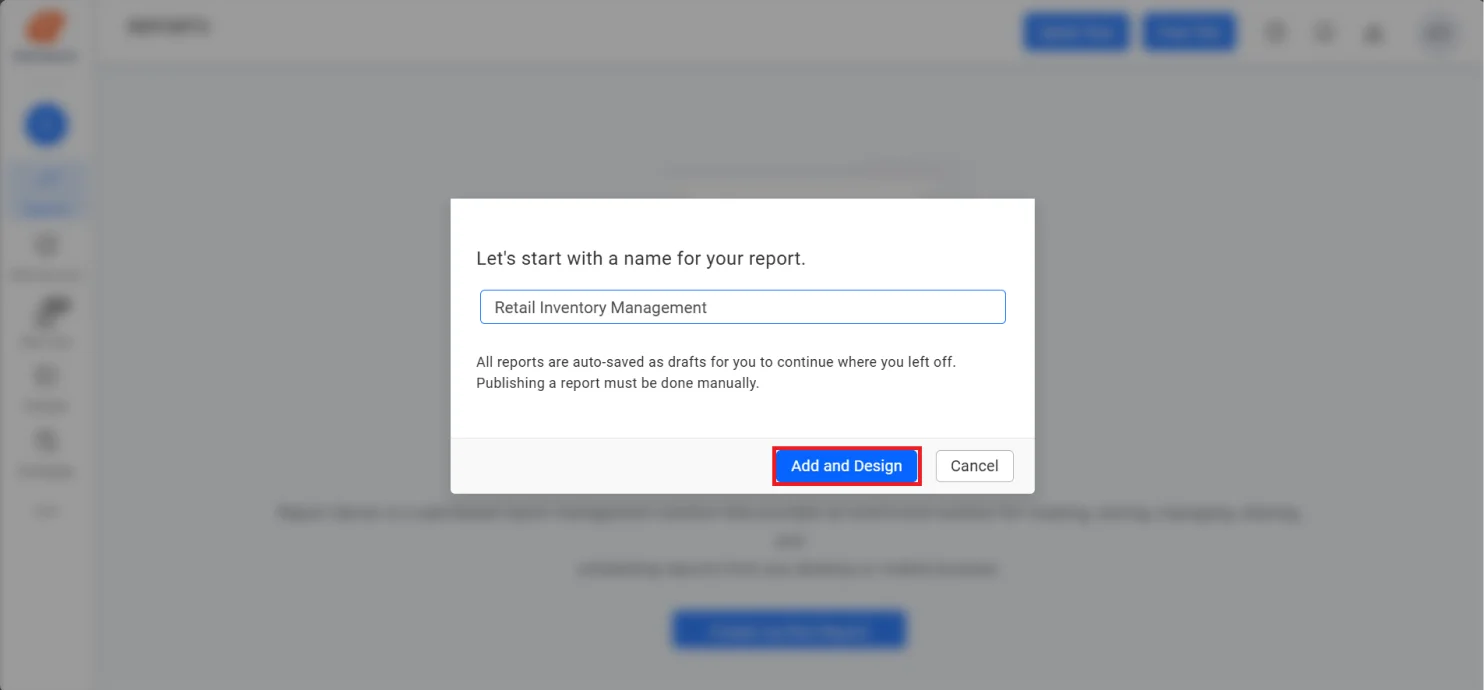
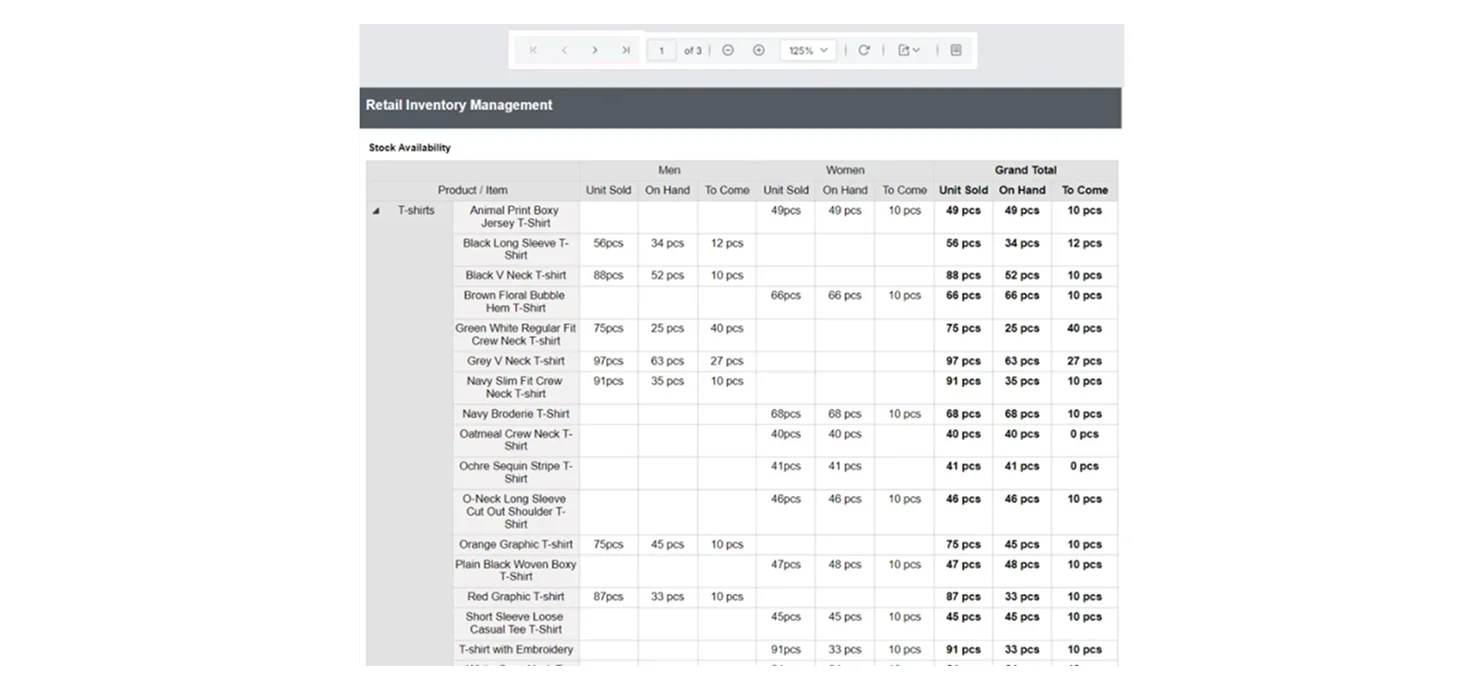
Create a new report in Bold Reports. Name it “Retail Inventory Management.” This report will be structured to display data across multiple pages.
Step 2: Connect your data source
Before you can design the report, you need to configure its data source, which could be a database connection, API, or any other data source supported by Bold Reports.
For this demonstration, we are going to use a connection string to a data connector. Following the Bold Reports documentation, create a data source and generate a dataset for the paginated report.
Step 3: Add report items
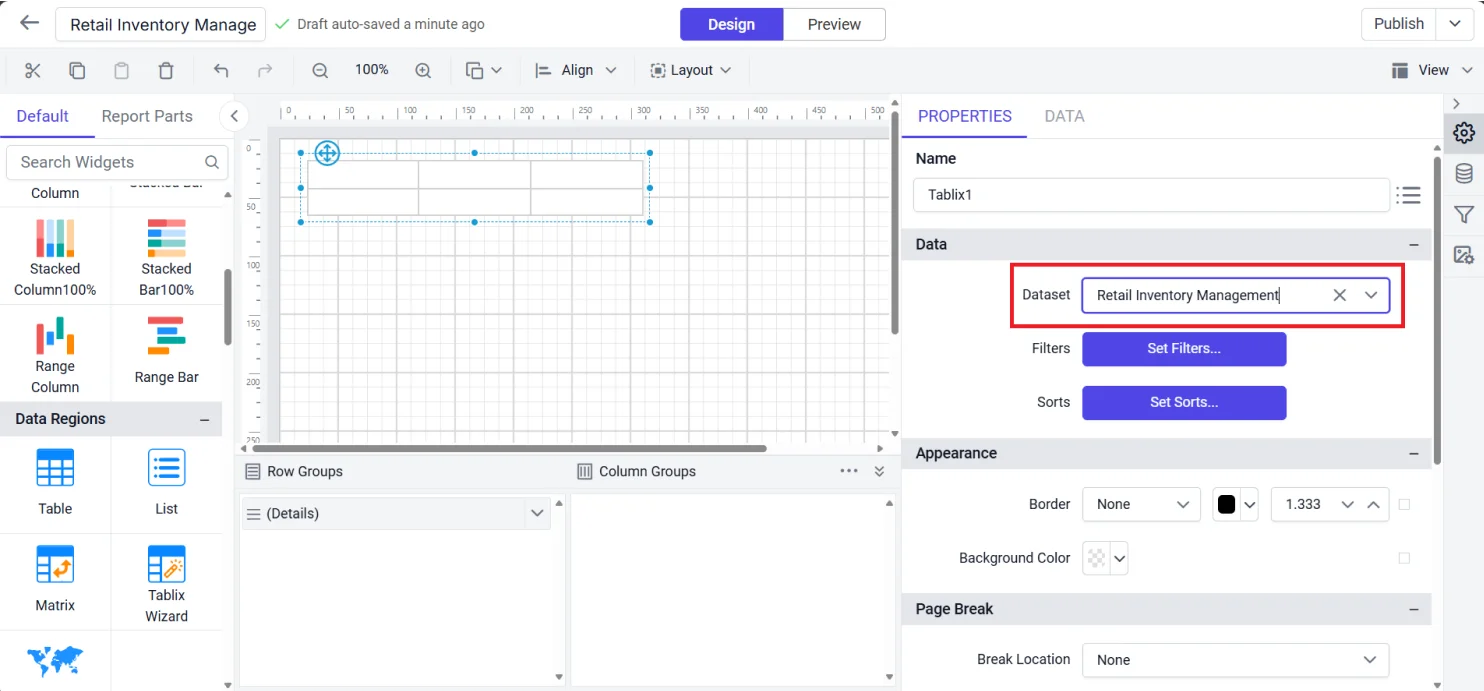
Drag and drop a Table element from the item panel onto the Report Designer surface. Assign the dataset created in the previous step to the table.
Step 4: Configure pagination settings
Define the page size and orientation in the report properties. This will dictate how your report appears when printed or exported.
In the table, include the necessary columns to display the data. To insert a new row, navigate to the Insert menu, select Insert Row, and then choose Outside Group – Below to place the new row beneath the current group of rows in the table.

Step 5: View data page by page
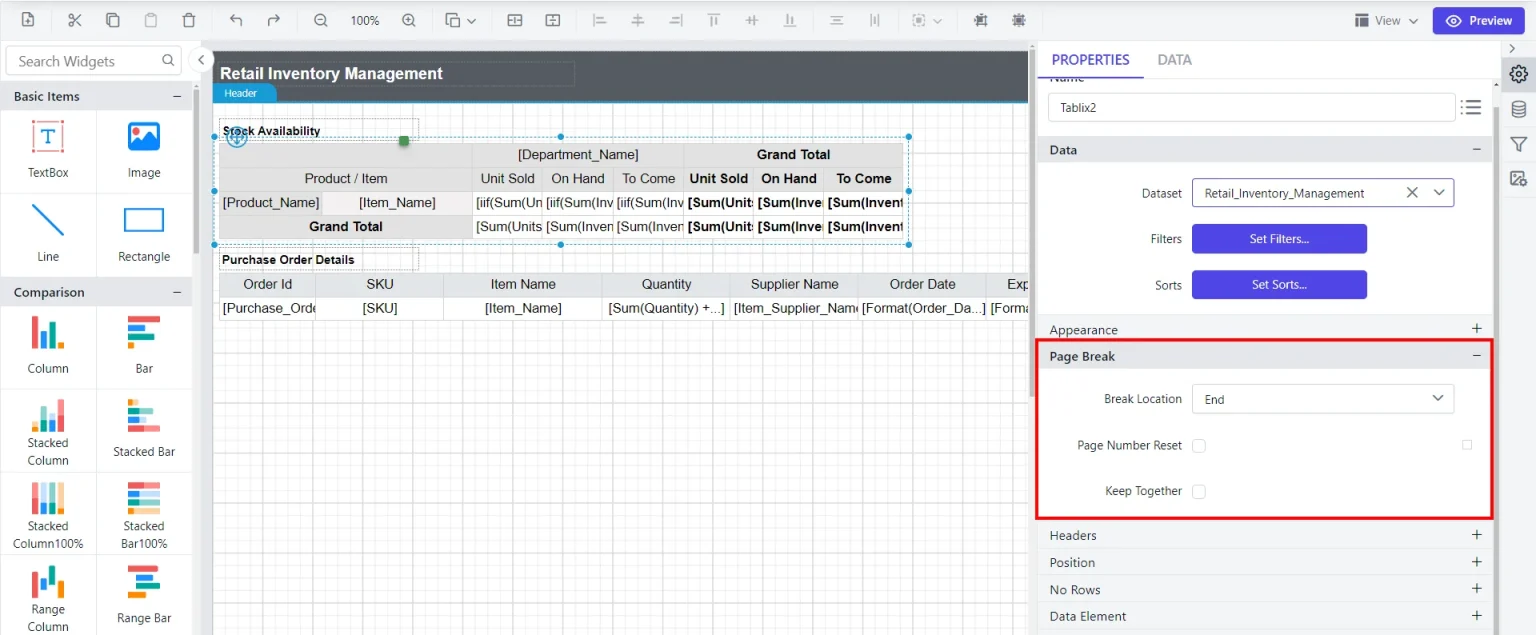
To view data page by page within the table widget, you need to ensure the table is properly structured with groups and that pagination is set up. In the table’s properties, in the Page Break section, set the Break Location at the end of a group, depending on your layout. This will enable the table to break across multiple pages when rendered, allowing you to view data one page at a time.
Step 6: Format your report
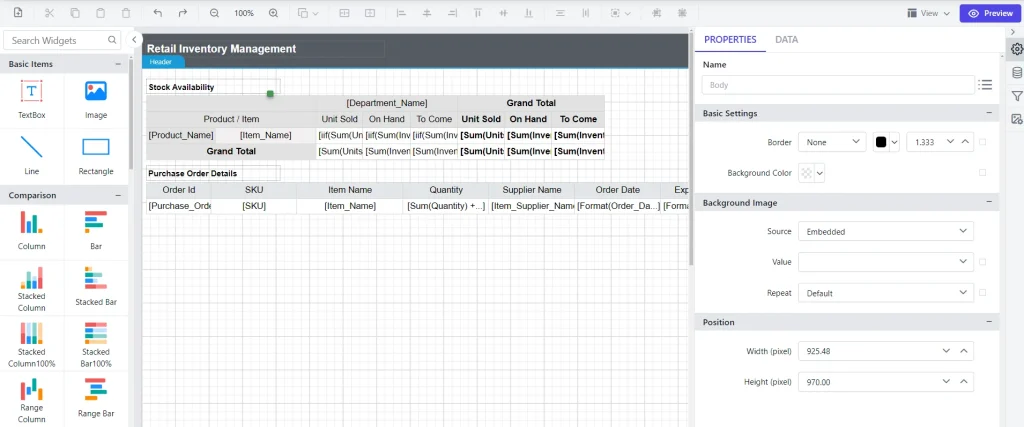
Customize your report by adjusting fonts, colors, and borders to improve readability. Add headers and footers to include essential information like titles, dates, and page numbers. Incorporate advanced features like drilling down to enhance data interaction, allowing users to click on specific data points to access detailed information.
Step 7: Preview and export
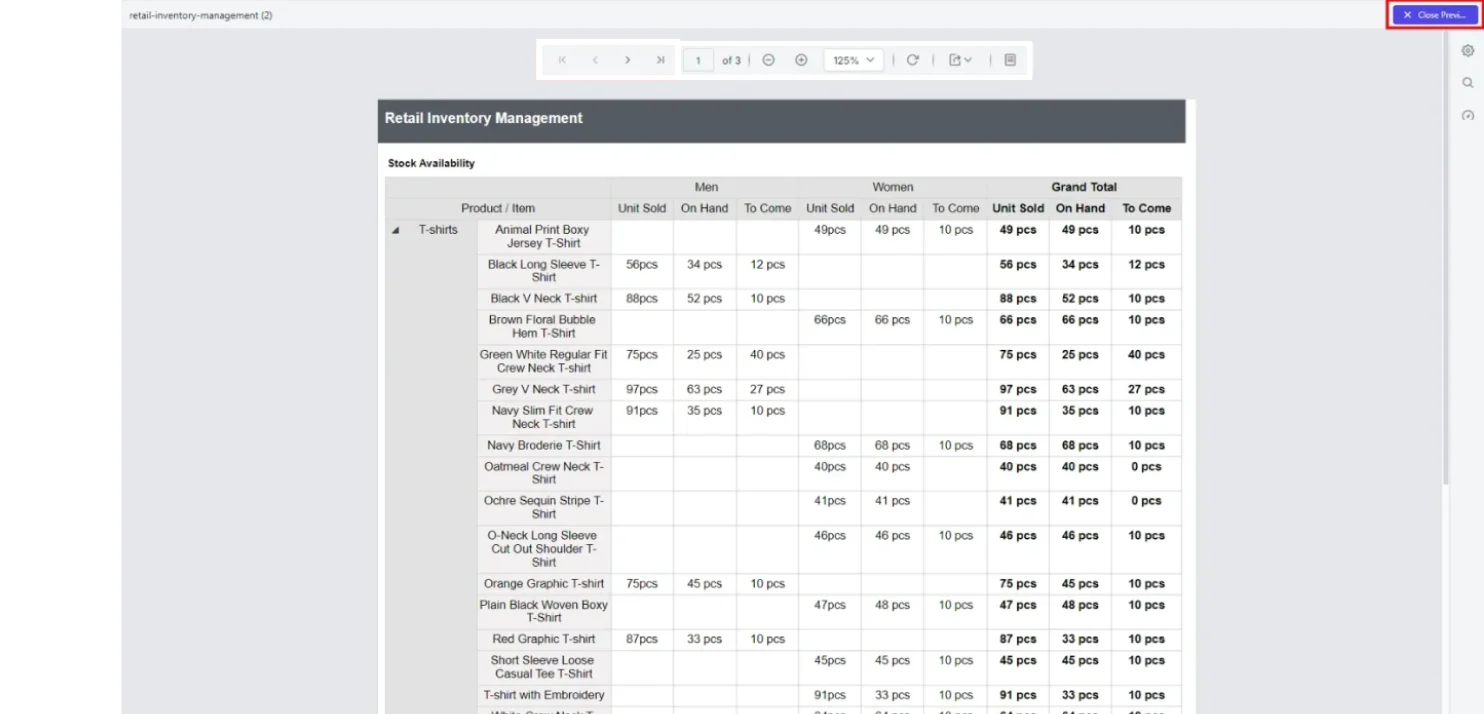
Preview the paginated report page by page by clicking Preview to switch to preview mode. This helps ensure that all data is correctly displayed.
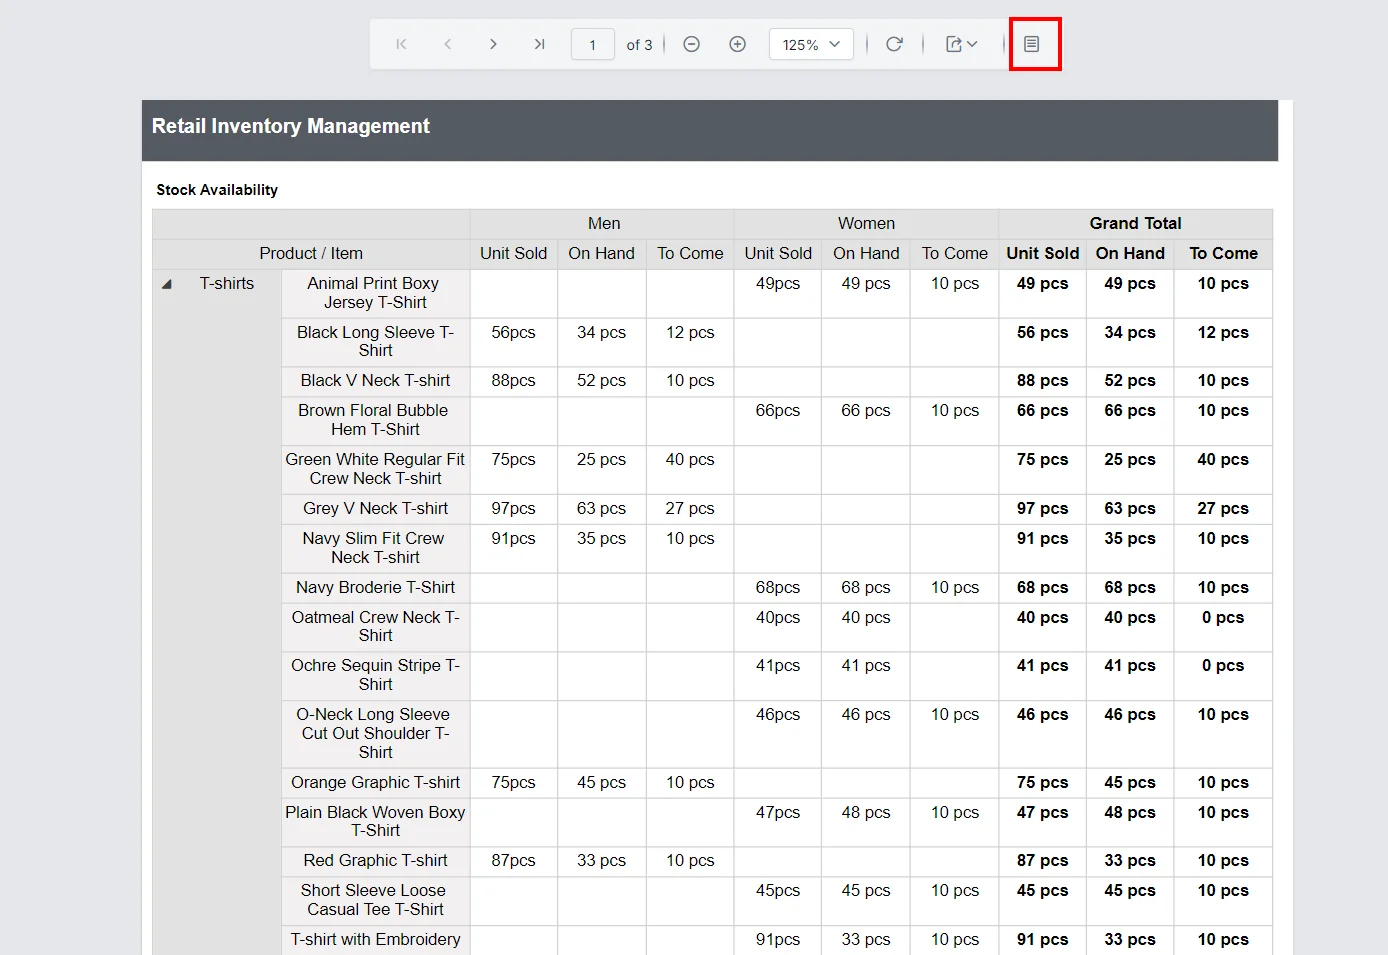
Once the paginated report is ready, you can print it for sharing and distribution.
Export the report in your preferred format, like PDF or Excel, or directly share it via the Bold Reports sharing options.
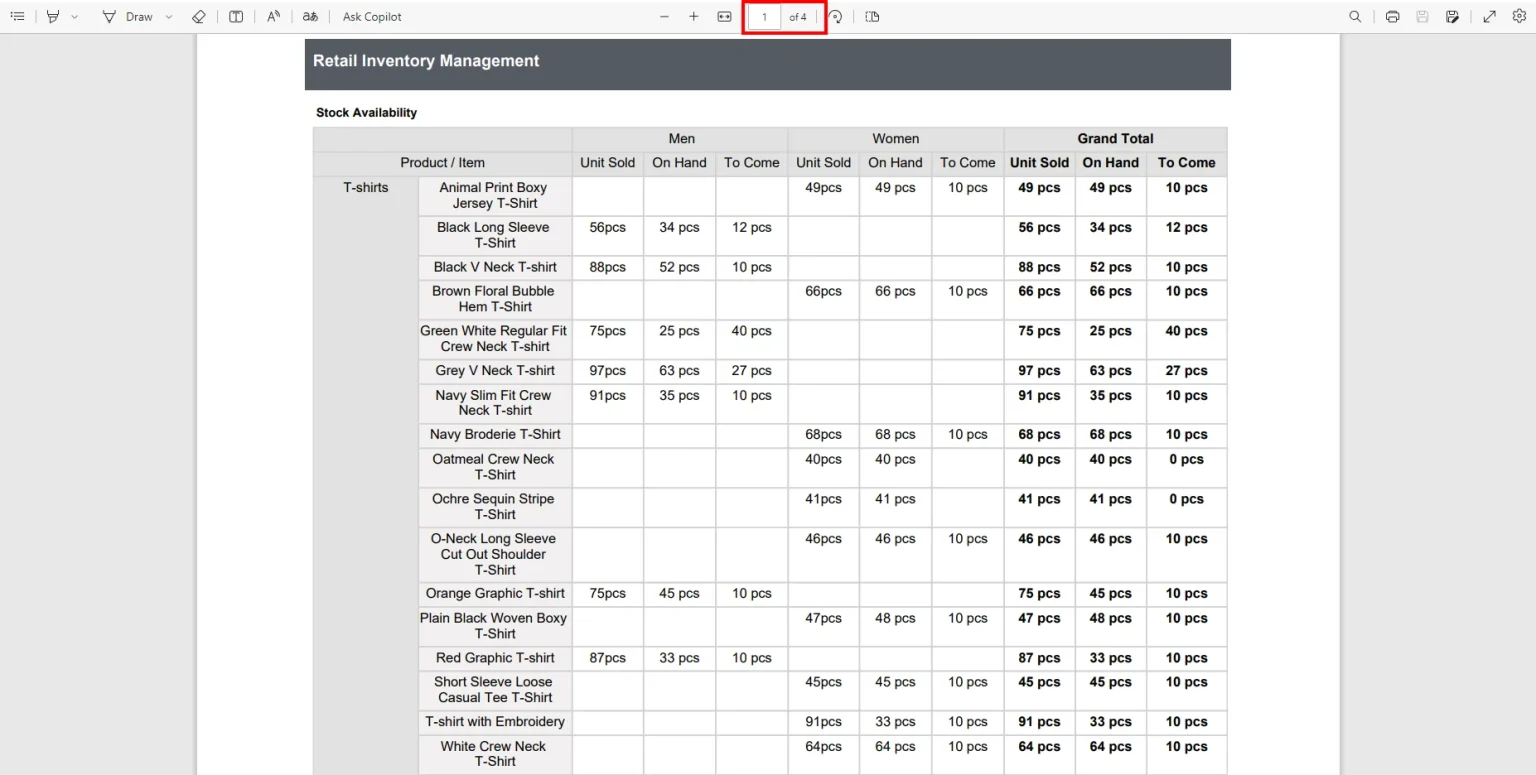
Step 8: Review and utilize your exported report
After exporting your report in your preferred format, review the document to ensure all data is accurately represented. You can then utilize the report for presentations, decision-making, or further analysis.
Now, let’s explore some of the use cases of paginated reports in different industries and how they help manage data effectively.
Use cases and benefits of paginated reports across different industries
Teams in healthcare, finance, sales, and retail use paginated reports to transform complex datasets into clear, structured formats. These reports help present detailed records, such as patient data, financial statements, sales performance, and inventory summaries, in a consistent, printable layout that supports decision-making, compliance, and operational efficiency. The following are a few use cases:
Retail
Retailers often face challenges in managing stock levels across product lines, tracking sales performance, and forecasting inventory needs. By using paginated reports to present structured data, like units sold, on-hand stock, and incoming inventory, they gain clear visibility into product availability, trends in demand, and sales forecasting.
Sales
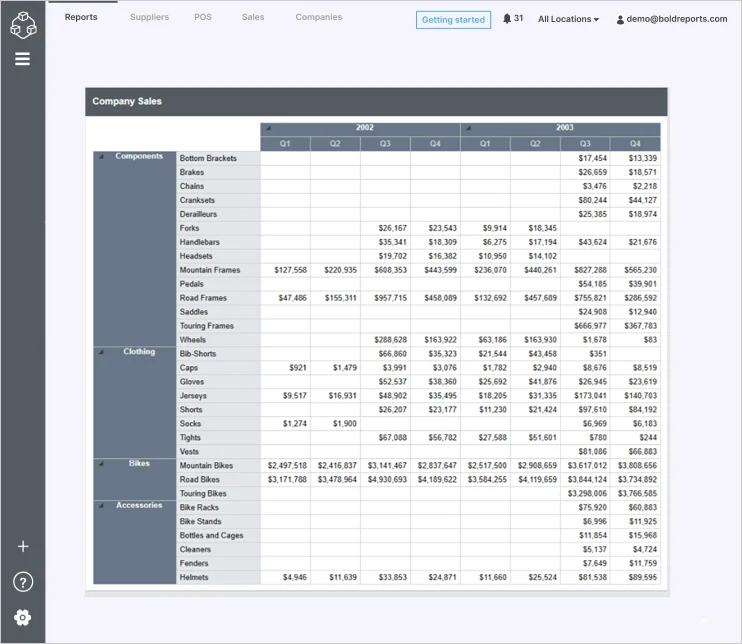
Sales teams often face challenges in tracking sales performance across product categories, analyzing seasonal trends, and presenting quarterly results in a clear format. Paginated reports are used to organize detailed sales data into structured, printable formats that facilitate performance reviews, forecasting, and strategic decisions.
Conclusion
Paginated reports are more than just formatted documents—they’re a solution to the chaos of big data. In this blog, we explored what paginated reports are and how they differ from other report types, why they’re essential for managing large datasets, their key features in Bold Reports®, how to create your own, and real-world use cases across industries like retail and finance. If you’re ready to simplify your reporting process and deliver high-impact, print-ready reports, Bold Reports has the tools you need.
Start your 30-day free trial today, or book a free demo to see how Bold Reports can transform your reporting workflow. Whether you’re new to reporting platforms or switching from another tool, Bold Reports offers smooth onboarding with expert guidance every step of the way.






