How to Implement Embedded Reporting: A 5-Step Framework
TL;DR:
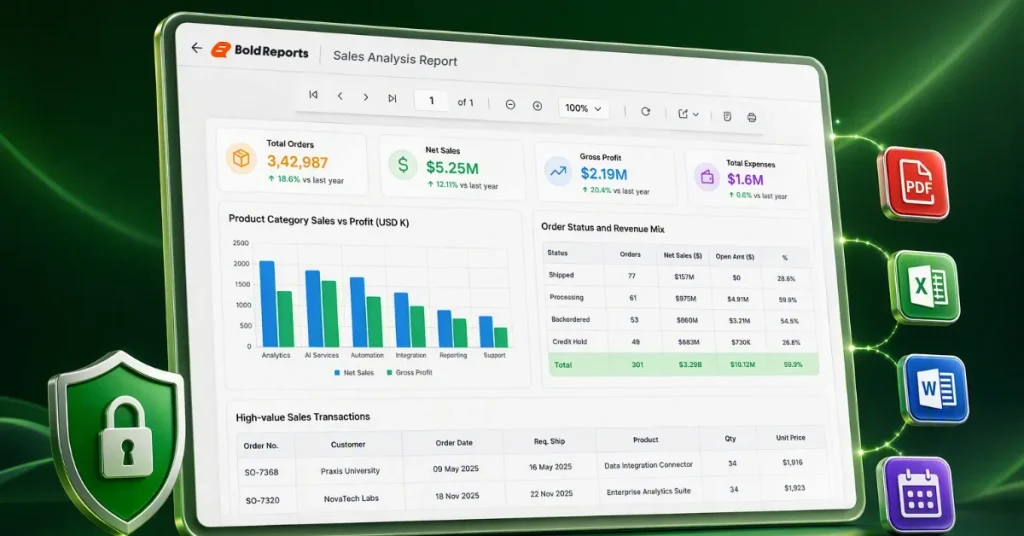
Implementing embedded reporting successfully requires more than placing a report viewer inside your UI. Teams need clear reporting requirements, secure RDL/RDLC access controls, performance optimization, and governance that supports scalable report generation, viewing, exporting, scheduling, and delivery over time.
Introduction
Users shouldn’t have to leave your product to download an invoice, generate a compliance packet, or export an operational report. In SaaS applications and customer portals, reporting needs to happen inside the workflow using consistent formatting, secure access controls, and reliable export options. That’s the goal of embedded reporting: delivering secure, export-ready, paginated reports inside the application experience using APIs/SDKs and embedded components.
This guide explains how to implement embedded reporting in a SaaS product using a proven 5-step framework.
Embedded reporting explained
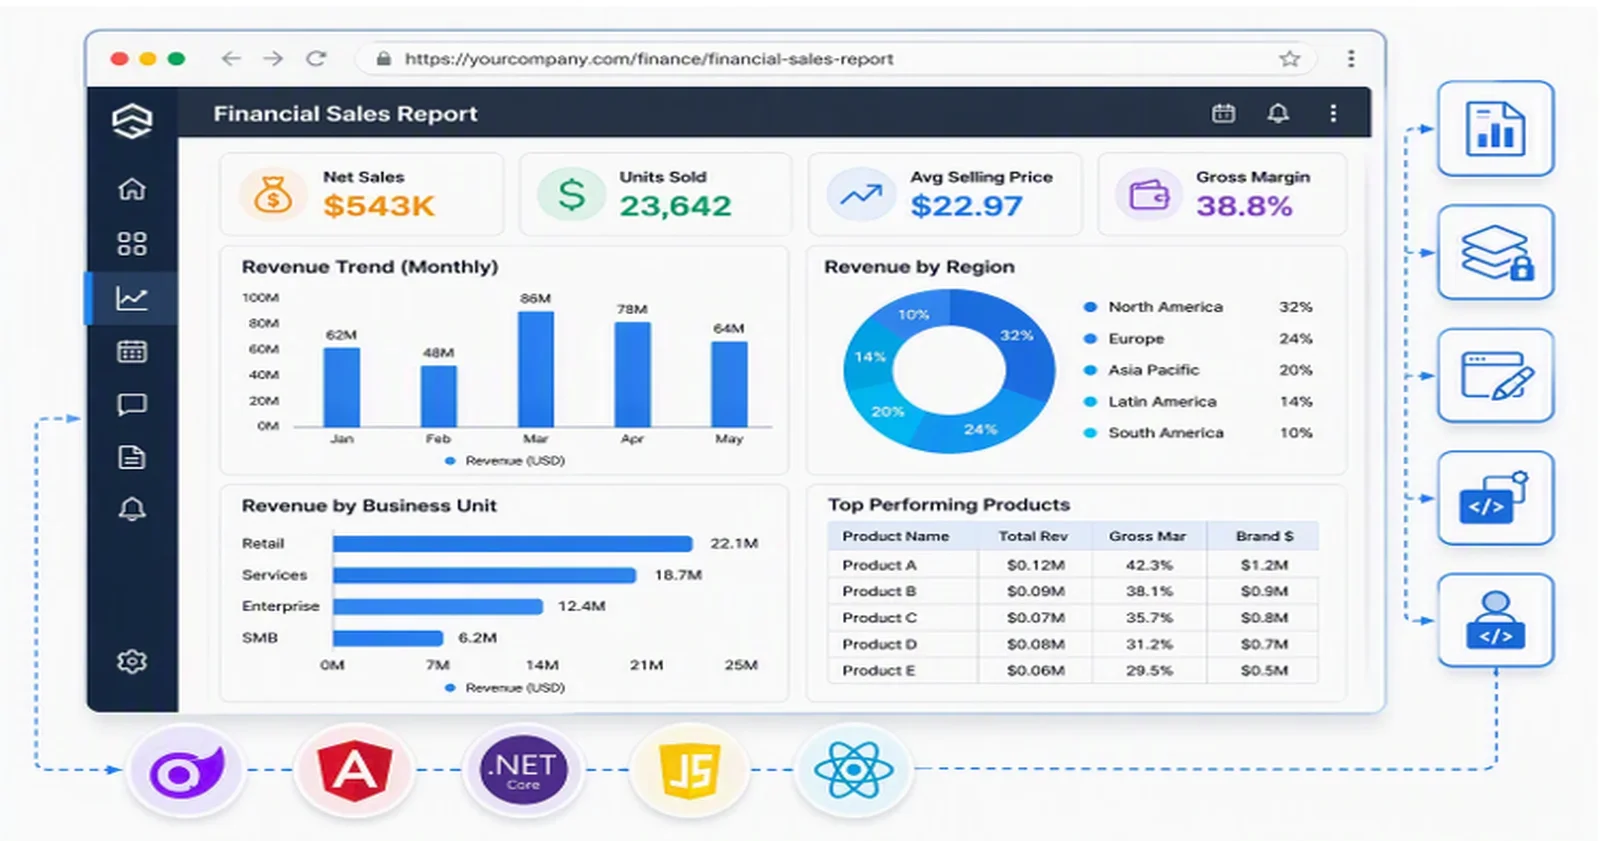
Embedded reporting is the practice of delivering report viewing, exporting, scheduling, and delivery inside your application using embedded components and APIs so users can access invoices, statements, and compliance documents without leaving the product.
Many implementations use RDL/RDLC definitions to produce pixel-perfect, paginated reports, especially for invoices, statements, audit outputs, and regulated documentation.
Embedded reporting is not the same as dashboards:
-
- Embedded reporting: formatted, paginated outputs often printable or exportable; RDL/RDLC-friendly
- Dashboards: interactive visualizations for exploration and at-a-glance monitoring
Why it matters for ISVs and SaaS product teams: embedded reporting is often a baseline product expectation for customer-facing portals where users need documents, not just charts.
How embedded reporting works
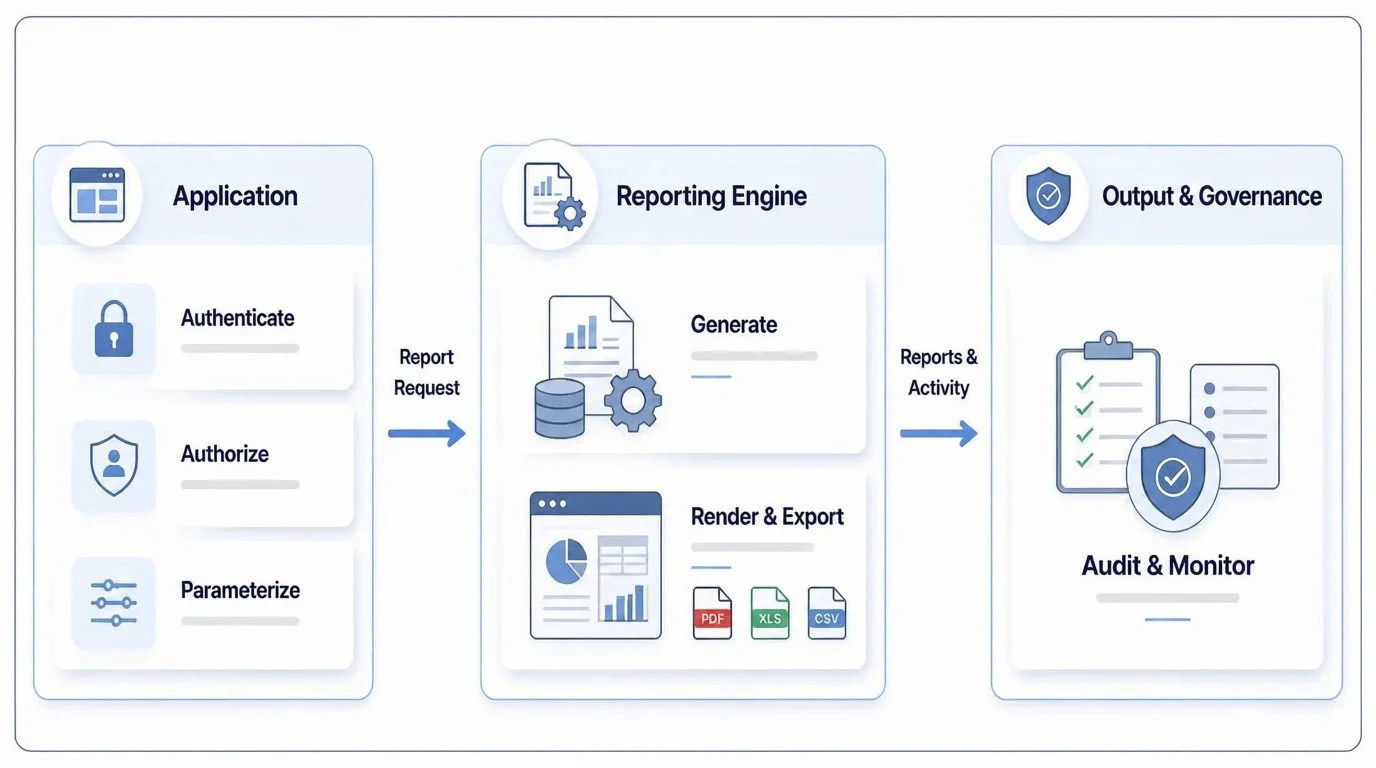
A typical embedded reporting setup follows these steps:
Authenticate: The user signs in to your application using single sign-on (SSO), OAuth, OpenID Connect, or your existing authentication system.
- Authorize: Your application evaluates permissions and determines which reports the user can access.
- Parameterize: The application sends report parameters such as date ranges, customer IDs, or tenant context.
- Generate: The reporting system retrieves data, enforces row-level rules, and processes the report definition (for example, RDL/RDLC).
- Render and export: The report is displayed inside your application. Users can print or export to formats such as PDF, Excel, or CSV. Some systems also support scheduled delivery.
- Audit and monitor: The system records activity such as who accessed what and when, and it captures performance signals like render time, export time, failures.
How to implement embedded reporting: the 5-step framework
1. Define reporting requirements
Successful embedded reporting starts by clarifying what users need and how reports support business processes.
Define:
-
- Users and roles: customers, finance teams, operations teams, compliance staff, admins.
- Use cases: invoicing, auditing, compliance reviews, account management, usage statements.
- Delivery expectations: in-app viewing, export, print, email delivery, scheduled distribution.
- Success metrics: adoption, reduced manual requests, faster turnaround, fewer support tickets.
Impact: Clear requirements prevent low-usage reports and reduce rework caused by unclear scope.
2. Design the reporting experience
A good reporting experience minimizes friction: Users should be able to find, run, and share reports without leaving their workflow.
Design for:
-
- Findability: clear report names, categories, and search where applicable.
- Usability: filters that match user mental models such as date range, customer, and status.
- Reliability cues: loading states, “no data” guidance, helpful error messages.
- Consistent outputs: predictable PDF/Excel/CSV exports and print formatting.
- Permission-aware UI: hide reports/actions users can’t access.
Impact: Better UX increases adoption and reduces support requests.
Want a reference implementation? Explore how an embedded report viewer can support searchable report lists, parameter panels, exports, and permission-aware actions inside your application UI.
3. Secure access to reports and data
Security must be part of the design, not a post-launch patch.
At a minimum:
-
- Require authentication before report access.
- Enforce report-level permissions so users can only access authorized reports.
- Enforce data-level security so users only see authorized rows, records, or tenants.
- Secure data connections using TLS, secrets management, and least-privilege access controls.
- Track report activity and exports to support auditing and compliance requirements.
Impact: Strong controls protect sensitive data and support compliance requirements.
If your team needs to validate SSO, role-based access control, and multi-tenant isolation, review the Bold Reports security and authentication options before implementation.
4. Embed reports into business workflows
Reports deliver the most value when they appear where users already work.
Examples:
-
- Billing page: Download Invoice PDF
- Customer record: Account Summary Report
- Admin area: Export Compliance Packet
- Usage page: Monthly Usage Statement
To increase adoption:
-
- Provide reliable PDF, Excel, and CSV exports.
- Support scheduled delivery where it aligns with user workflows.
- Match the embedded viewer styling to your product UI for a consistent white-label experience.
Impact: Users receive the documents they need at the point of action instead of searching through separate reporting areas.
If you’re embedding invoices, statements, or compliance packets, explore this guide to customer-facing reporting workflows in SaaS applications to learn how to deliver RDL reports, exports, and scheduling directly within the user experience.
5. Monitor performance and scale
Embedded reporting requires ongoing monitoring to maintain speed and reliability as usage grows.
Track:
-
- Report load time p50/p95.
- Export processing time.
- Timeout/error rate.
- Usage patterns including top reports and peak hours.
- Failed scheduled deliveries if applicable.
Optimize by:
-
- Improving query performance and indexes.
- Caching where appropriate with tenant-safe strategies.
- Simplifying complex layouts and reducing heavy subreports.
- Load testing key reports before major releases.
Impact: Monitoring prevents performance regression and protects the in-app user experience.
Key components of an embedded reporting environment
To implement embedded reporting successfully, several components need to work together. These components help ensure reports are easy to create, secure to access, and simple for users to consume within your application.
A typical embedded reporting environment includes:
-
- Report designer: Creates and maintains report templates.
- Embedded report viewer: Displays reports directly within the application.
- Data access layer: Connects reports to business data securely and consistently.
- Role-based access control: Manages who can view, run, and export reports.
- Export and delivery options: Generate reports in formats such as PDF, Excel, CSV, and Word, or deliver them on a schedule.
- Performance and scalability features: Support growing numbers of users, reports, and datasets.
- Monitoring and maintenance: Track performance, usage, and system health to continuously improve the reporting experience.
- Reporting governance: Establish ownership, standards, and review processes to maintain report quality and consistency.
These components provide the foundation for a successful embedded reporting implementation, helping organizations deliver secure, scalable, and user-friendly reporting experiences within their applications.
Common embedded reporting challenges and how to prevent them
Even well-planned embedded reporting projects can encounter obstacles. Understanding these challenges early can help you avoid costly issues later.
- Unclear reporting requirements: Define who needs each report, what problem it solves, and how success will be measured.
- Security and access issues: Establish user permissions and data access rules from the beginning to protect sensitive information.
- Slow report performance: Optimize data retrieval, test report performance regularly, and monitor response times as usage grows.
- Low user adoption: Place reports within existing workflows and make them easy to find, access, and use.
- Increasing report requests: Create a process for reviewing, prioritizing, and approving new report requests.
- Difficult report maintenance: Use consistent report naming, documentation, and review practices to keep reports organized over time.
Impact: Addressing these challenges early helps create an embedded reporting environment that remains secure, reliable, and easy to manage as reporting needs evolve.
Embedded reporting readiness checklist
Before launching your SaaS reporting workflow, confirm that the following essentials are in place:
-
- Reporting goals and success metrics have been clearly defined.
- The highest-priority reports for the initial release have been selected.
- Reports are easy for users to find and access within the application.
- User access permissions have been tested and validated.
- Report exports, including PDF, Excel, and CSV formats, have been tested for accuracy.
- Report performance has been tested under expected usage levels.
- Report activity, errors, and system performance can be monitored.
- A plan is in place to support future growth, including additional users, reports, and data volumes.
A readiness checklist helps teams identify gaps before launch, reducing the risk of performance issues, security concerns, and poor user adoption.
How to measure embedded reporting success
Once embedded reporting is live, track the metrics that align with your implementation goals and business objectives.
Measure:
-
- Adoption: The number of users regularly viewing, running, or downloading reports.
- Performance: Report load times, export speed, and the frequency of report failures or timeouts.
- Engagement: How often users export, print, share, or schedule reports.
- Scalability: How well the reporting environment performs as the number of users, reports, and data volumes
- Business Impact: Reductions in manual report requests, spreadsheet-based reporting, and time spent compiling information.
Measuring success helps determine whether embedded reporting improves user adoption, reduces manual report requests, and delivers operational efficiencies. Monitoring these metrics over time also helps teams identify scaling requirements, optimize report performance, and support future reporting needs as application usage grows.
Embedded reporting success in practice
Real-world implementations highlight the impact embedded reporting can have on software applications. In a G2 review, Michael D., an SSRS Developer, described how his team integrated Bold Reports into a custom software application, giving customers direct access to reports and report scheduling capabilities within the product.
By embedding reporting into the application, the team was able to:
-
- Provide customers with self-service access to reports.
- Enable report scheduling and delivery directly within the application.
- Create a seamless reporting experience without relying on external reporting tools.
- Maintain a consistent look and feel across the software platform.
Reflecting on the outcome, Michael shared:
“When the Bold Reports embedded application was incorporated, the overall look, performance, and functionality just skyrocketed.”
This example illustrates how embedded reporting can transform reporting from a standalone process into a native application capability. By integrating report viewing, generation, scheduling, and delivery directly into SaaS and enterprise applications, organizations can improve the user experience while providing secure, scalable access to business-critical information.
How Bold Reports helps teams implement embedded reporting faster
Bold Reports® is an embedded reporting platform built for SaaS applications, ISVs, and enterprise software that require scalable, secure, and pixel-perfect reporting. It enables fast implementation with minimal effort, supporting paginated (RDL) reports, real-time data access, and enterprise-grade security for data-driven applications.
-
- Native SSRS compatibility: Migrate existing RDL reports easily without rebuilding or reformatting.
- Rapid report integration: Use robust APIs and SDKs (.NET, JavaScript) to embed reports quickly with minimal development effort.
- Pixel-perfect and paginated report support: Create highly formatted, print-ready reports for financial, operational, and compliance use cases.
- Advanced security and multi-tenancy: Ensure secure data access with role-based permissions, SSO, and tenant-level isolation.
- Fully white-label reporting experience: Customize reports to match your application’s UI for a seamless, native user experience.
With Bold Reports, you can accelerate time-to-market, simplify development, and deliver secure, high-performance embedded reporting that boosts user engagement, retention, and revenue growth.
Development teams can accelerate implementation with Bold Reports embedded reporting documentation, including framework-specific integration guides, API references, deployment instructions, security configuration guidance, and SDK resources for modern application frameworks. Supporting this experience, a G2 reviewer highlighted helpful documentation and examples, support for various data sources and the query designer, and straightforward integration into an existing ASP.NET Core application.
Final thoughts
Embedded reporting has become a core capability for SaaS applications, customer portals, and enterprise software that require operational, financial, compliance, and customer-facing reports to be delivered directly within the user experience. Success depends on more than embedding a report viewer. Organizations must define reporting requirements, implement secure report access, support scalable architectures, and establish governance processes that keep reporting maintainable as usage grows. By taking a structured approach and choosing a reporting solution that supports RDL/RDLC compatibility, multi-tenant security, pixel-perfect reports, and flexible integration options, development teams can deliver reporting experiences that feel native to the application while minimizing implementation complexity.
Solutions such as Bold Reports help accelerate deployment with embedded report viewing, report design, exporting, scheduling, and centralized report management capabilities built specifically for modern SaaS environments. For organizations building or modernizing SaaS applications, choosing an embedded reporting solution with flexible integration and scalable performance is essential for long-term success. Start implementing embedded reporting today with a free 30-day trial or request a personalized demo to evaluate your reporting requirements.
Frequently asked questions
- 1.
Can embedded reporting support large-scale datasets?
Yes, if the reporting system supports caching, pagination, and optimized query execution.
- 2.
What is the role of APIs in embedded reporting?
APIs let developers embed, customize, and control reporting features inside applications, enabling dynamic data access and flexible report management.
- 3.
What are the key challenges in embedded reporting implementation?
Common challenges include data integration complexity, performance optimization, security management, and ensuring a consistent user experience across different devices.
- 4.
How secure is embedded reporting in SaaS applications?
Embedded reporting can be highly secure when implemented with encryption, role-based access control, and secure authentication methods like SSO or OAuth, ensuring data is protected at all levels.
- 5.
Can embedded reporting be customized for different user roles?
Yes, embedded reporting supports role-based customization using dynamic parameters, filters, and permissions, ensuring each user sees relevant data.
- 6.
What types of reports can be embedded?
You can embed financial reports, operational reports, invoices, compliance reports, and other pixel-perfect (paginated) reports depending on business needs.
- 7.
How is embedded reporting different from dashboards?
Embedded reporting focuses on structured, formatted reports, while dashboards provide interactive visualizations for data exploration.