
Simplify Data Integration and Reporting with Bold Data Hub
Introduction
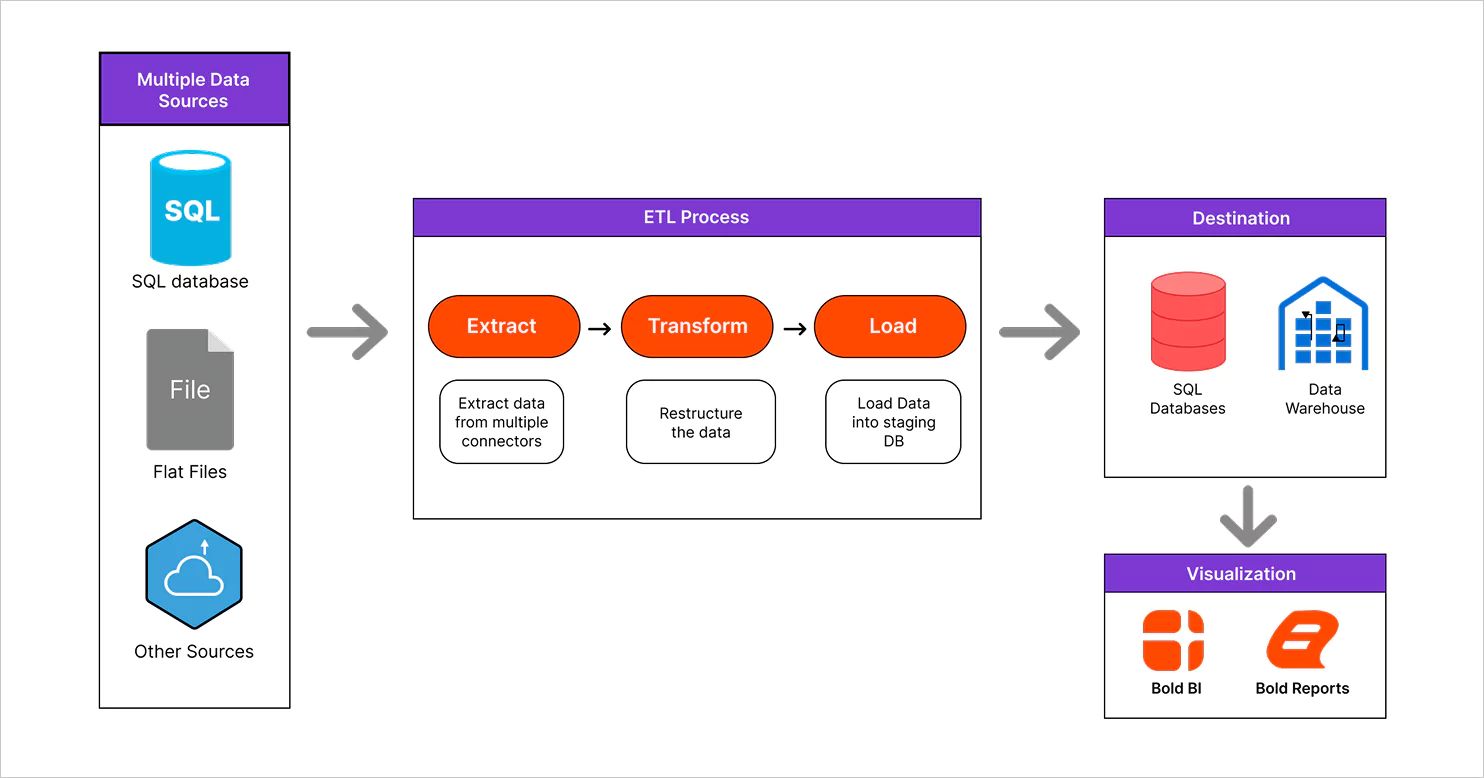
Bold Data Hub is transforming organizations that manage reporting by solving the challenges of scattered data sources, manual ETL processes, and limited integration. Designed for Bold Reports® and Bold BI®, it offers a centralized, code-free platform that simplifies data transformation and reporting across environments. With support for over 25 connectors including Google Ads, Salesforce, and PostgreSQL, it enables seamless data flow from source to dashboard.
This blog explores how Bold Data Hub streamlines your data pipeline, automates scheduling, improves decision-making, and shows you how to connect your data, set up ETL jobs, and build smarter reports with ease.
What Is Bold Data Hub
Bold Data Hub is a centralized data reporting platform designed to unify and transform data from multiple sources into a clean, streamlined pipeline. Built specifically for Bold Reports, it enables code-free data transformation, automated data integration, and simplified reporting across any environment.
Now, let’s examine the key features that make Bold Data Hub essential for modern reporting workflows.
Key Features of Bold Data Hub
Below are the core capabilities that make Bold Data Hub essential for modern reporting workflows
- Data extraction supports integrating diverse data sources to enable streamlined and efficient data retrieval.
- Data transformation offers flexible transformation options to prepare data prior to loading into target systems.
- Data-loading is compatible with multiple database platforms, including Bold Reports Data Store, PostgreSQL, MSSQL, MySQL, and Apache Doris.
- ETL scheduling includes built-in scheduling tools for automating ETL workflows at defined intervals, helping maintain data freshness and readiness for downstream processes.
How Bold Data Hub Helps You Achieve Smarter Reporting
Using Bold Data Hub with Bold Reports unlocks powerful advantages:
- Effortless integration: Enables instant access to transformed data within Bold Reports or Bold BI, streamlining report creation and reducing manual effort.
- Flexible loading options: Give teams control over where reporting data is stored, whether in Apache Doris, SQL servers, or cloud platforms, ensuring scalability and compliance.
- Custom extraction: Supports scheduled or on-demand data extractions tailored to your workflow, so reports are always powered by timely, relevant insights.
- Automation and scheduling: Sets up recurring tasks to keep your data consistently refreshed, eliminating the need for manual updates.
- Large file handling: Transfers billions of rows from oversized CSV files swiftly and reliably, without compromising system performance.
- Connecting multiple sources in one pipeline: Integrates data from over 25 sources, including files, web APIs, and SQL databases, into a unified, streamlined pipeline.
Learn more about how Bold Data Hub empowers your analytics at the Bold Reports Data Hub page.
Bold Data Hub Supported Databases
Bold Data Hub seamlessly integrates with a wide range of databases, enabling efficient data consolidation and reporting. Key databases include:
- PostgreSQL: A powerful open-source object-relational database renowned for its reliability, scalability, and advanced features.
- Microsoft SQL Server (MSSQL): A robust enterprise-grade relational database developed by Microsoft, ideal for handling complex transactional workloads.
- MySQL: A widely adopted open-source relational database known for its speed, flexibility, and ease of use.
- Apache Doris: A modern MPP (massively parallel processing) analytical database designed for high-performance, real-time analytics with minimal operational overhead.
Explore how these databases integrate seamlessly with Bold Data Hub to support scalable, real-time reporting.
How to Get Started with Bold Data Hub in Bold Reports
To begin using Bold Data Hub:
- Install Python 3.9: Python 3.9 must be installed on your machine.
- Configure Python Path: Locate the configuration file, then update the “PythonPath” entry with the correct path to your Python installation.
- Restart IIS Server: After updating the Python path, restart the IIS server to apply changes.
"PythonPath": "<Drive>:\BoldServices\Python39"
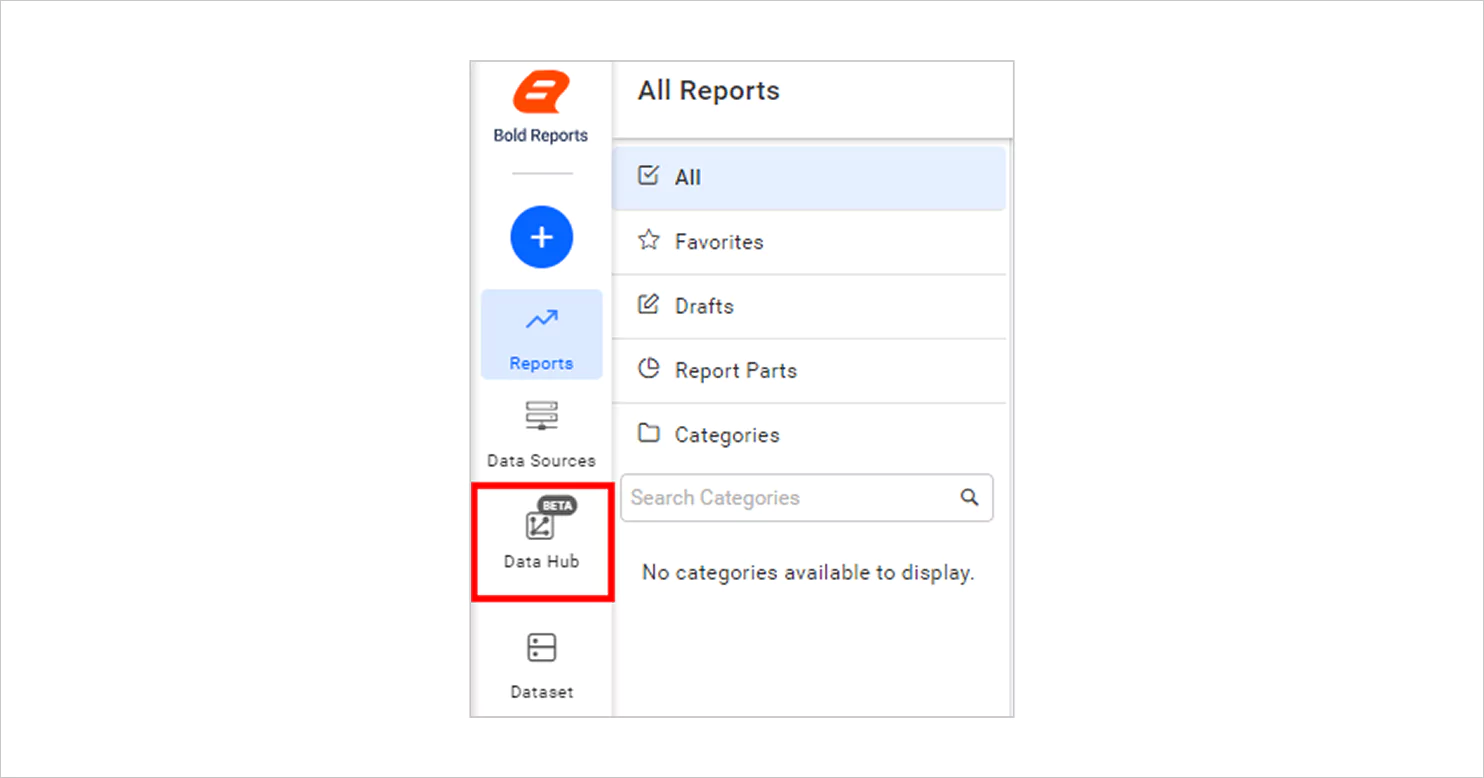
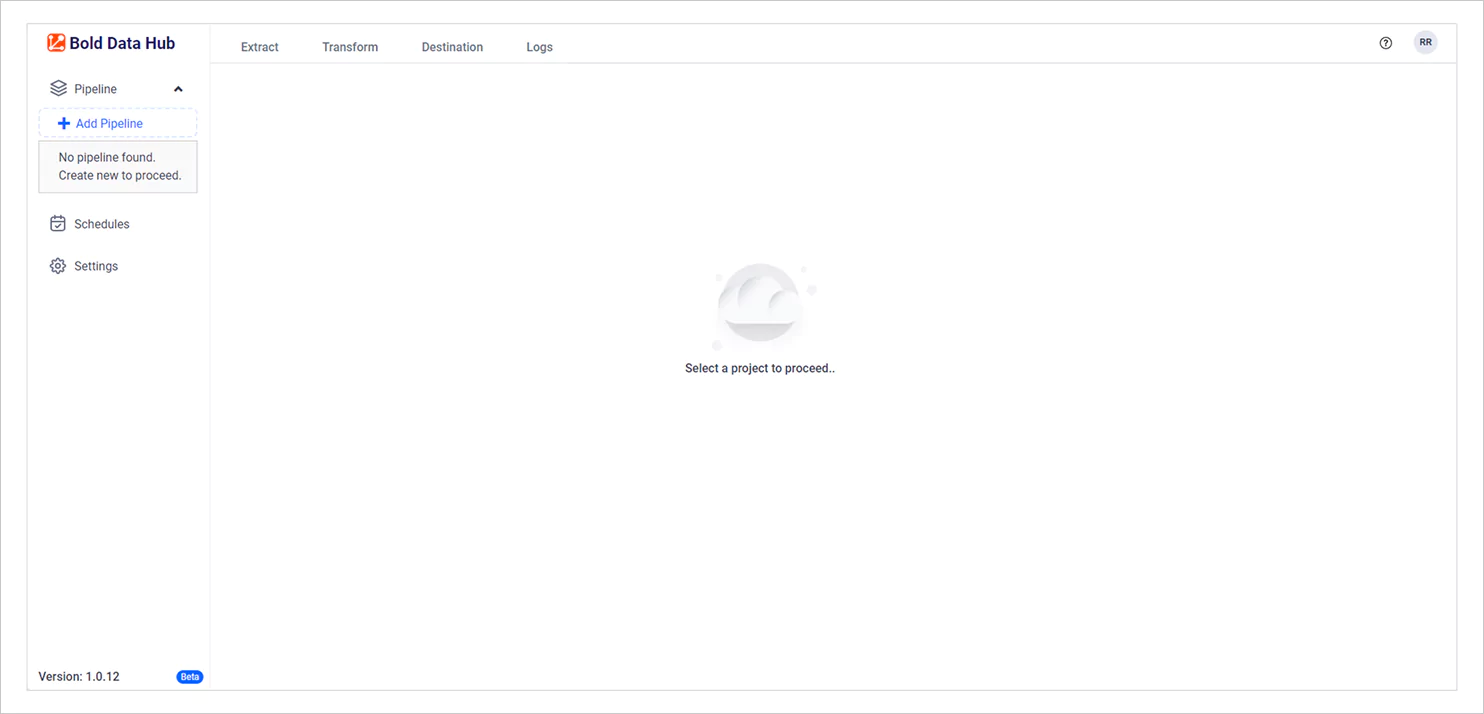
- Access Data Hub: Click the Data Hub icon in the Bold Report interface. It will open in a new tab showing the Data Hub homepage as shown below.
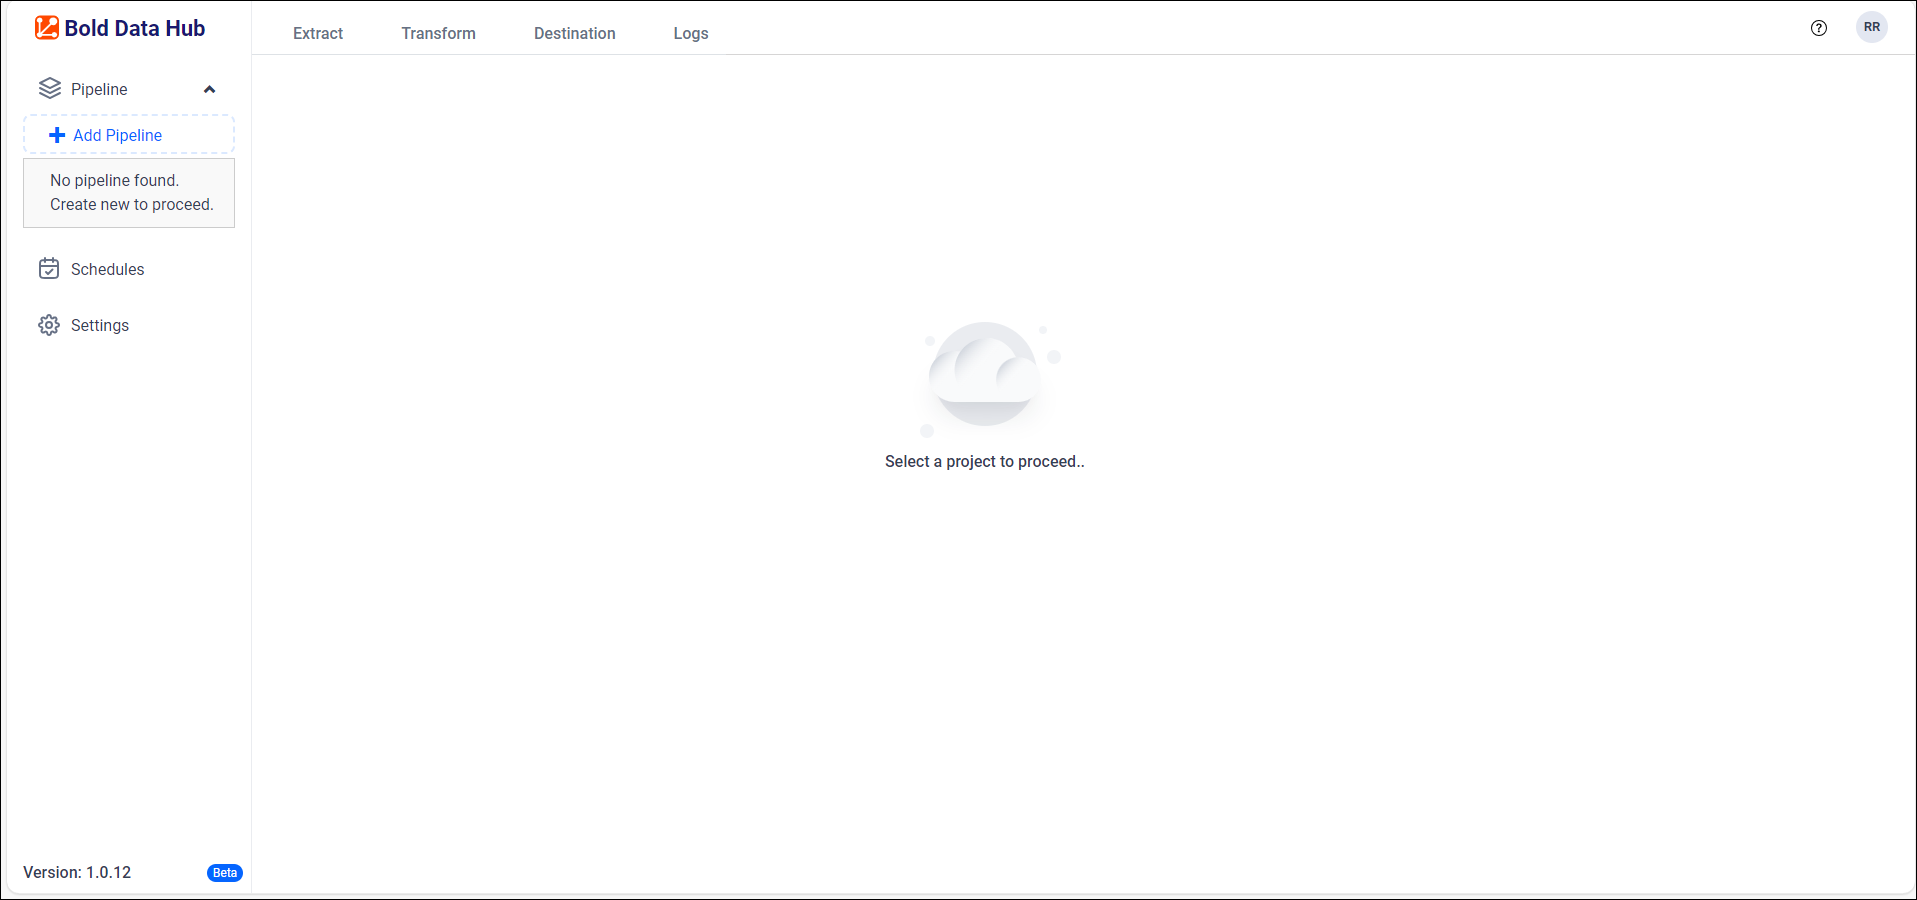
Now, you’re ready to configure your ETL workflows and start building smarter reports.
How to Add Bold Data Hub ETL Services in Bold Reports
To add ETL services within Bold Reports, begin by:
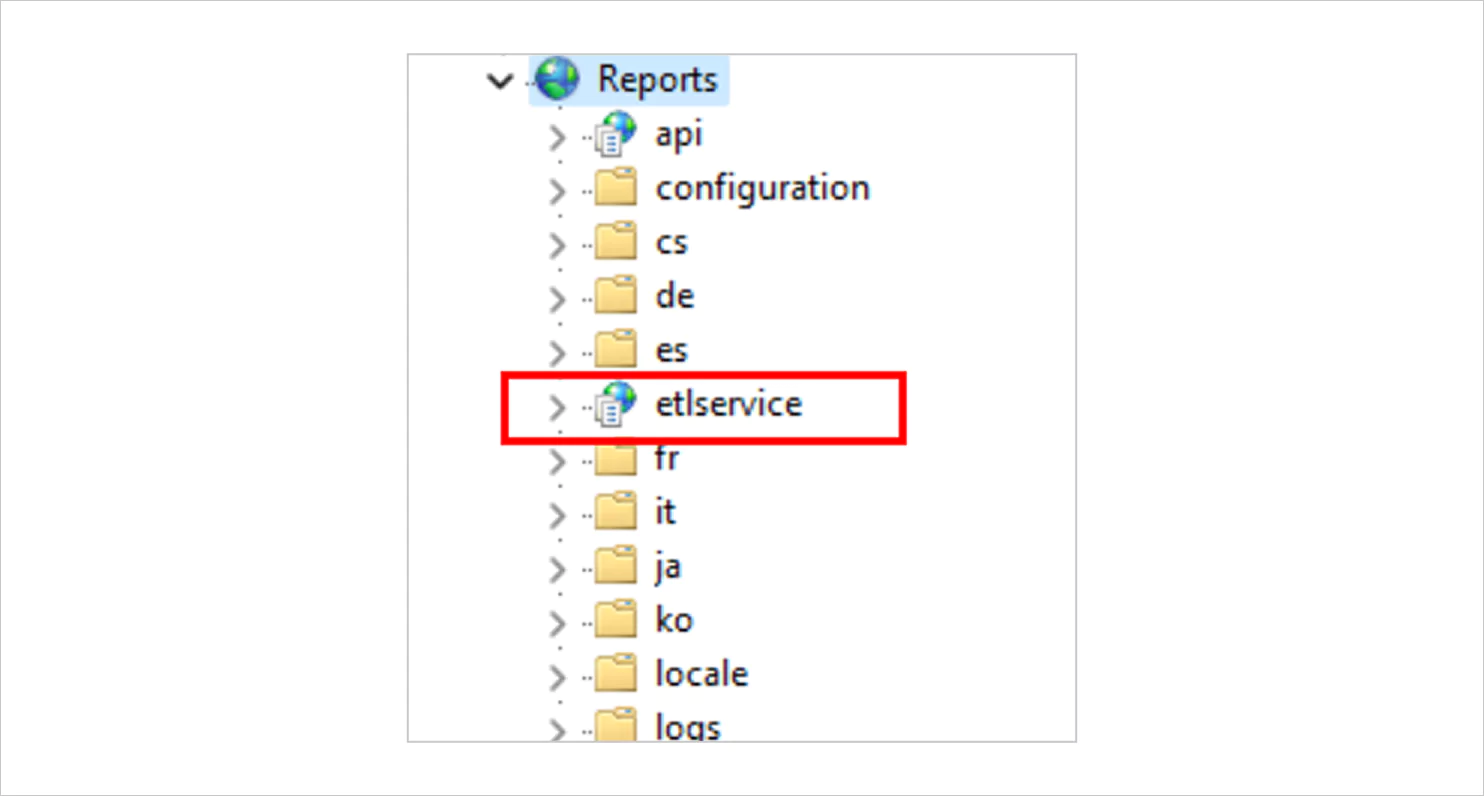
- Confirming whether etlservice was added to the IIS application, as shown in the image below.
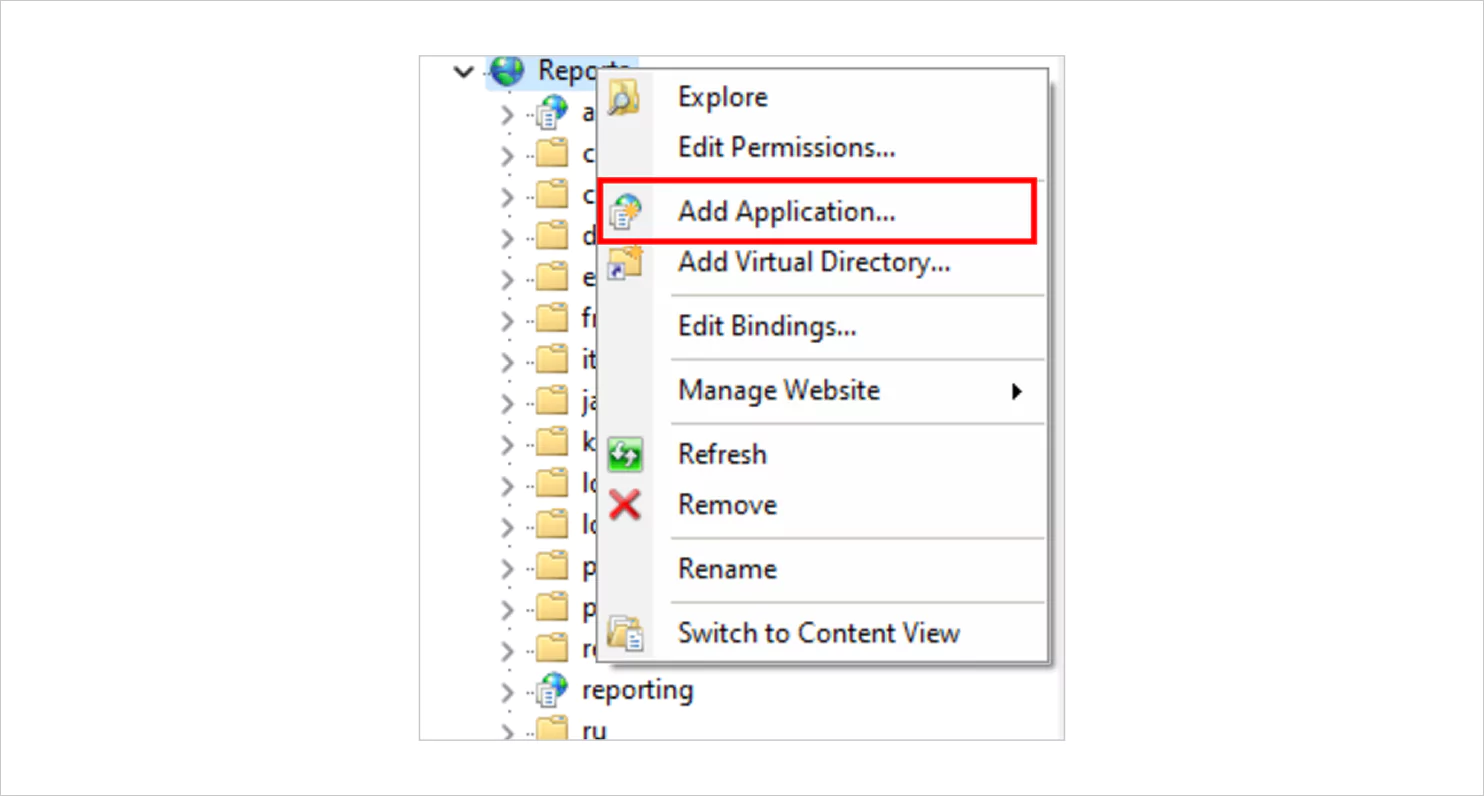
- Then, right-click subapp in IIS and click Add Application option.
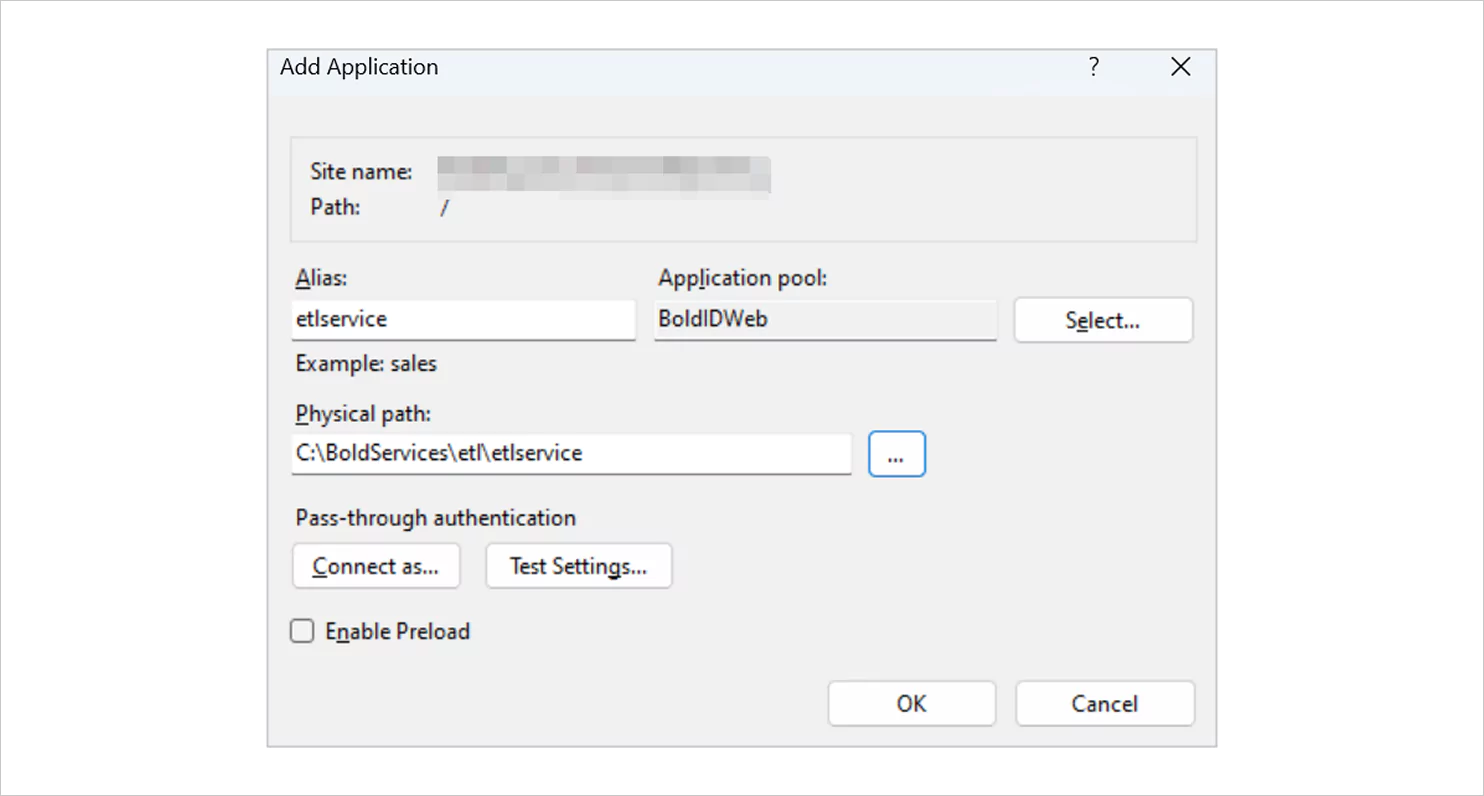
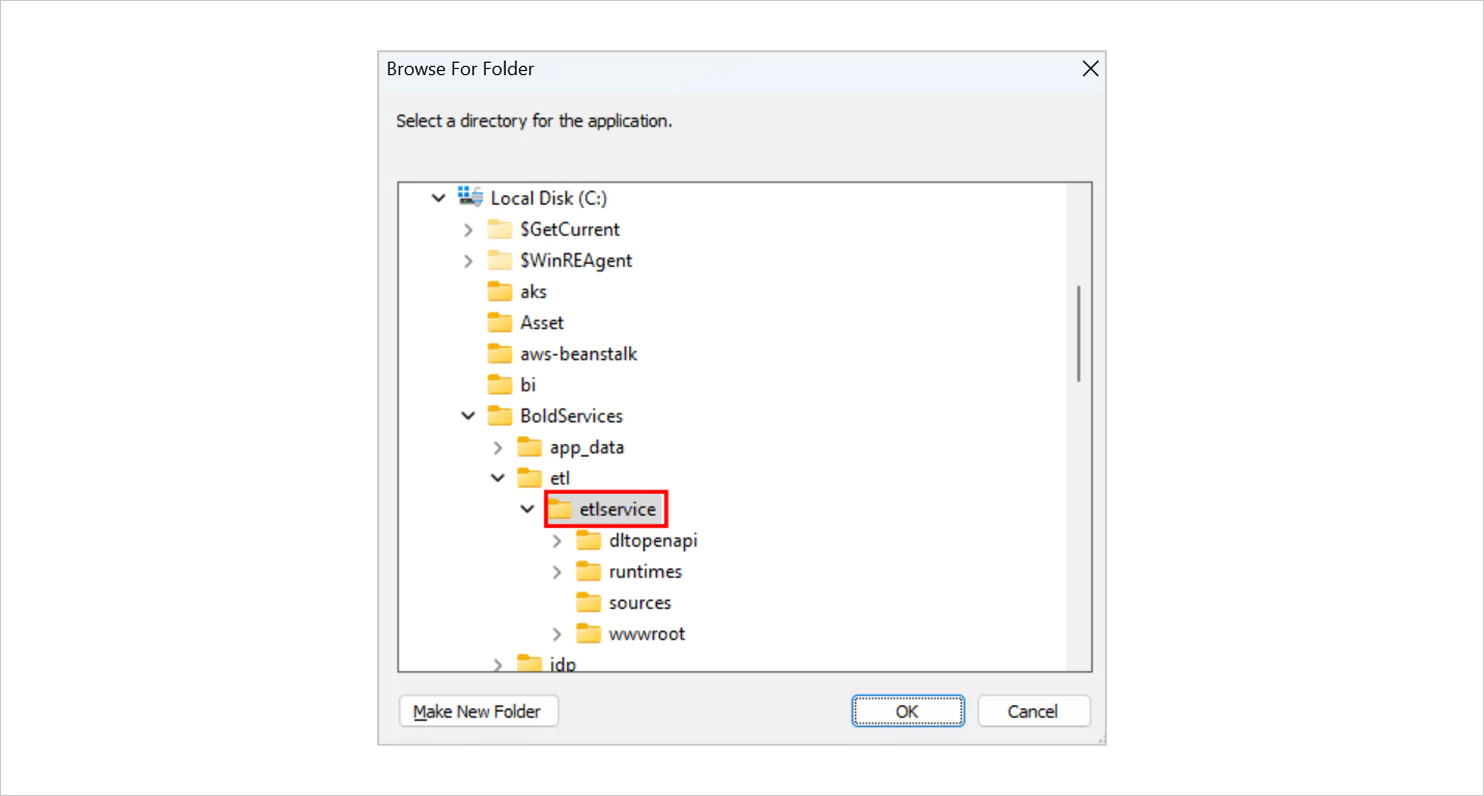
- Enter the alias name as etlservice then add the Physical Path as {drive}:\BoldServices\etl\etlservice to continue.
- Finaly, click OK option to continue. Restart the IIS and try again.
Now, we can take you through how to schedule ETL jobs to keep your data pipeline running smoothly.
How Do You Schedule ETL Jobs in Bold Data Hub?
In Bold Data Hub, you can schedule pages that contain lists of project names, which allow you to configure on-demand or interval-based schedules, as shown below.
Let’s explore them in detail.
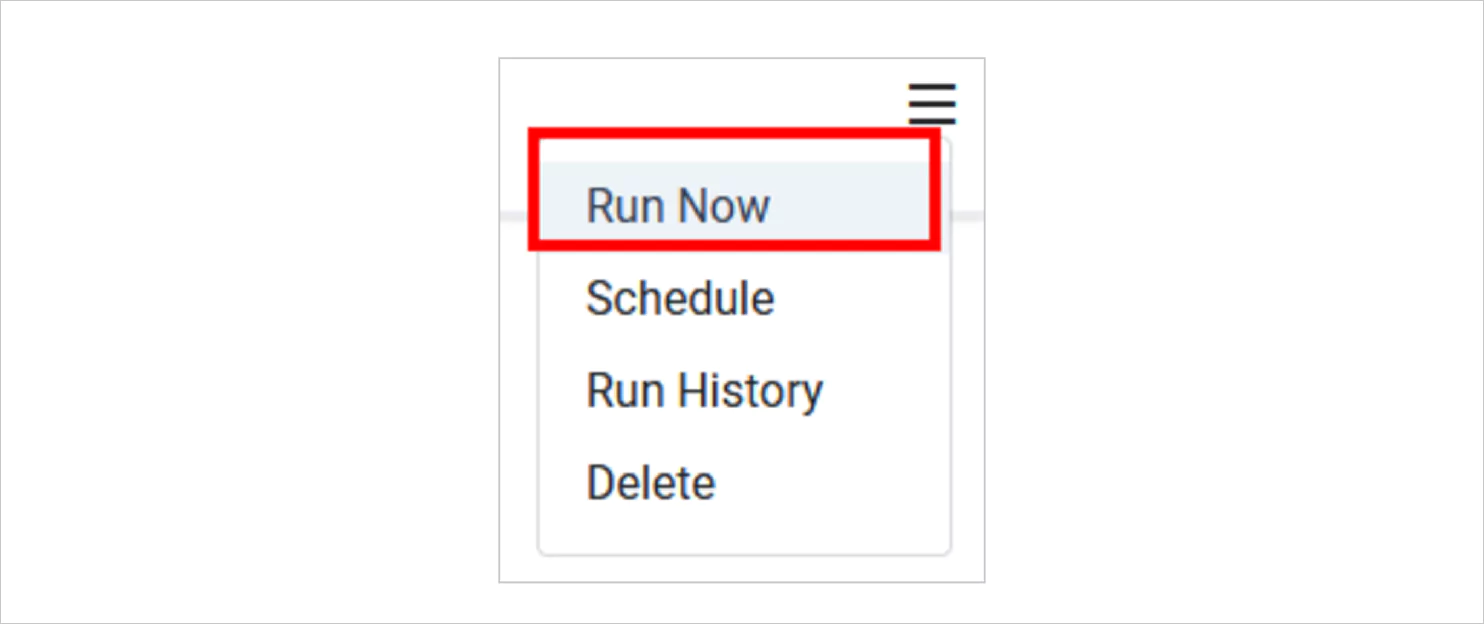
- On-Demand Schedule: To manually trigger a data refresh, select Run Now from the context menu in the data source grid. Note: this option is only available if the project has been saved under the Load tab.
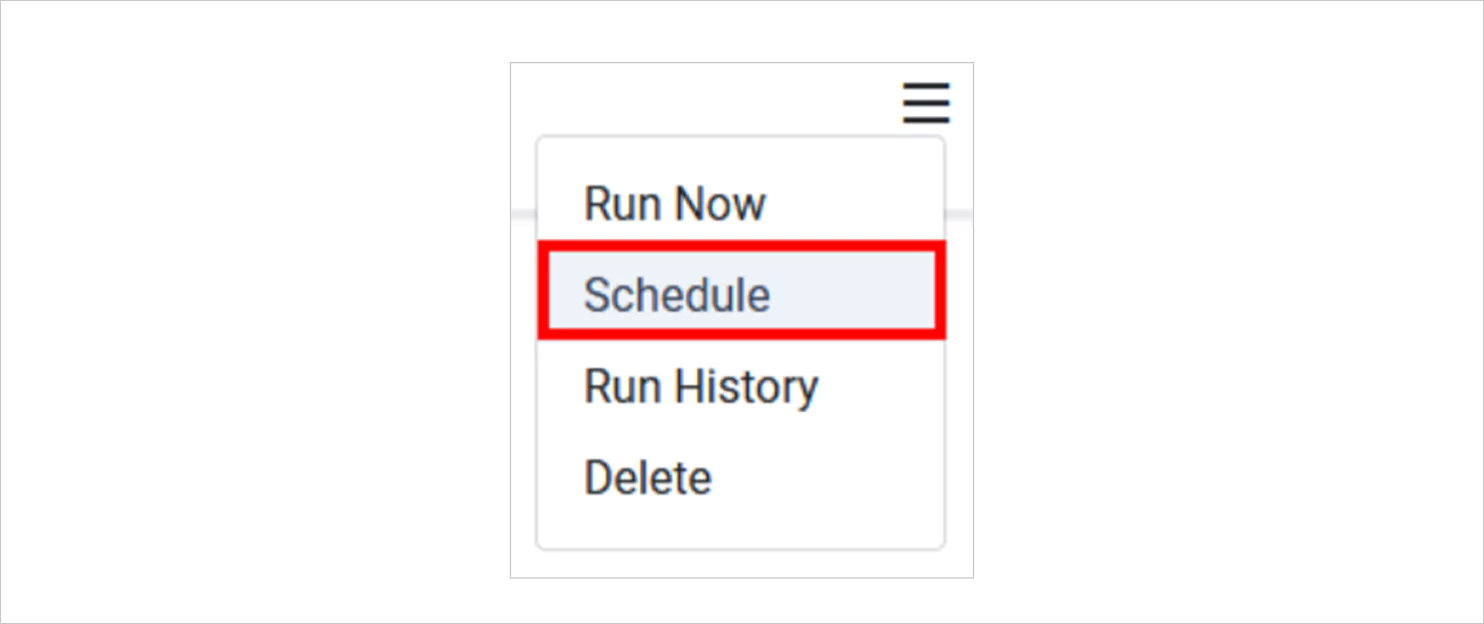
- Interval Schedule: For automated refreshes, click Actions in the data source grid and choose Schedule option.
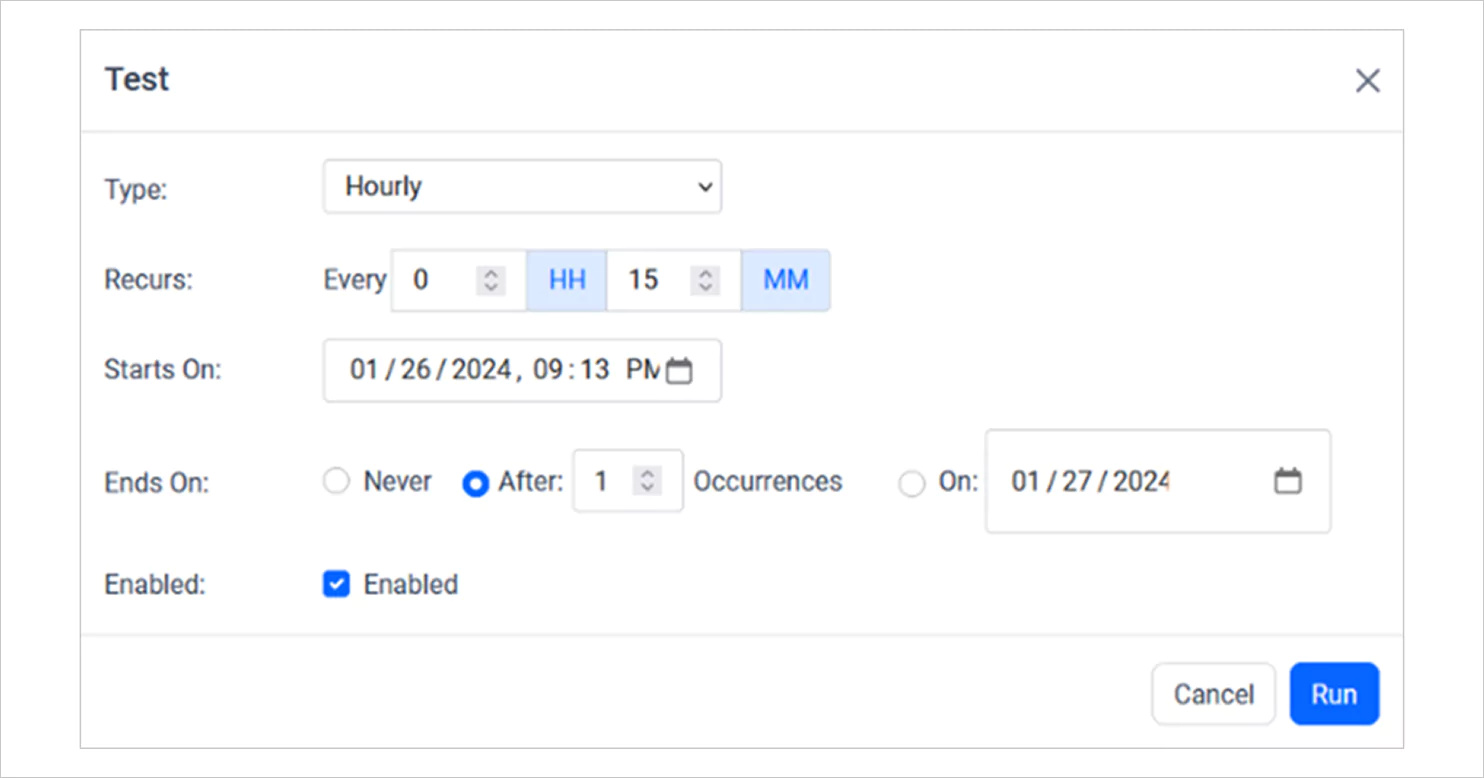
In the Refresh Settings dialog, define the recurrence type, frequency, start date, and end date to suit your workflow.
Conclusion
Bold Data Hub isn’t just an ETL tool, it’s a complete data platform for reporting. With support for diverse connectors, code-free transformation, and automated scheduling, it simplifies data management and strengthens your reporting pipeline. For more insight into how Bold Data Hub works within Bold Reports®, explore “Working with Bold Data Hub” and “Scheduling ETL Jobs” in Bold Data Hub, as well as the “Bold Reports Data Hub Overview” and “Getting Started with Bold Data Hub.”
Ready to experience the future of centralized reporting? Start your 30-day free trial or request a free demo today to unlock smarter, faster reporting with Bold Reports.





