
Scatter charts serve as powerful tools in data visualization, offering a clear and concise way to compare numerous data points. Their simplicity lies in their ability to present data points as dots, allowing for easy identification of patterns, trends, and correlations. Whether analyzing sales figures, market trends, or scientific data, scatter charts provide invaluable insights at a glance, making them indispensable in data analysis and decision-making.
With Bold Reports®, it’s easy to create stunning and informative scatter charts that will help you make data-driven decisions with confidence.
When to Use a Scatter Chart
Scatter charts are best utilized when you need to visualize and analyze data points that have two numeric parameters. These charts are useful for identifying patterns between variables. Here are some scenarios where using a scatter chart is beneficial:
- Identifying Trends: Scatter charts are excellent for showcasing trends over time. You can use scatter chart to present how data points evolve relative to one another, enabling users to identify patterns, cycles, or anomalies that may influence their analysis.
- Visualizing Correlations: When you need to illustrate the correlation between two numerical variables in your dataset, a scatter chart provides a clear and intuitive visualization. It allows viewers to grasp the strength and direction of the correlation at a glance.
- Highlighting Outliers: Outliers can significantly impact your data analysis. By incorporating a scatter chart, you can easily identify outliers as data points that deviate from the general pattern, helping viewers understand their impact on the dataset.
- Detecting Clusters or Categories: In some datasets, data points may naturally cluster together, indicating distinct categories. Scatter charts can reveal these clusters, providing insights into underlying patterns or trends that may not be immediately apparent from the data alone.
How to Create a Scatter Chart with Bold Reports
- Create data
We need to create a data source and dataset first. In this case, we are going to use the AdventureWorks database. Following the Bold Reports documentation, we create a data source and generate a dataset for the report by using the following query.
SELECT PC.Name AS ProdCat, PS.Name AS SubCat, DATEPART(yy, SOH.OrderDate) AS OrderYear, 'Q' + DATENAME(qq, SOH.OrderDate) AS OrderQtr,SUM(SOD.UnitPrice * SOD.OrderQty) AS Sales
FROM Production.ProductSubcategory PS INNER JOIN
Sales.SalesOrderHeader SOH INNER JOIN
Sales.SalesOrderDetail SOD ON SOH.SalesOrderID = SOD.SalesOrderID INNER JOIN
Production.Product P ON SOProduction.ProductCategory PC ON PS.ProduD.ProductID = P.ProductID ON PS.ProductSubcategoryID = P.ProductSubcategoryID INNER JOIN
ctCategoryID = PC.ProductCategoryID
WHERE (SOH.OrderDate BETWEEN '1/1/2002' AND '12/31/2003')
GROUP BY DATEPART(yy, SOH.OrderDate), PC.Name, PS.Name, 'Q' + DATENAME(qq, SOH.OrderDate), PS.ProductSubcategoryID
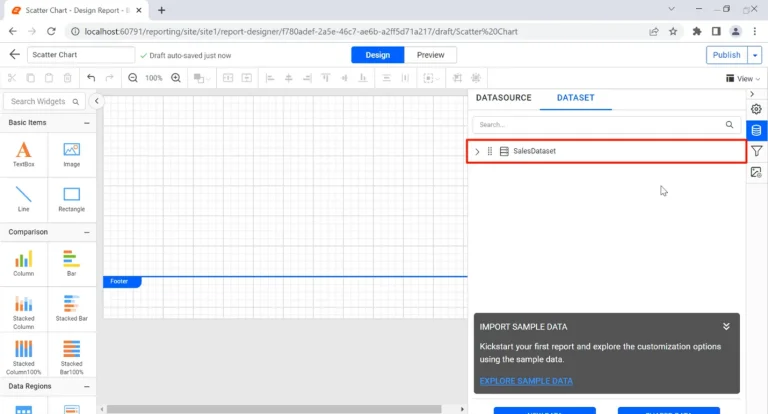
The SalesDataset is created in the report.
- Add scatter charts to the report
Let’s add a scatter chart to the report. Scatter charts are located under the Distribution category in the item panel. Simply drag the scatter chart from the item panel into the design area.
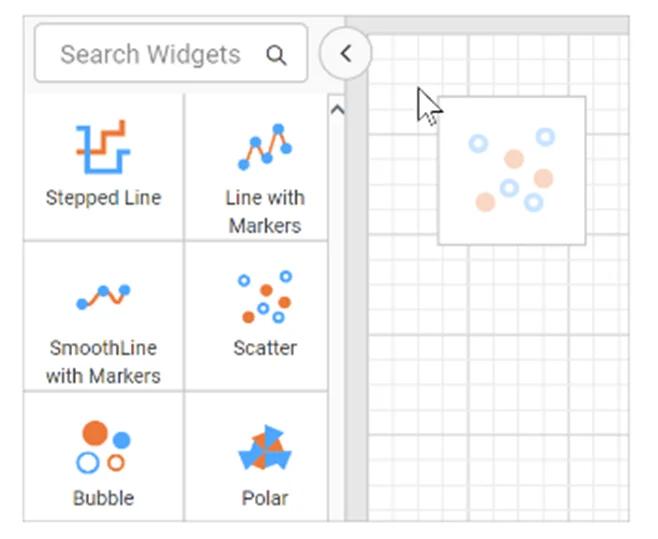
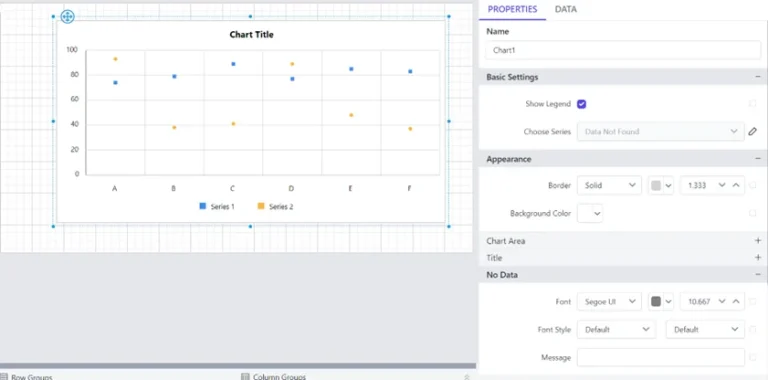
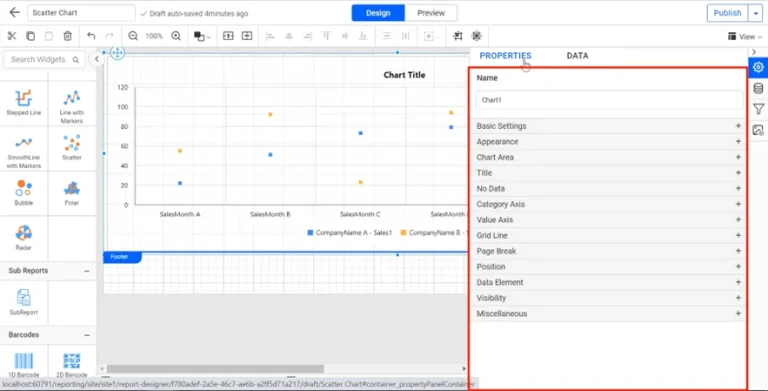
The scatter chart will appear in the design area, with its corresponding properties listed in the properties panel.
- Assign data to the scatter chart
To assign data to the scatter chart, click the data tab on the properties panel. The fields in the dataset will be displayed. The numeric columns and expressions are listed in the Measures section while the remaining types of expressions and dimensions are listed in the Dimensions section.
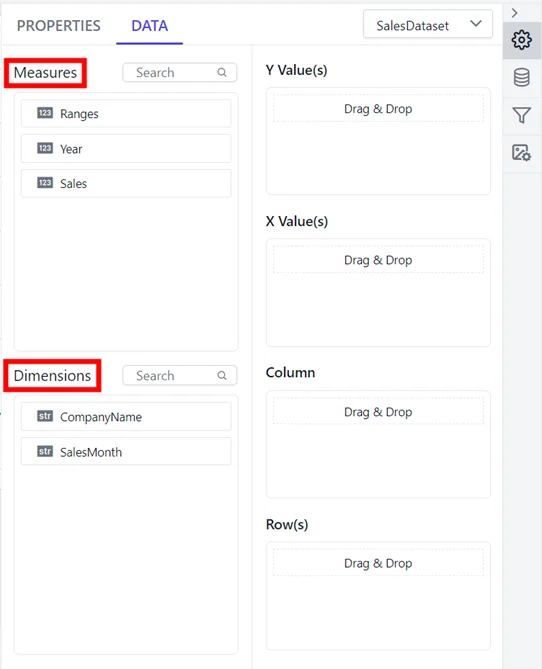
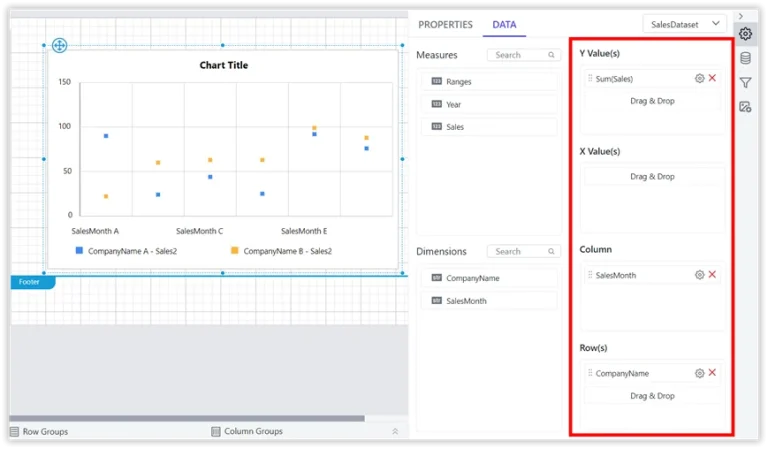
Drag the fields from the measures and dimensions sections to assign values. When assigning data in each field, the chart is refreshed in the design area.
- Format the scatter chart
Formatting the scatter chart will help in enhancing chart’s effectiveness by ensuring it’s both visually appealing and informative. To format our scatter chart, we click properties to display the properties panel.
- Preview the report
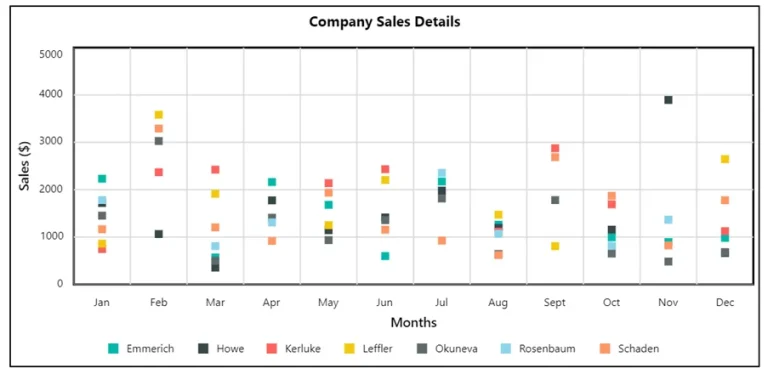
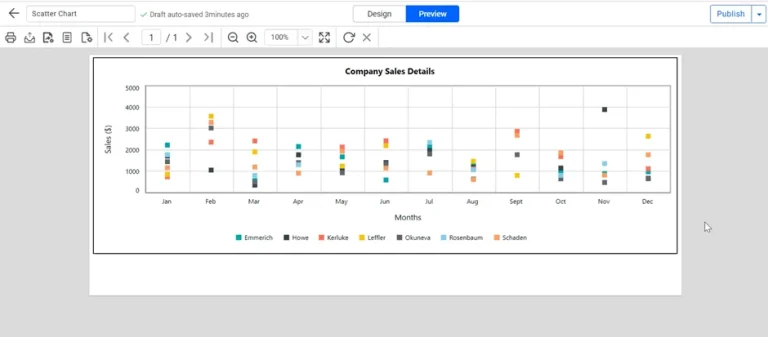
To preview the report, we switch from Design to Preview in the top panel. The Sales field value is grouped based on the company name field and measured against SalesMonth field values.
Conclusion
Scatter charts are a great tool for data analysis, offering a clear and concise way to compare data points and identify patterns. By following the steps outlined in this guide, users can effectively integrate scatter charts into their reports, enhancing the presentation of data. Explore Bold Reports today by signing up for a 30-day free trial and discover more of its data visualization tools like the one discussed in this blog.