







Report Designer for Blazor
Web-based report designer that transforms your data into insightful SSRS RDL/RDLC reports without a single line of code.
-
Build reports faster with minimal effort.
-
Works with your current tech stack without complexity.
-
Full control over design, layout, and behavior.
No credit card required.
J&J
Schneider
Bridgestone
Siemens
Verizon
HP
Fidelity
Intel
Overview
Blazor Report Designer, also known as Blazor Report Builder, is a feature-rich component for creating SSRS RDL and RDLC reports effortlessly. Connect to data sources, and create datasets, queries, interactive parameters, and subreports. Using report items like charts, grids, and more, create visually appealing paginated reports without coding. Access control allows tailored permissions for secure reporting.
Powerful Blazor Report Designer Capabilities
Build and manage reports with a complete, end-to-end solution designed to support diverse reporting requirements across teams, customers, and business applications.
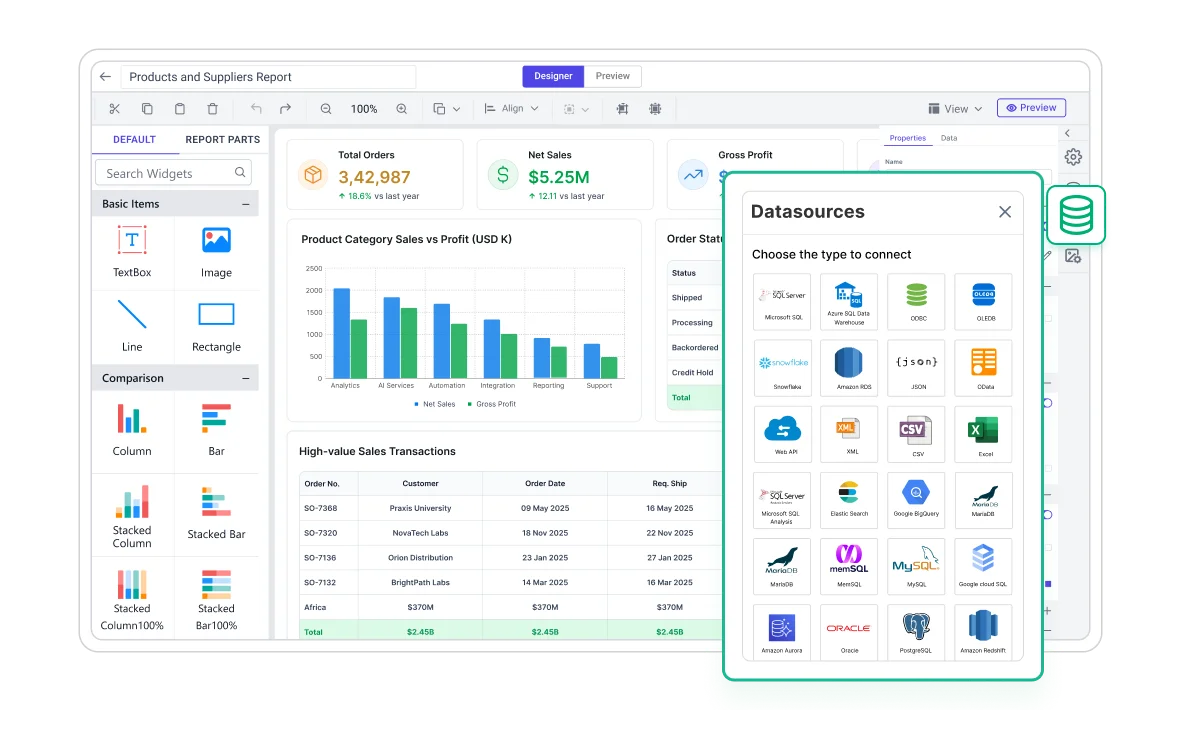
Connect to any datasource
Consume data from a wide variety of data providers in local or server databases:
-
Built-in data sources: Microsoft SQL Server, Microsoft SQL Azure, Web API, OData, PostgreSQL, MySQL, MariaDB, MemSQL, JSON, XML, CSV, Excel, Oracle, OLEDB, and ODBC.
-
Business object data sources: JSON.
-
Custom data processing extensions: SASS.
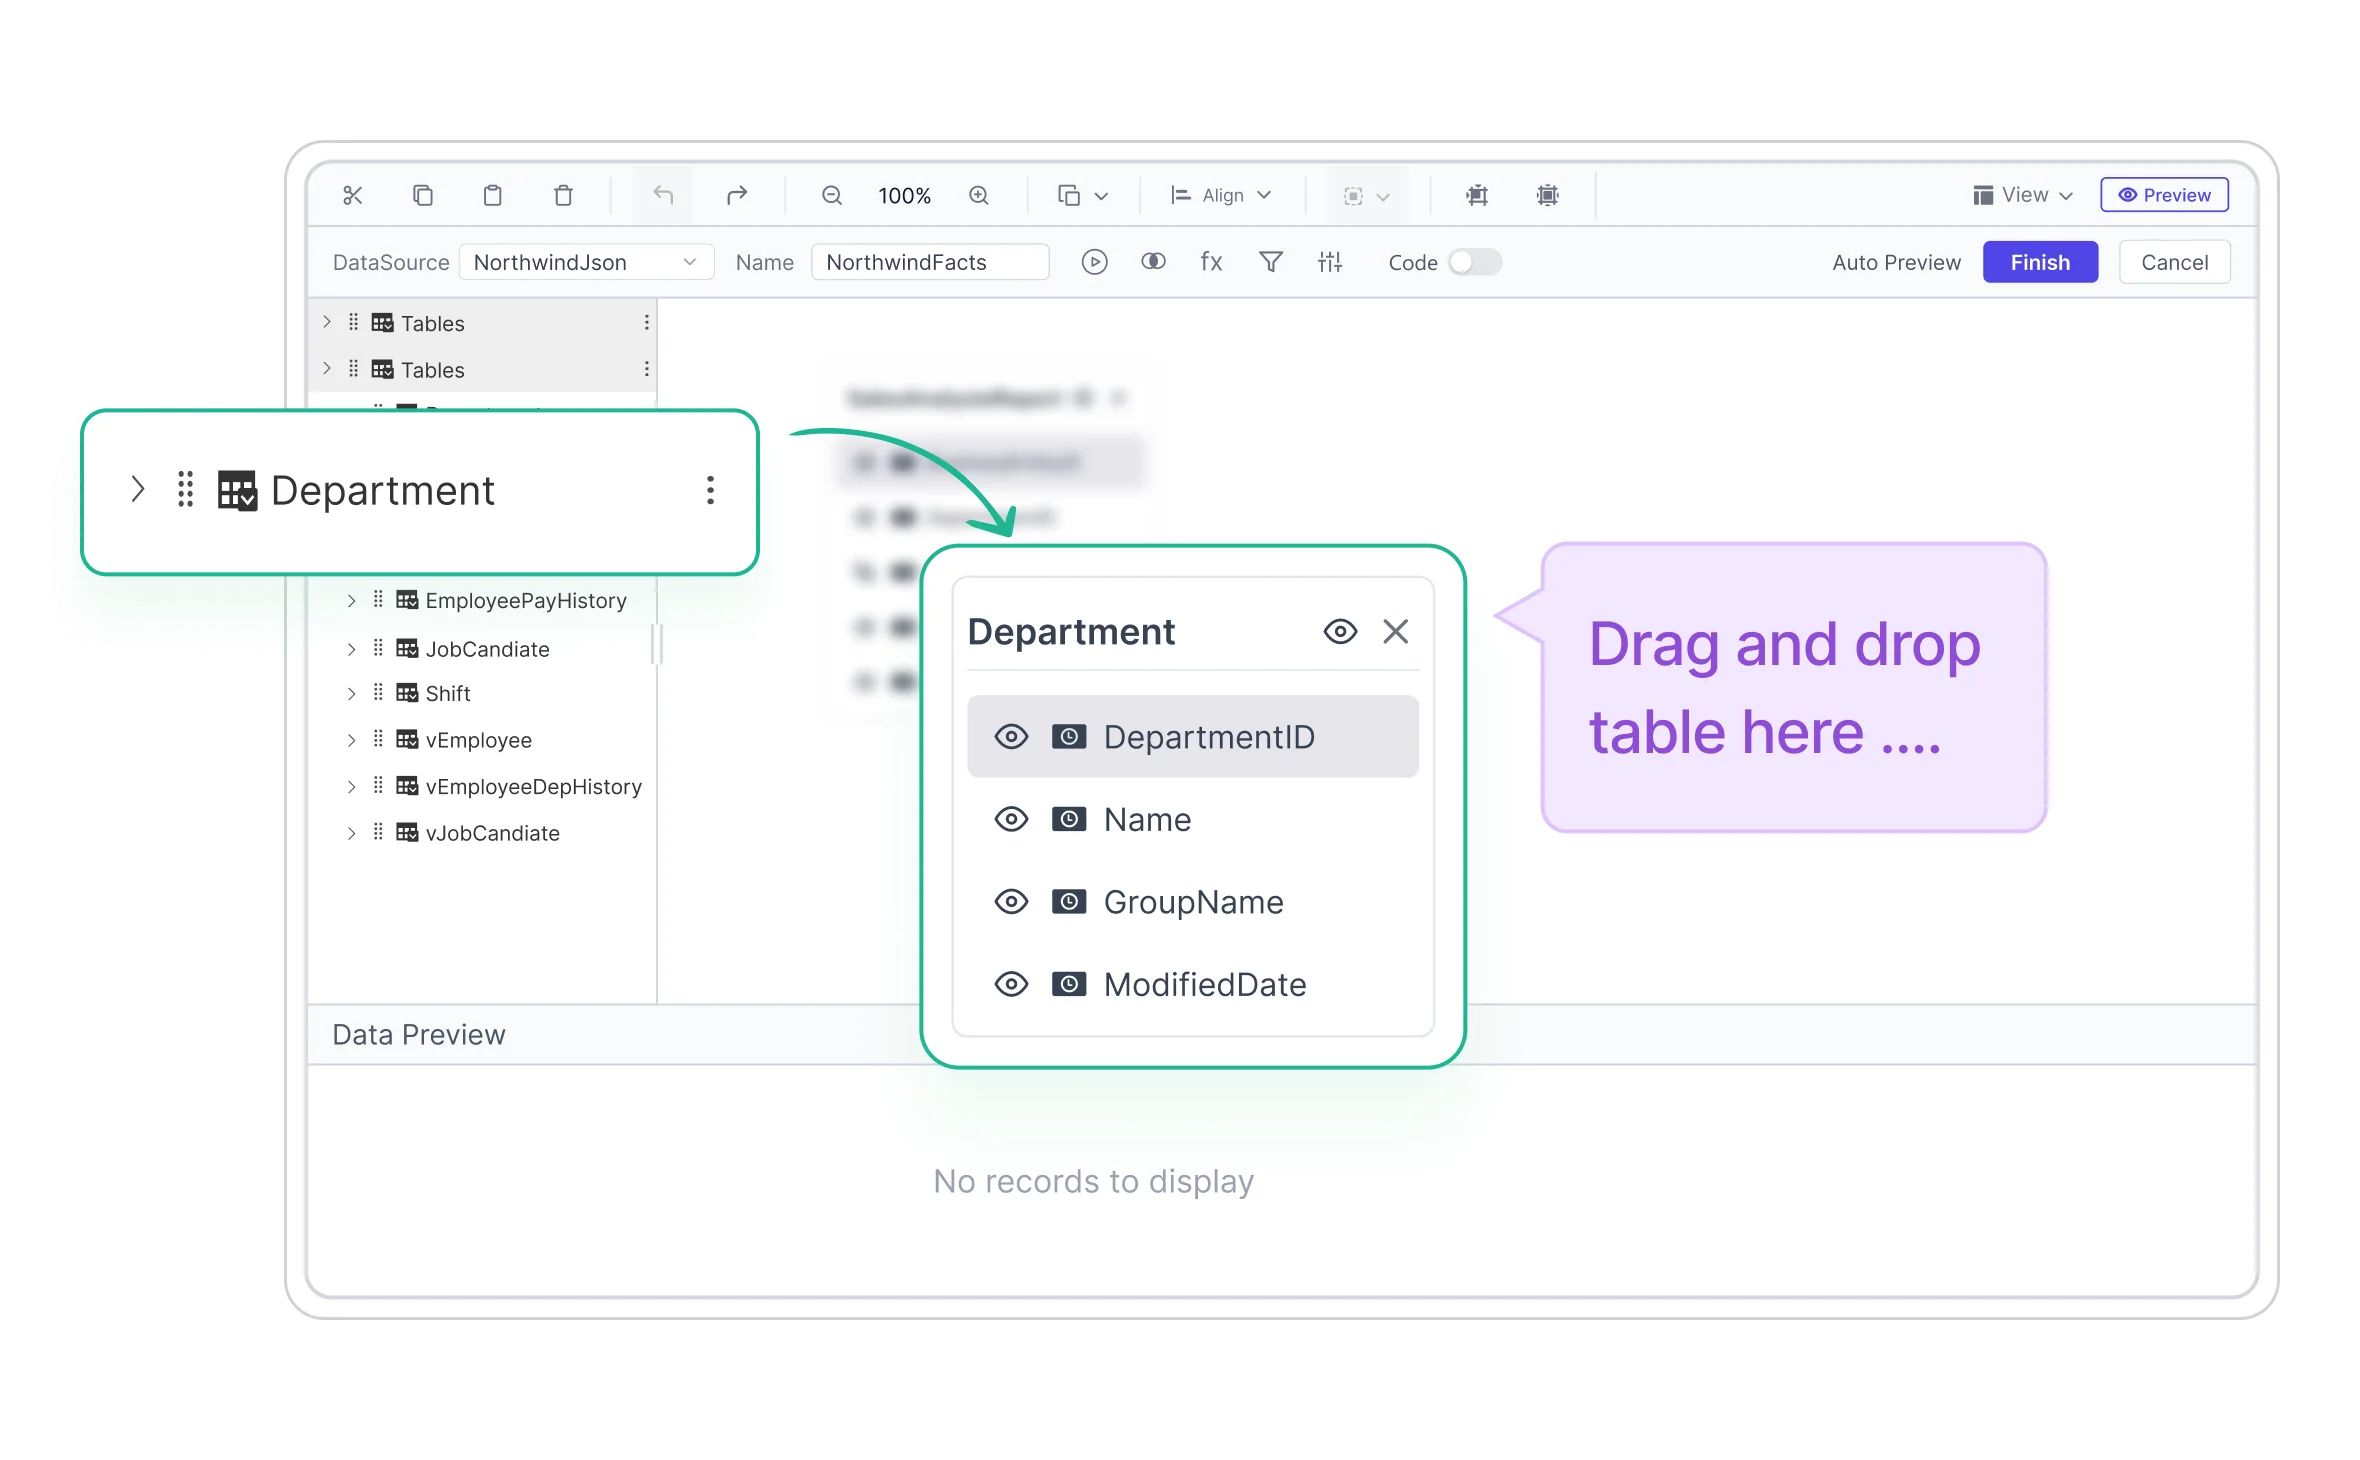
Create data models with an easy-to-use query builder
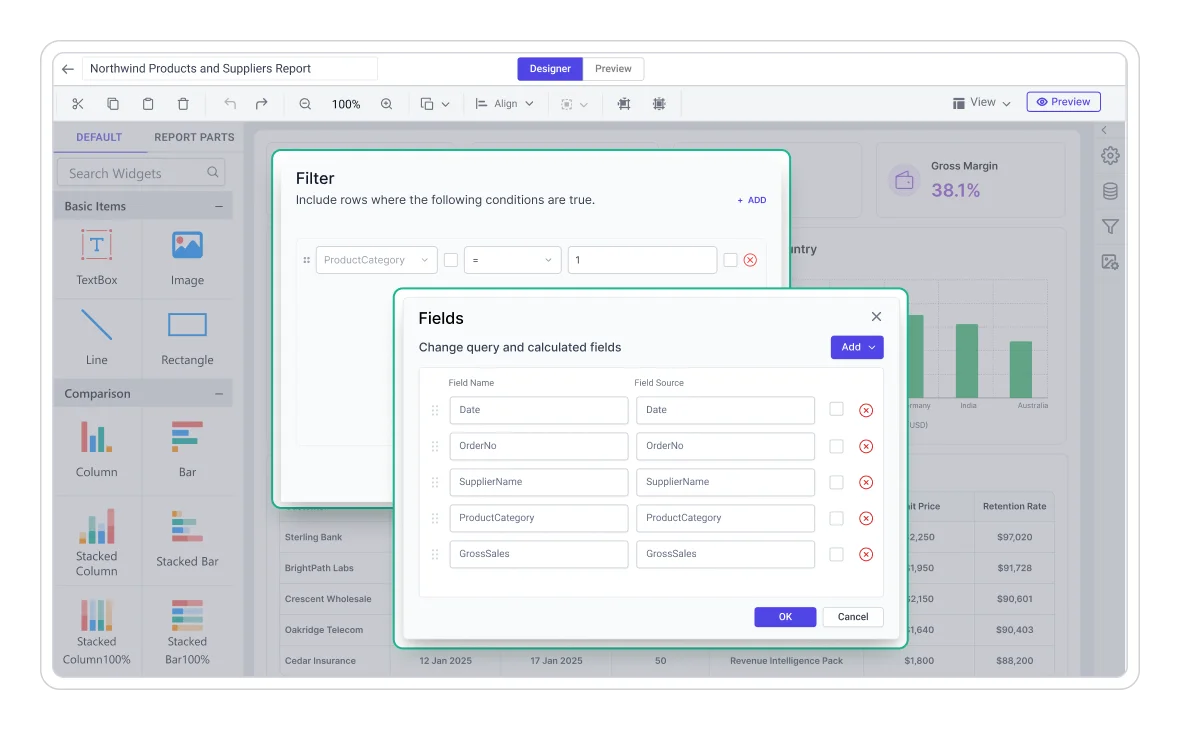
Data query preparation is time consuming , but with our Blazor Report Designer, query generation can be done with a few clicks. The easy-to-use drag-and-drop query builder helps both technical and nontechnical users to create and view relationships between tables.
Eye-popping data visualization
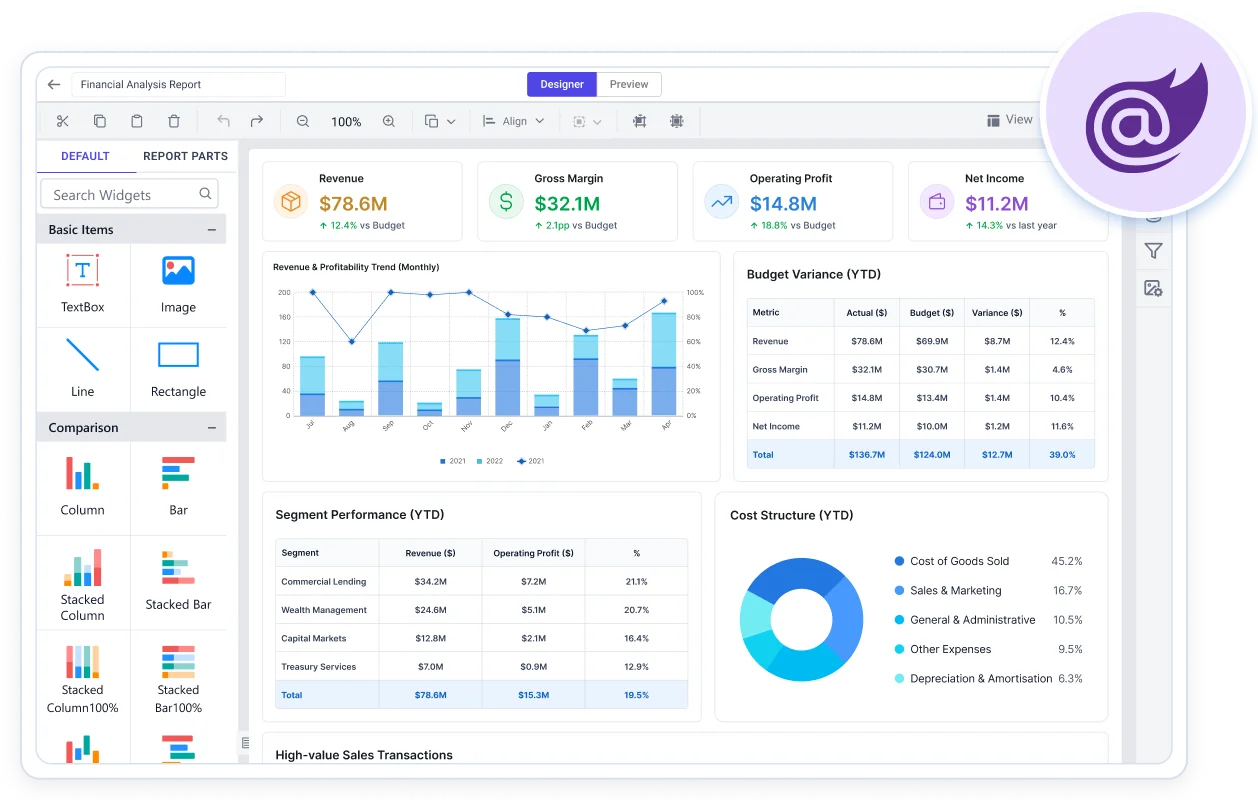
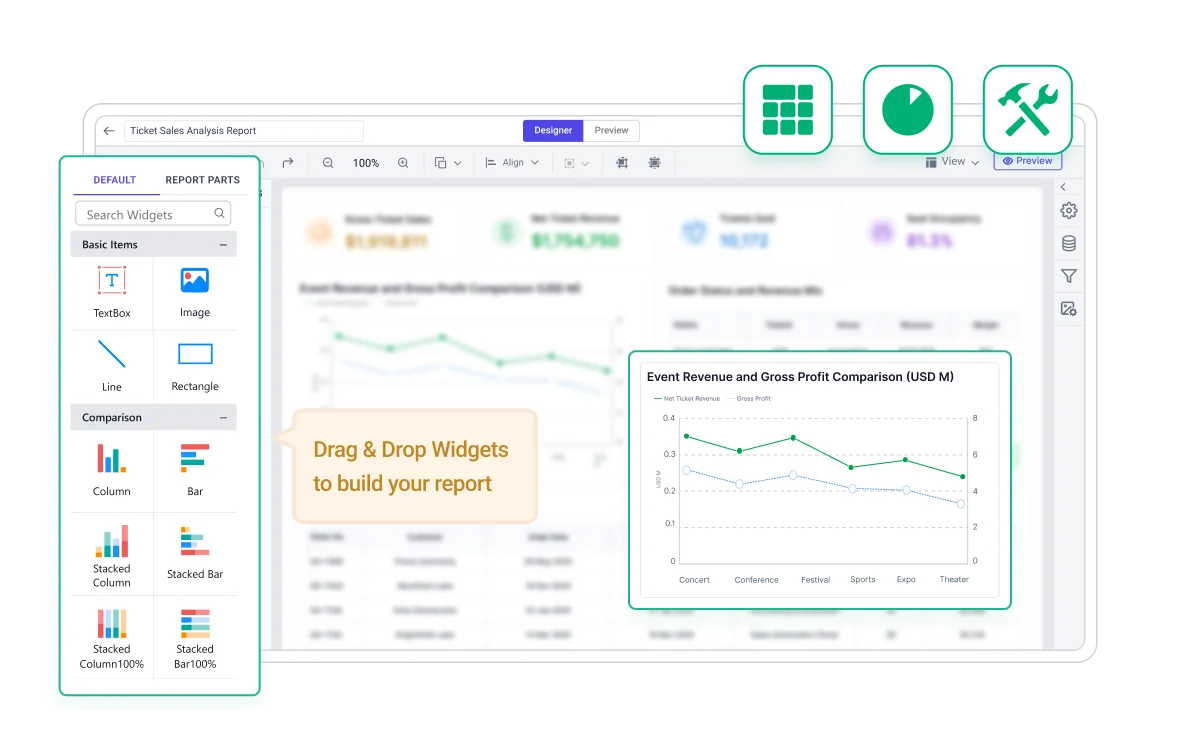
Create and visualize powerful insights from your data using a variety of report items:
-
Basic items: Text box, image, line, and rectangle.
-
Data region items: Table, matrix (pivot table), and list.
-
Data visualization: Charts, sparklines, data bars, gauges, indicators, and maps.
-
Custom report items: Barcodes, QR barcodes, E-signature, and more.
Styling and formatting reports
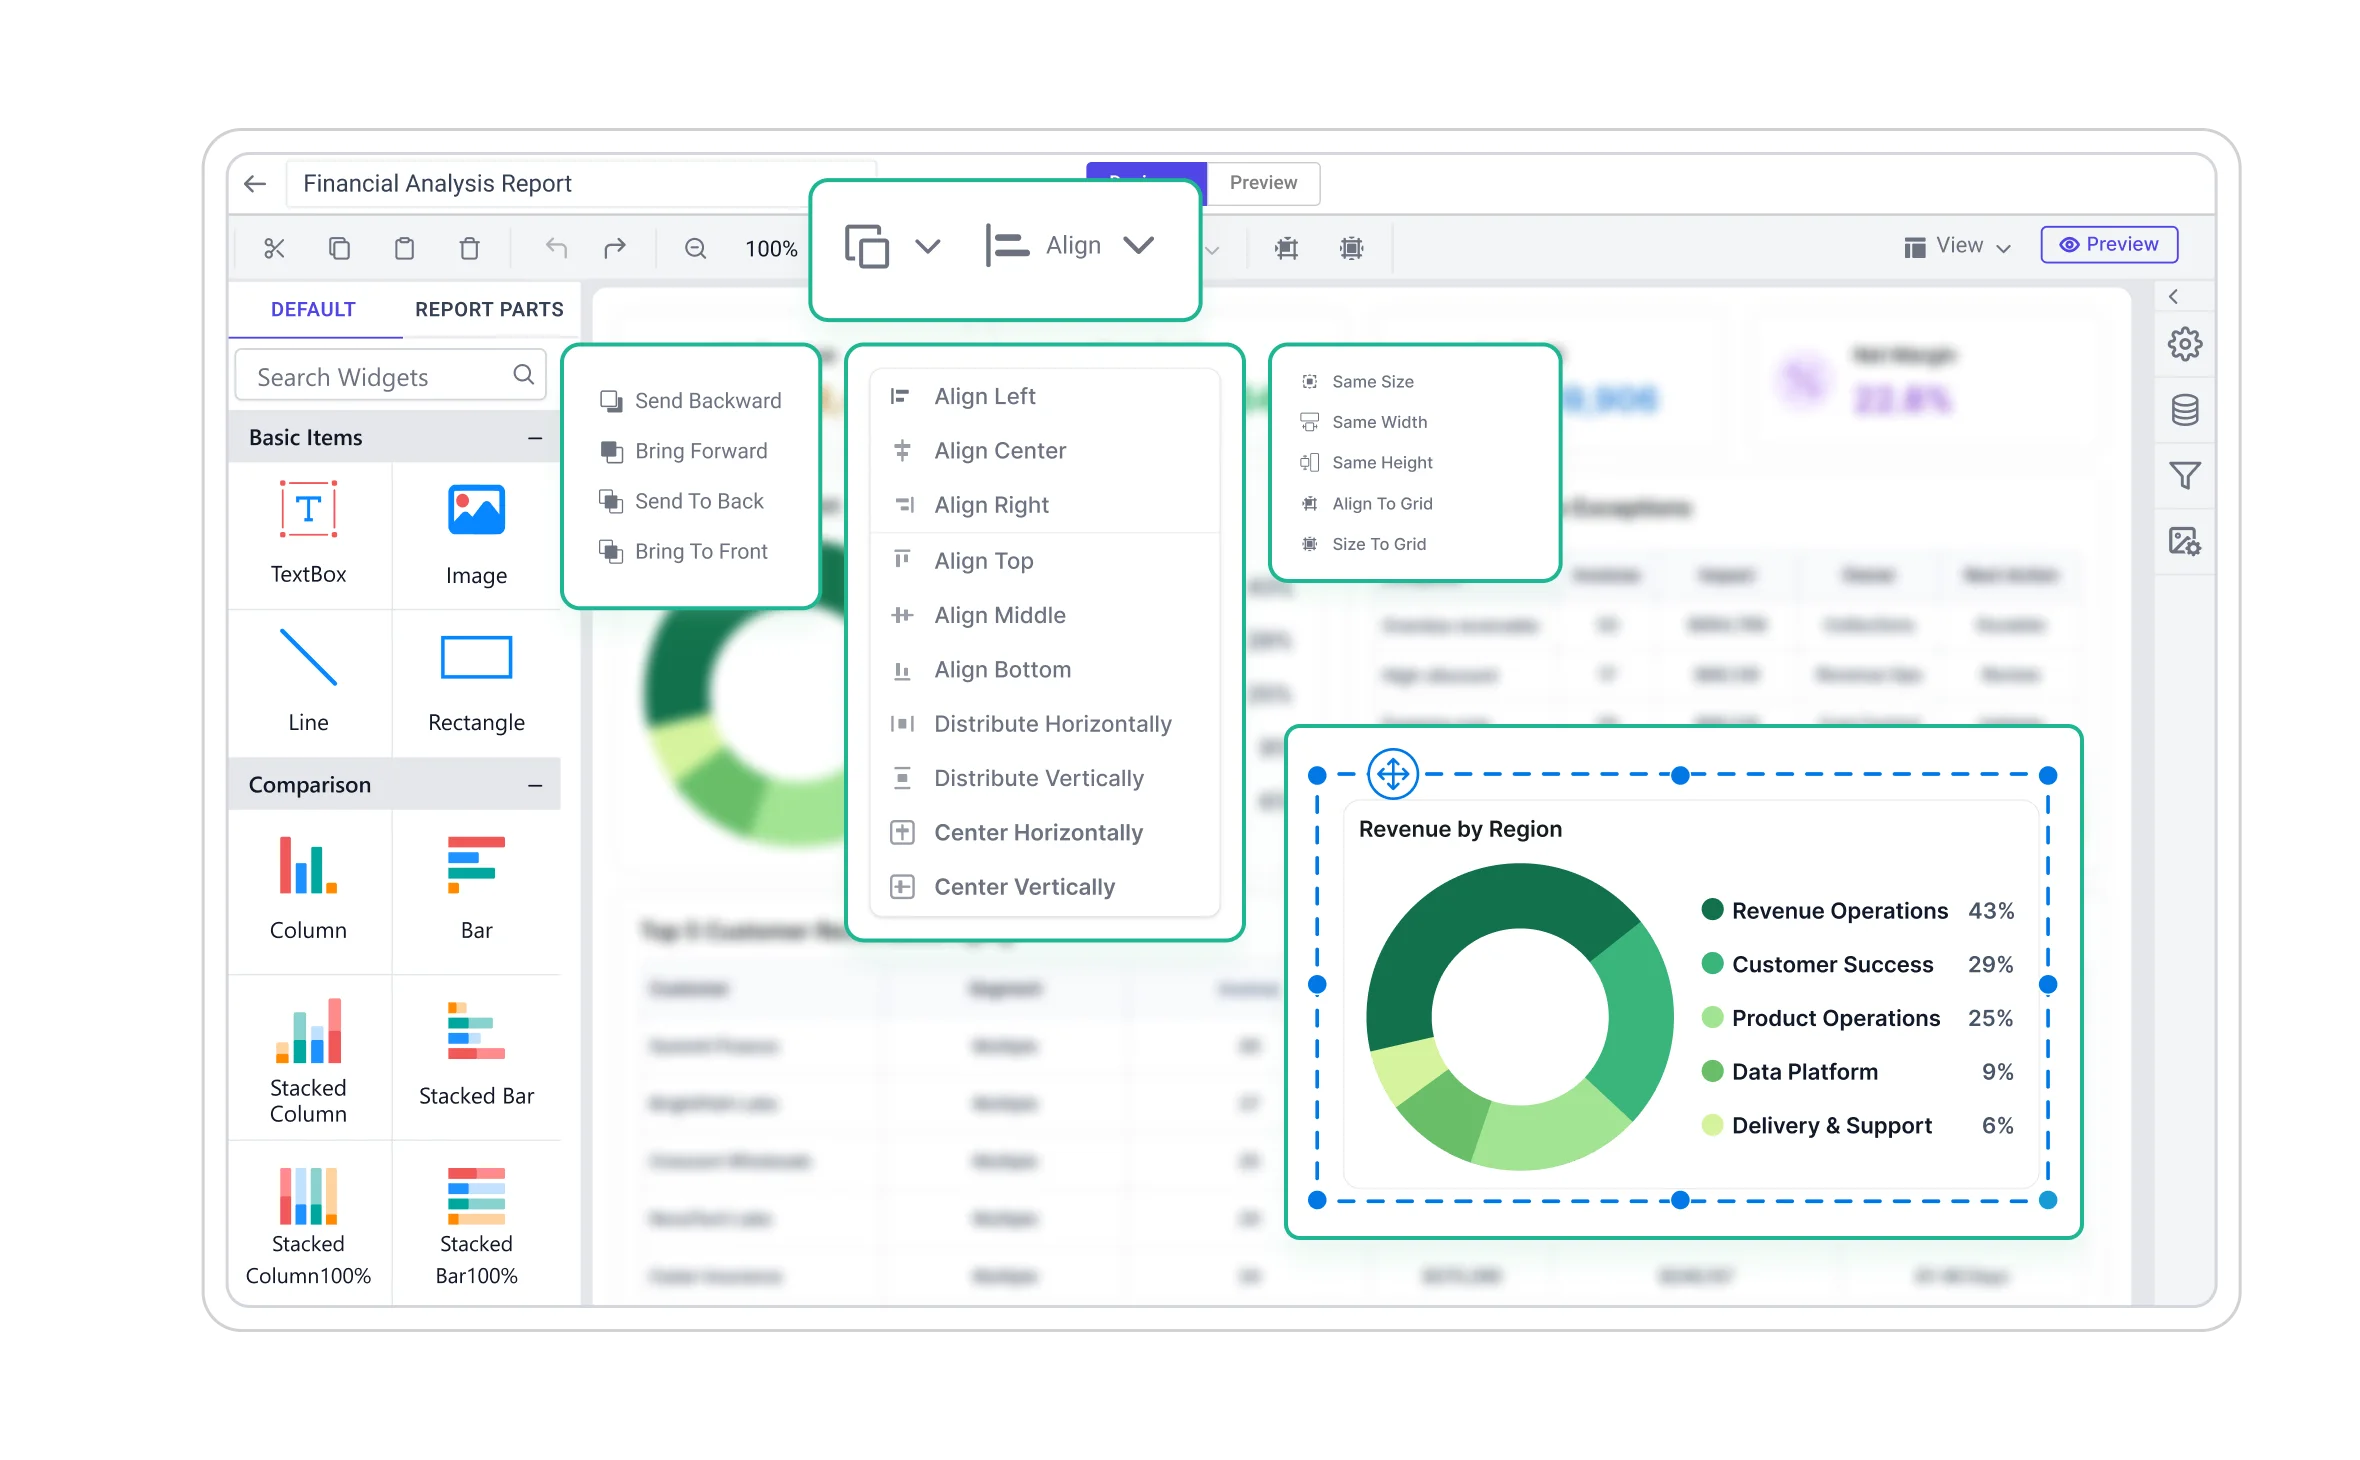
The Blazor Report Designer helps you turn raw data into clear, visually appealing reports that are easy to understand. The WYSIWYG user interface allows the report to be edited in the same form as it is printed or displayed. Furthermore, you can easily edit a report with a mouse, touchscreen, or keyboard interfaces.
Data shaping
Create and view organized and shaped data to make bolder business decisions using the following techniques:
-
Sorting
-
Filtering
-
Grouping
-
Summaries and aggregates
-
Calculated fields
Report parameters
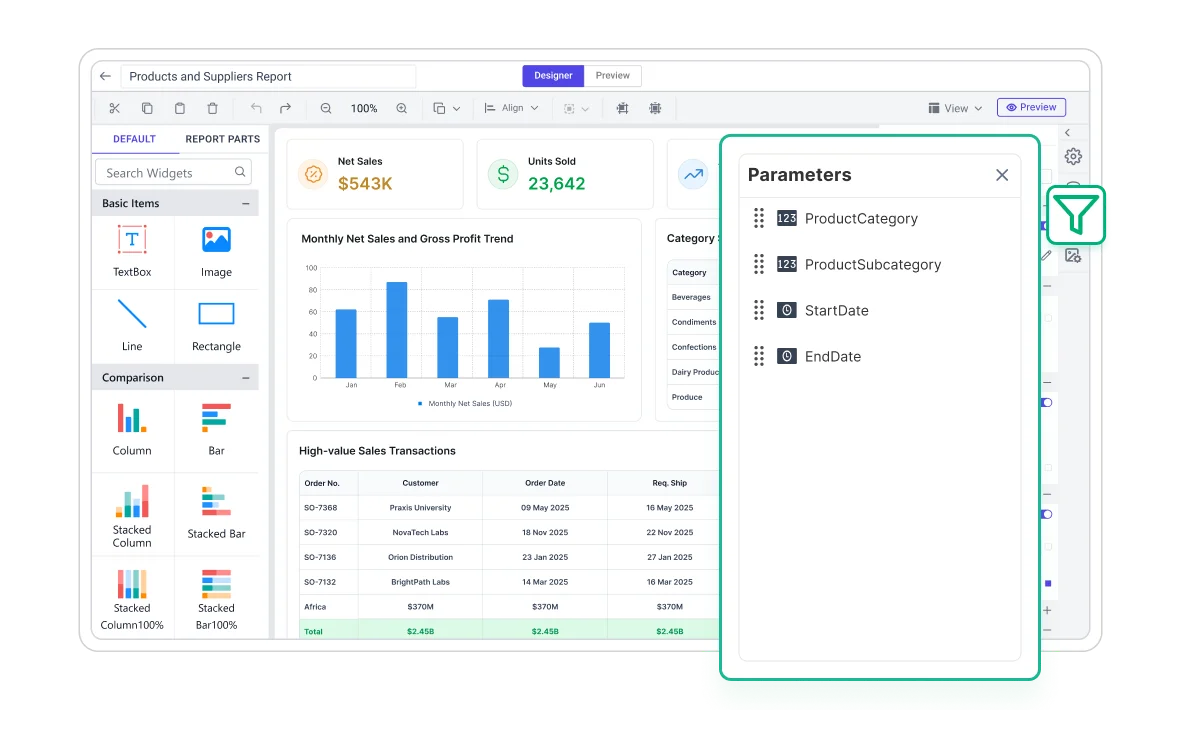
Report parameters are one of the most widely used features in Bold Reports to enable interaction with RDL/RDLC reports at runtime. The following parameter types allow you to control data filtering, customization, and presentation, enhancing the user experience.
-
Cascading parameters
-
Query-based (Dataset) parameters
-
Non-query (Static) parameters
-
Multi-value parameters
-
Custom parameter layouts
Expression builder
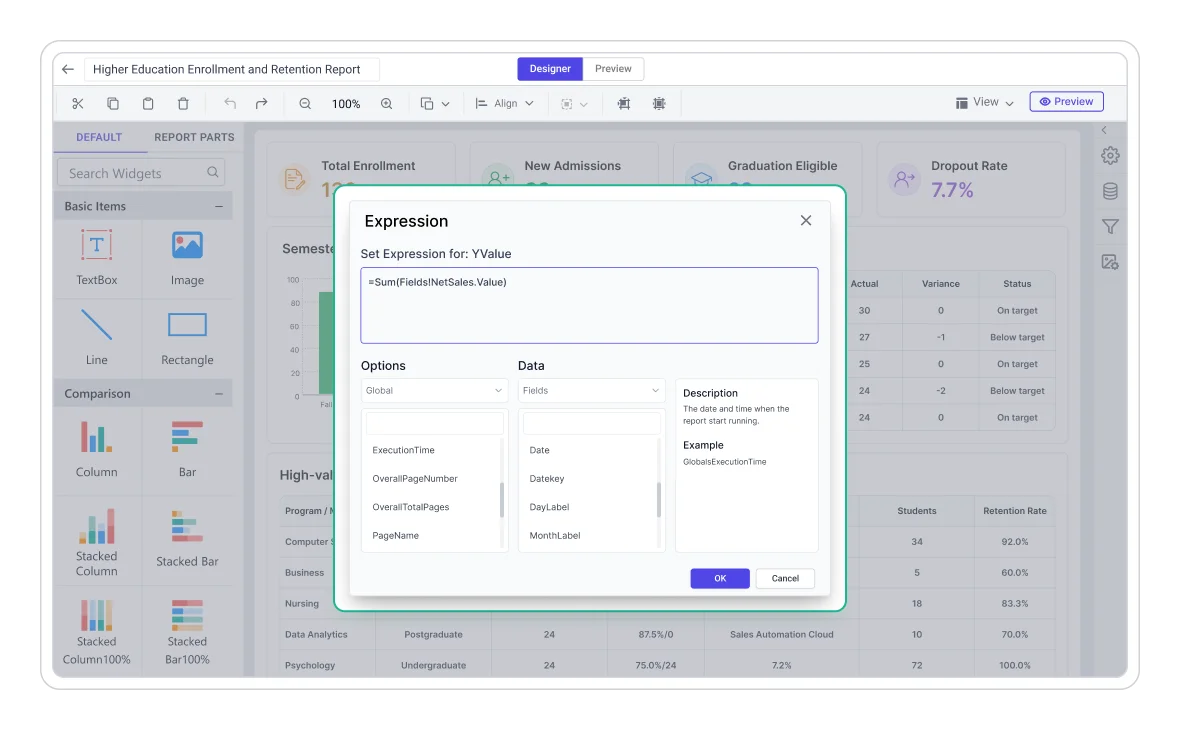
The Blazor Report Designer provides an expression builder that allows you to create simple and complex RDL expressions. Expressions are used throughout report definition to control the content or appearance of a report.
-
Set dynamic values to any properties such as color, font, and more.
-
Create additional operations such as mathematical computations, conditional formatting, conversions, and more.
-
Use constants, built-in fields, parameters, fields, data sets, variables, operators, common functions, and more.
View and Print Preview
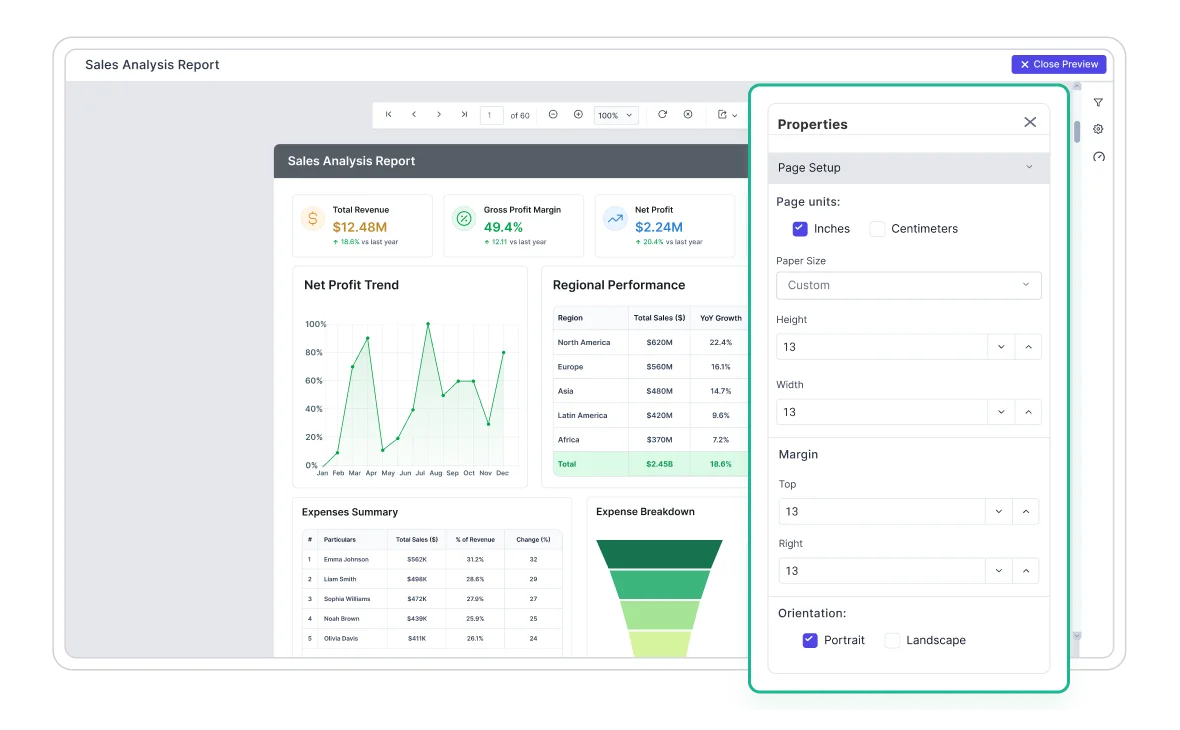
The WYSIWYG Report Designer lets you preview reports to verify layout, data, and overall output. Reports are displayed using the Blazor Report Viewer, ensuring accurate rendering. You can also configure paper size, margins, and orientation to see exactly how the report will appear when printed.
Ready to Build with the Blazor Report Designer?
Start designing and delivering powerful reports with ease using a flexible, high-performance solution built for modern applications.
Free for 30-days.
Deliver and Customize Reports with Blazor Designer
Deliver reports seamlessly and customize the reporting experience to meet the needs of your application, users, and business.
Multi-column reports
Users can create and visualize data across multiple adjacent columns for structured layouts such as mail merge, business cards, newspapers, and more to improve readability.
Interactive reports
Display data in data regions that support user interactivity at runtime with features like drill down, drill through, hyperlinks, bookmarks, document map, subreports, and nested layouts.
Export and Print Reports
Export reports instantly in a single click to formats such as PDF, Word, Excel, PowerPoint, CSV, XML, and HTML, while consistent maintaining pixel-perfect accuracy.
Easy Report Editing
Open and edit existing SSRS RDL/RDLC reports with ease using features like cut, copy, paste, undo, and redo. Preview and save your updates to the same or a different location.
Developer-friendly APIs
Control every element of the designer from the toolbar to dialogs through powerful developer APIs. This flexibility lets you customize workflows and extend functionality easily.
Globalization & localization
Easily build applications to be used by a global audience in various languages using culture settings and by localizing static text to improve user experience with scalability.
Browser compatibility
The Blazor Report Designer runs smoothly on all modern browsers like Chrome, Edge, Firefox, and Safari using pure HTML5 for consistent performance across environments.

Enterprise-Ready Compliance
Bold Reports helps you meet key security and compliance standards. All activity logs are safely stored, can’t be changed, and are easy to export when needed.
Ready to Add Custom Reports to Your Application?
With Bold Reports, you can build and embed reports that feel like a native part of your application fully branded and easy to use.
No credit card required.