






SAMPLE REPORT FOR DATA VISUALIZATION

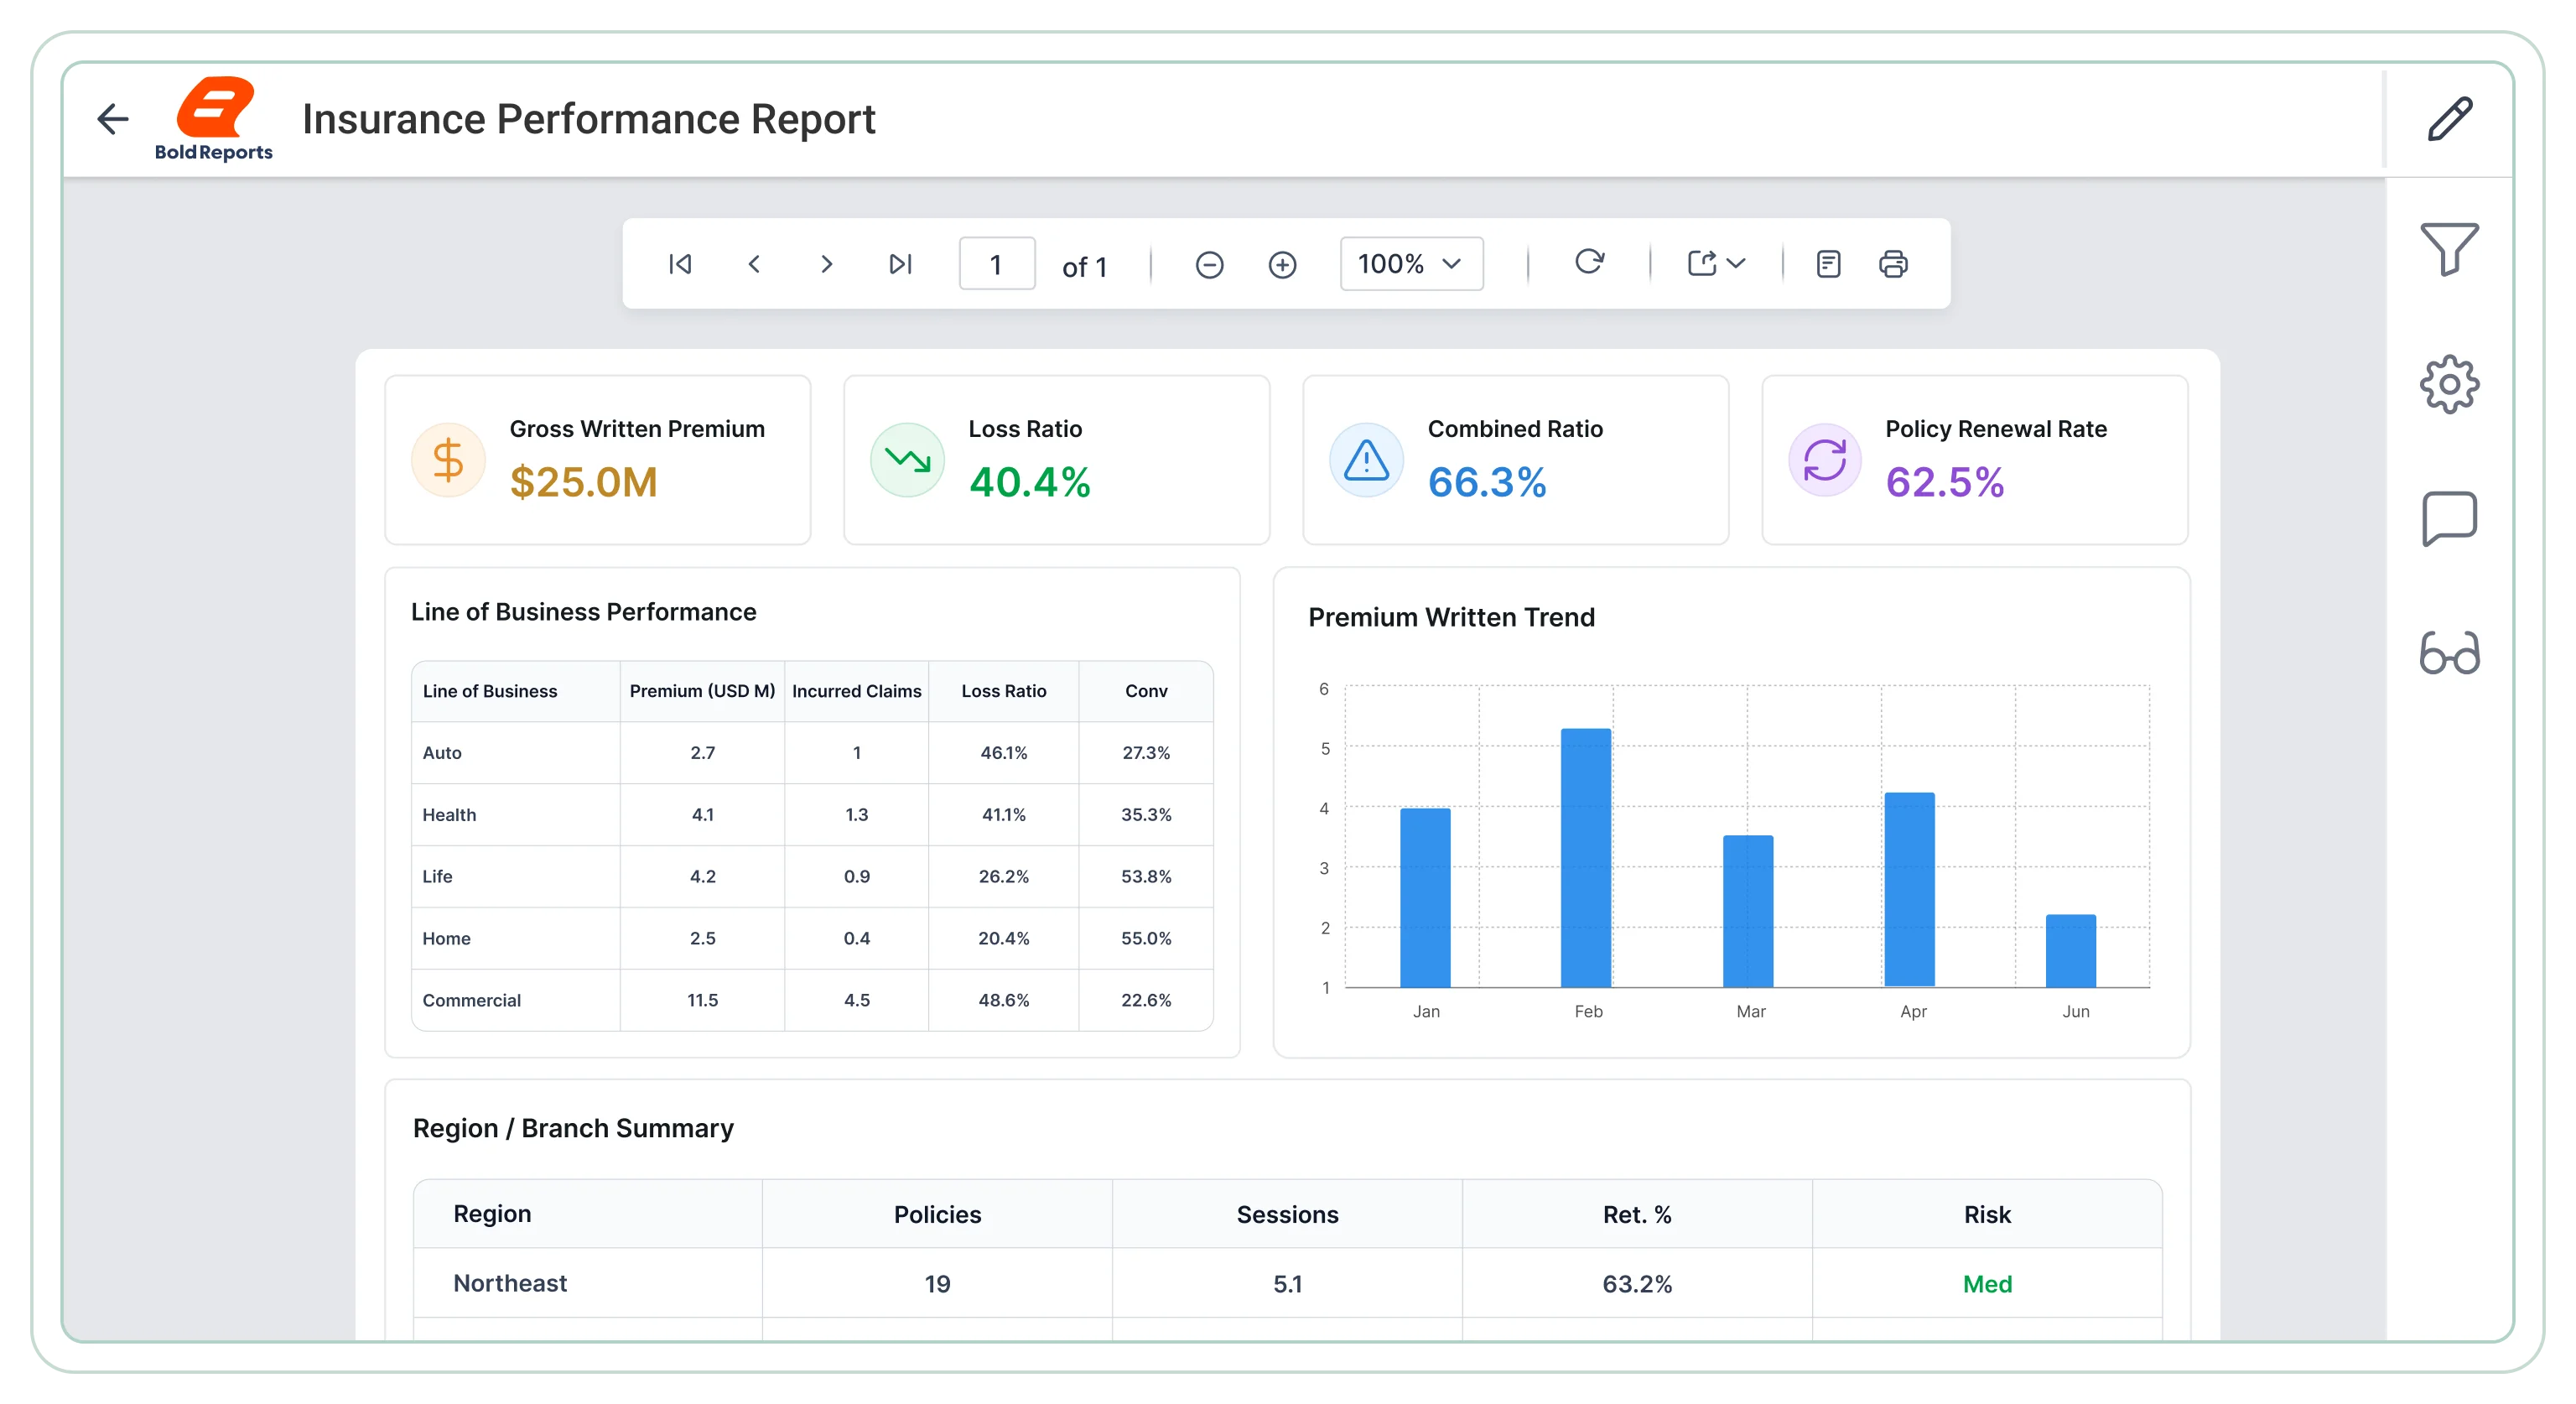
Insurance Performance Report

Evaluate policy performance with a paginated report for premium analysis, segment comparisons, trend tracking, and visibility across sales volume, claims activity, profitability, and channels.

Editable .rdl file i The download includes the report .rdl file only. Upload it to Bold Reports Designer to preview, edit, and customize the report based on your requirements.

Need help customizing the report? Explore the documentation or contact our support team.

Insurance performance report
Trusted by leading companies

J&J

Schneider

Bridgestone

Siemens

Verizon

HP

Fidelity

Intel

Real-world business scenarios

Explore key use cases

Use this report to interpret underwriting results, monitor premium flows, and evaluate claims efficiency, supporting informed decision-making across insurance operations. 

Policy sales review

A structured reporting view for teams checking how policy volume and premium value perform across segments.

  • Compare policies sold by policy type across reporting periods.
  • Review total premium by reporting period and policy type trends.
  • Measure average premium movement across policy types and groups.
  • Identify high-volume sales segments with strong policy totals.
  • Examine assured amount distribution across product lines overall.
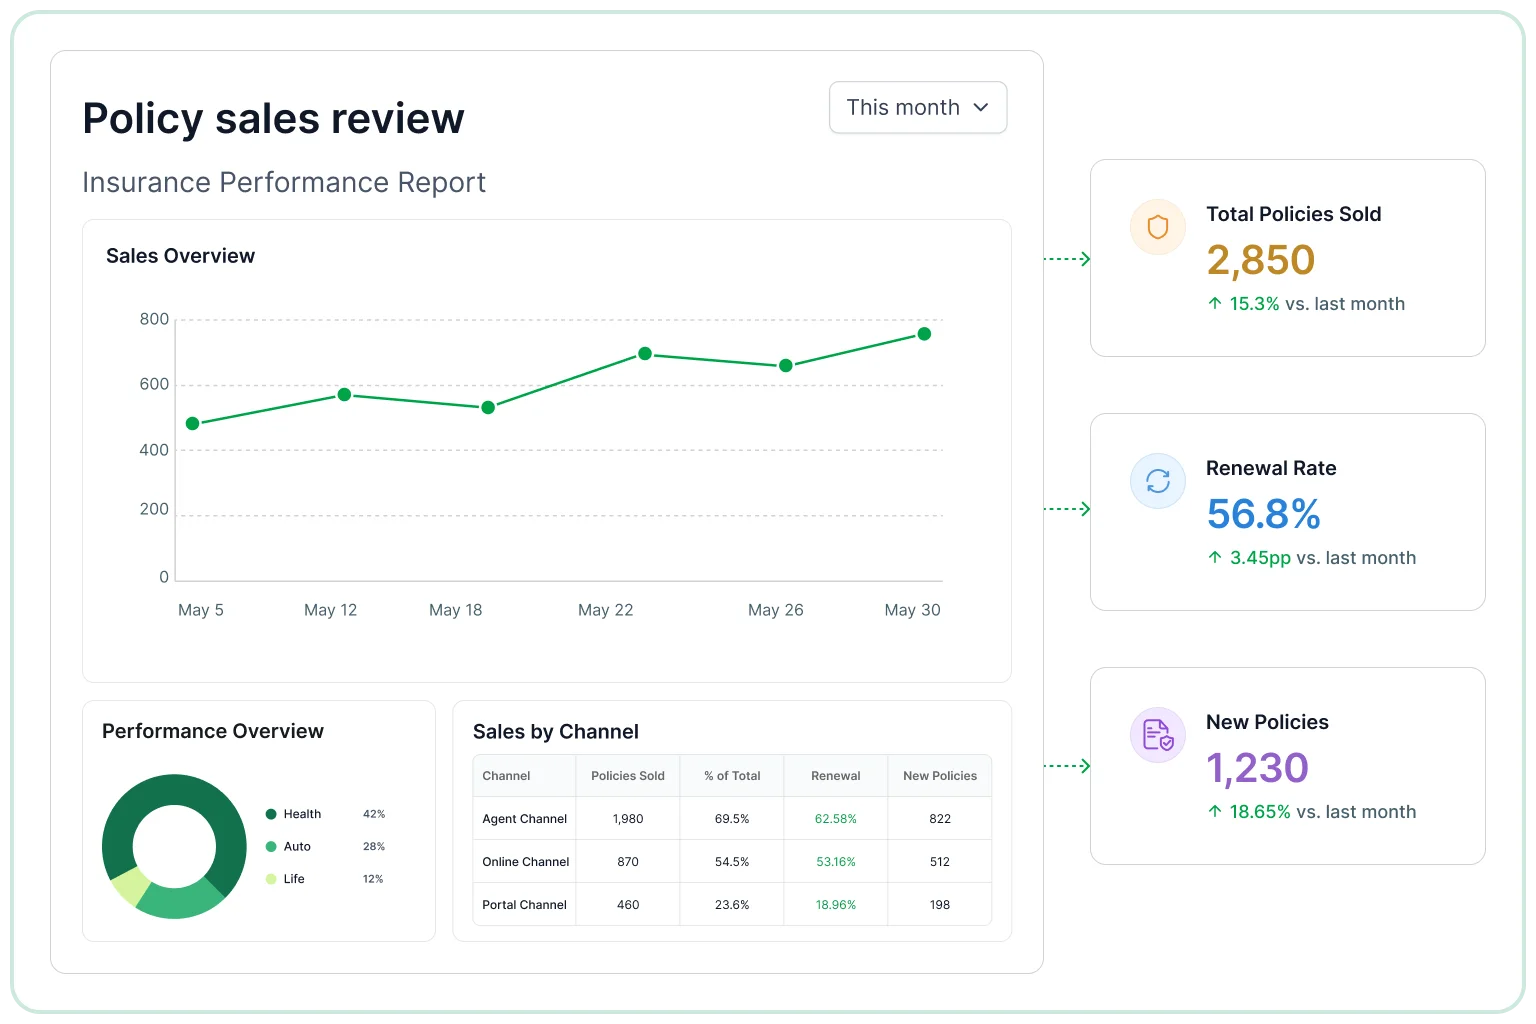
Policy sales review

Profitability assessment

Helps insurance teams understand how revenue and costs vary across policy categories.

  • Compare profit versus expenses by policy type across periods.
  • Evaluate margin performance across segments and policy groups.
  • Identify higher-cost policy groups with weaker margin results.
  • Review profitability changes over time across product lines.
  • Measure financial contribution by product line and segment mix.
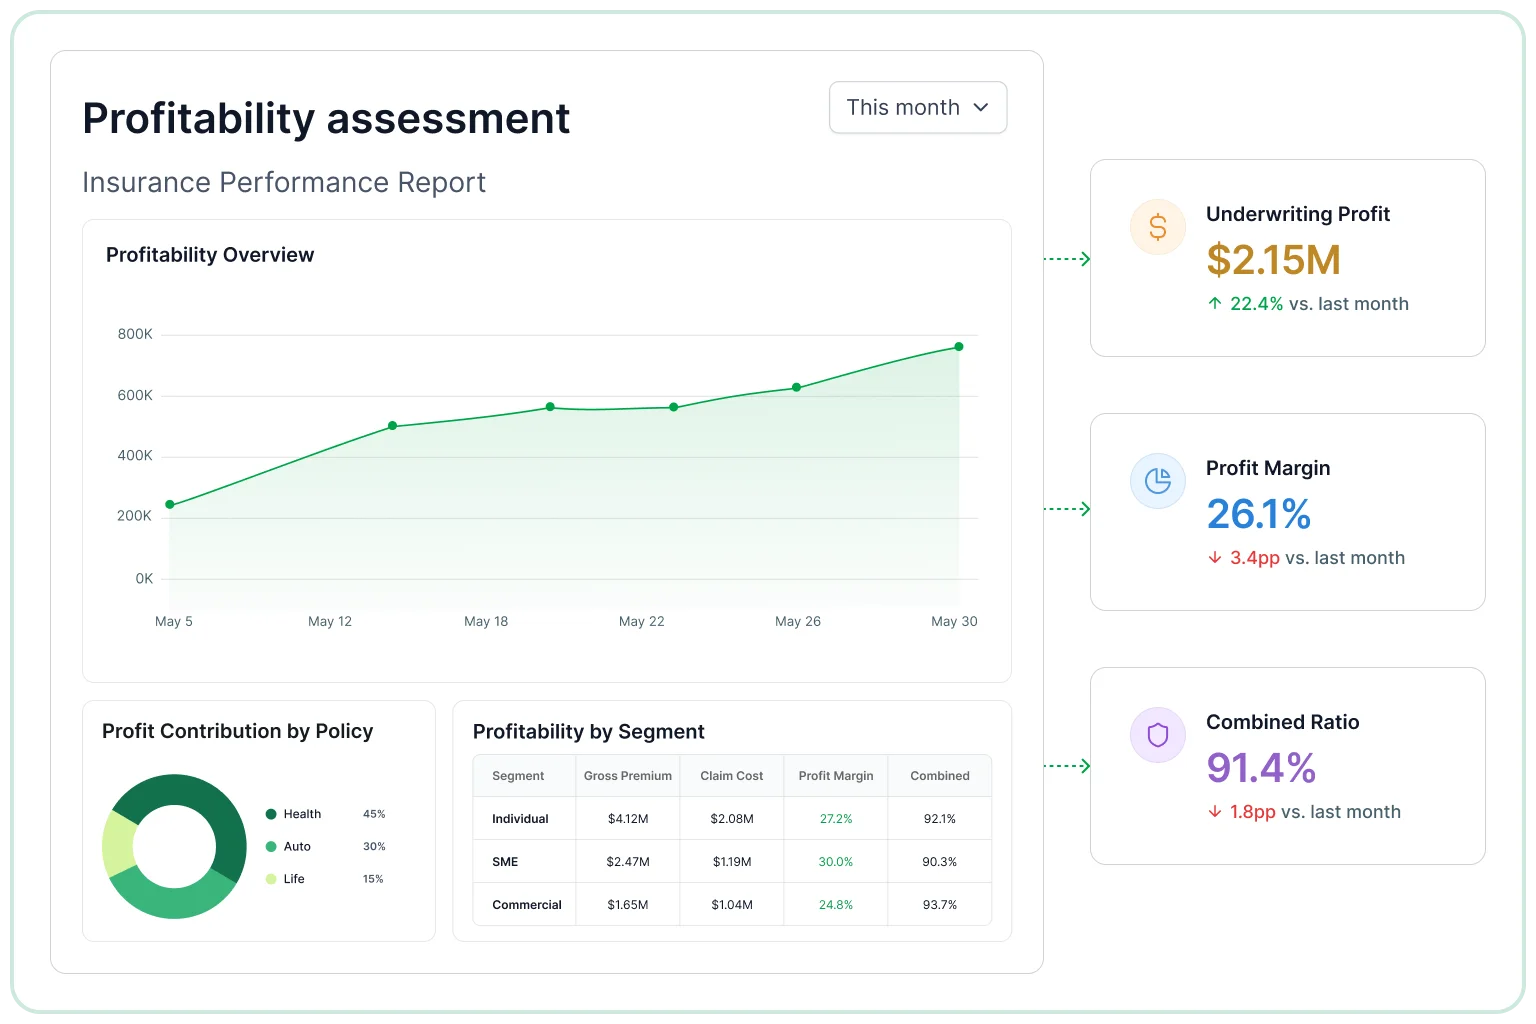
Profitability assessment

Claims efficiency analysis

Useful for examining how claims handling affects operational performance and policy outcomes.

  • Track claim processing time by segment and claim type trends.
  • Compare loss severity across policy types and reporting periods.
  • Identify slower claims workflows and processing bottlenecks.
  • Review claim-related cost patterns over time by segment groups.
  • Measure processing consistency over time across claims workflows.
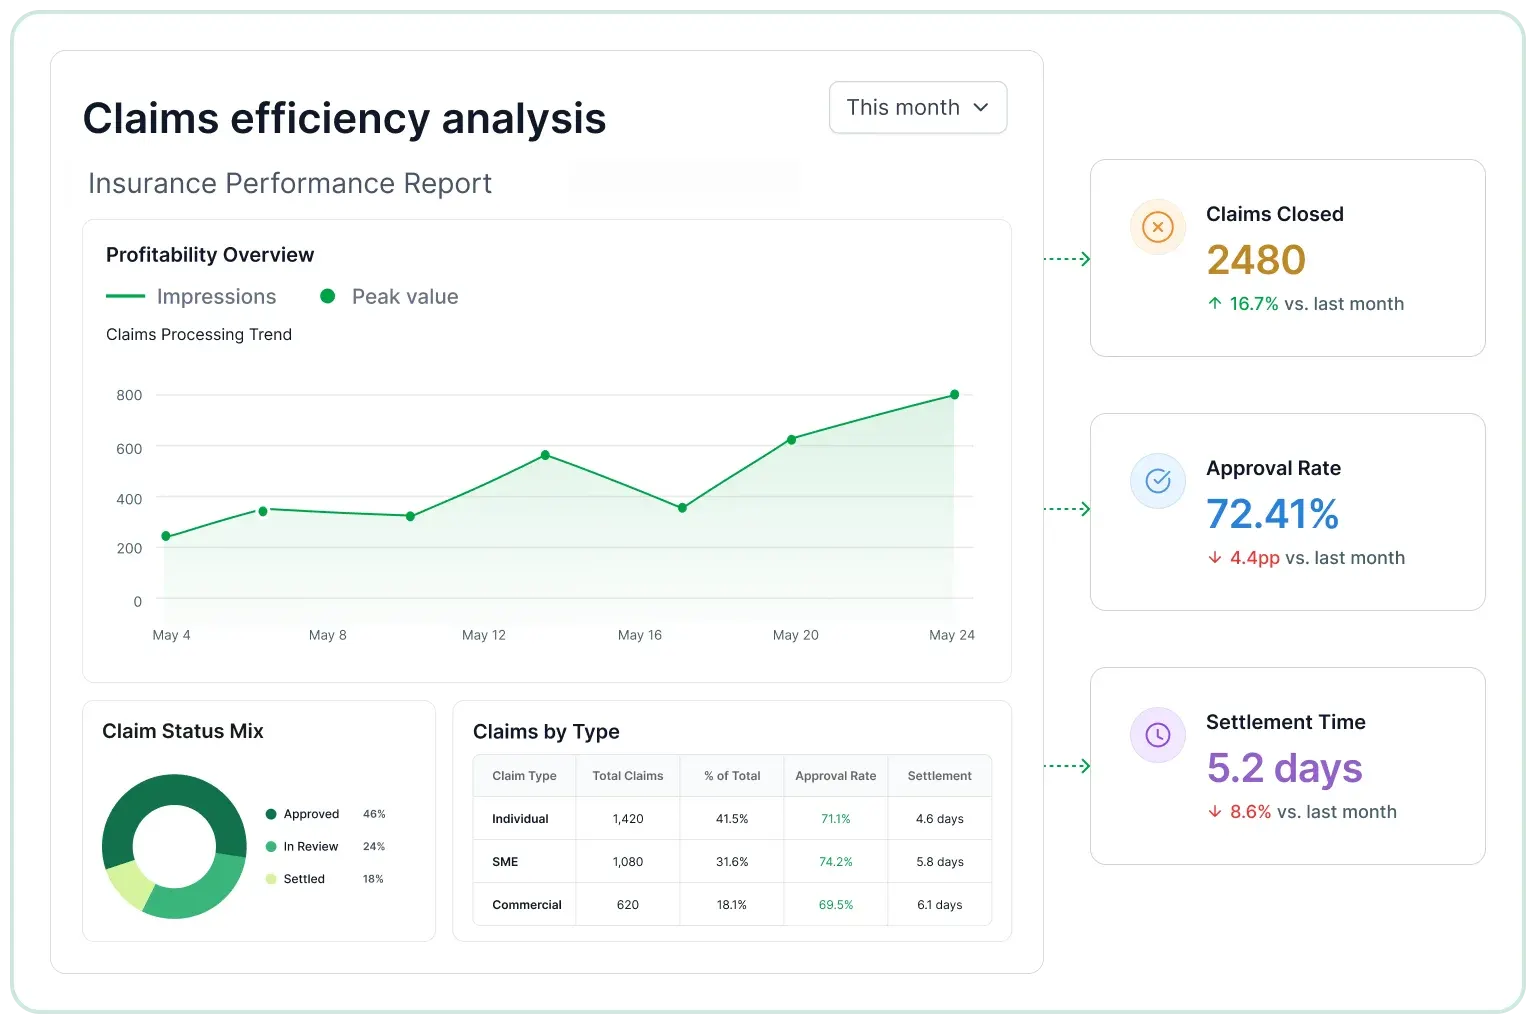
Claims efficiency analysis

Distribution performance

Supports broader portfolio reviews by showing how channels and regions contribute to policy growth.

  • Compare sales by channel across reporting periods and regions.
  • Review regional premium distribution by channel and year trends.
  • Identify stronger market areas and segment opportunities overall.
  • Examine APE by year across segments and channels reporting periods.
  • Measure segment contribution across regions and channels annually.
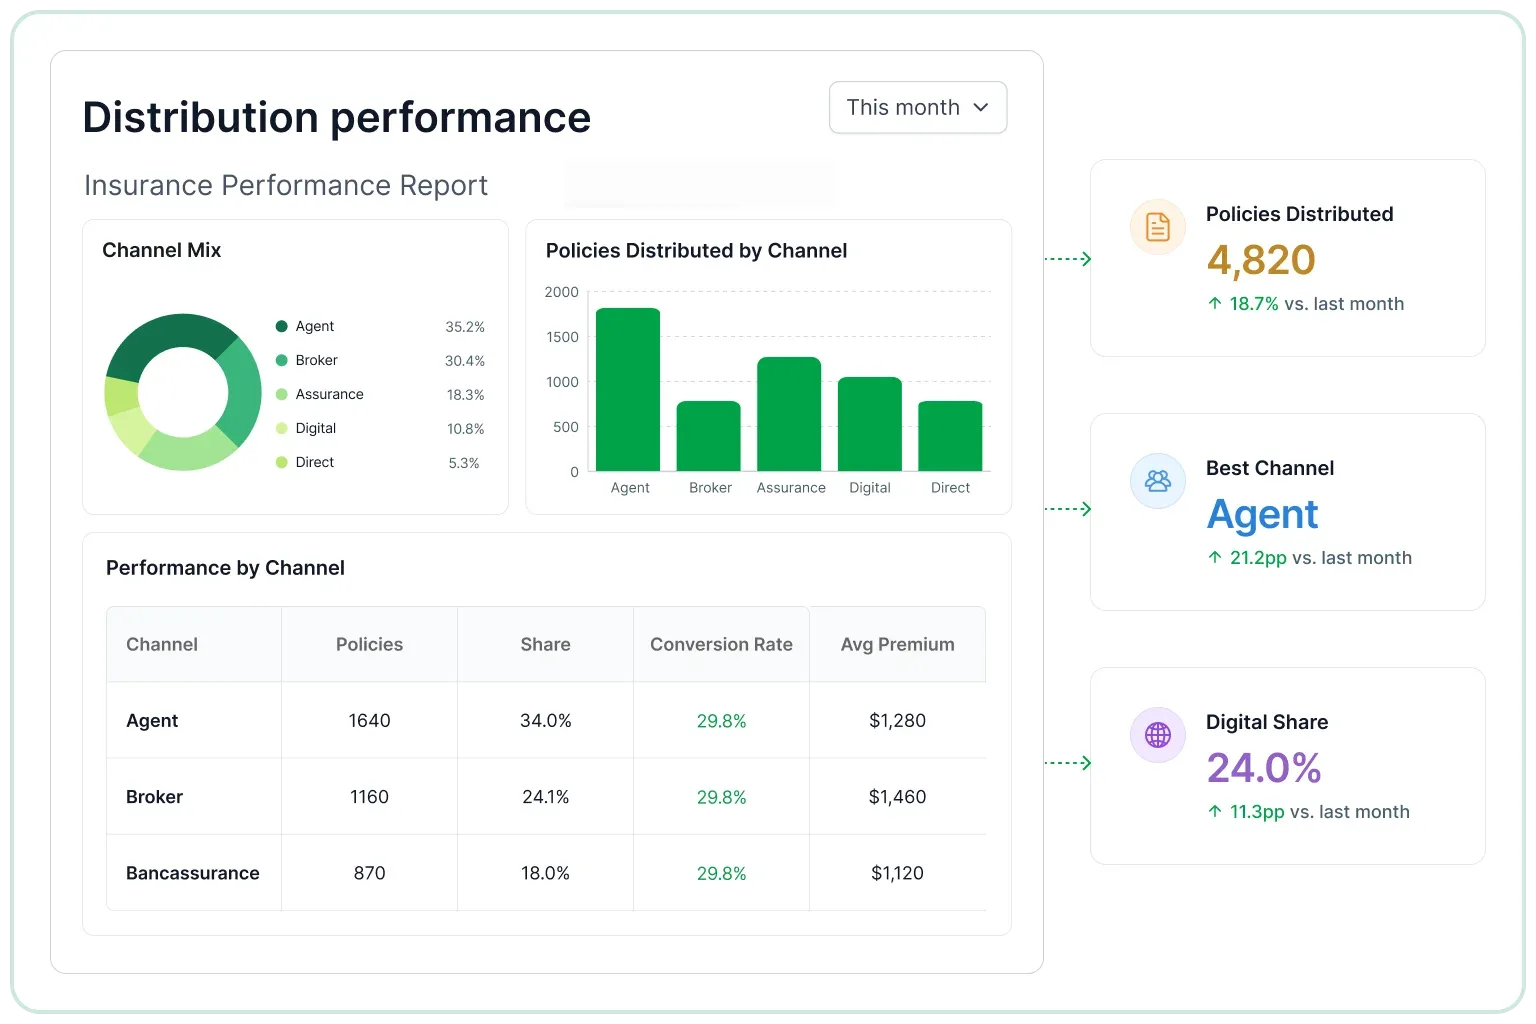
Distribution performance
Monitor critical KPIs

Track key metrics

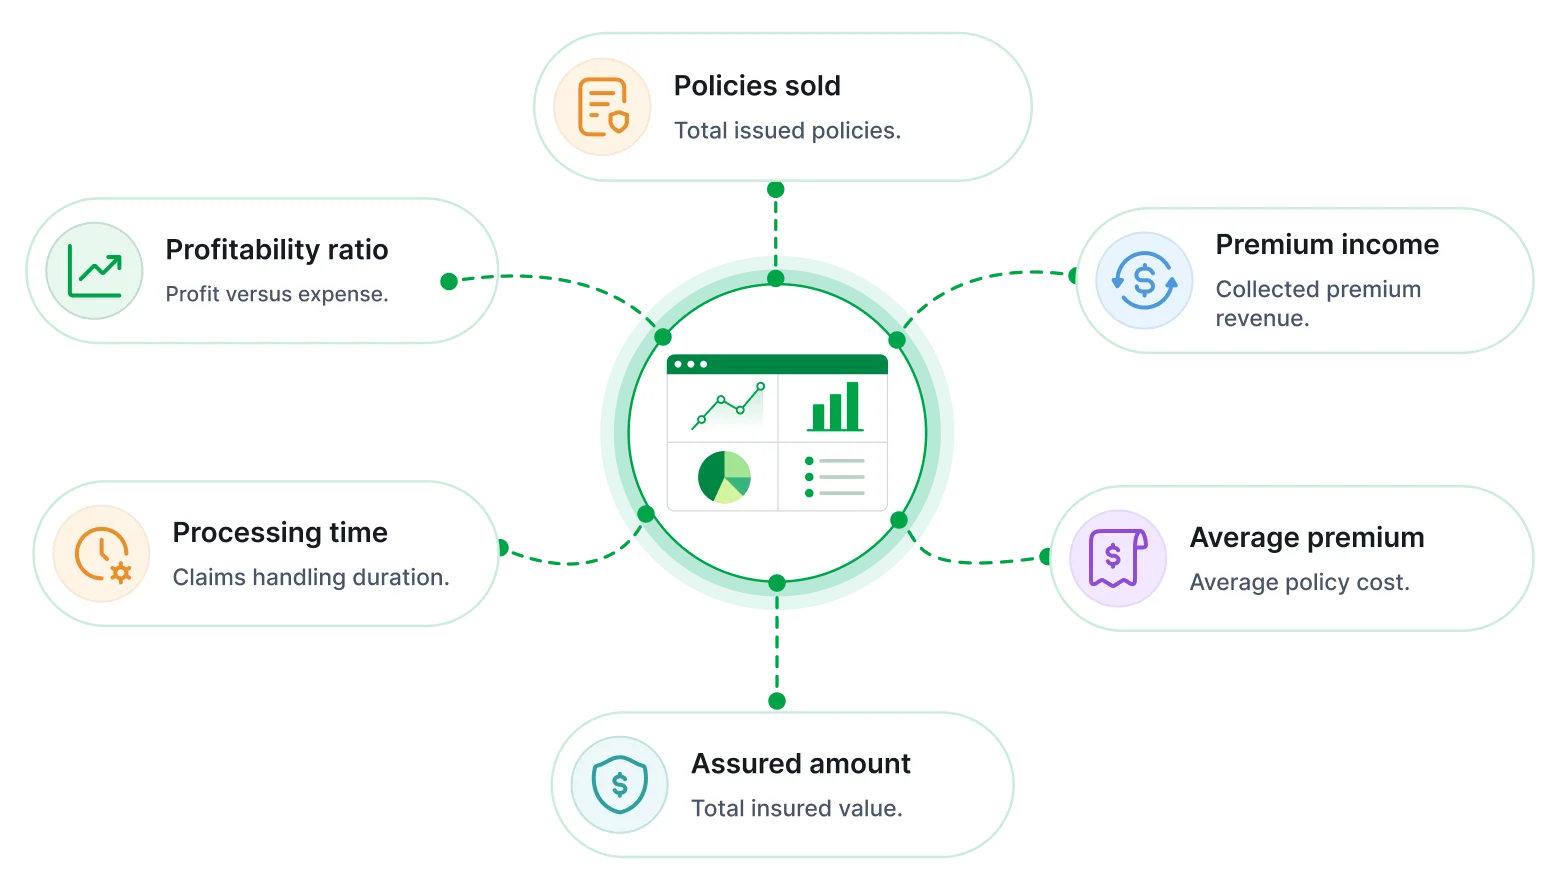
These indicators present a consolidated view of insurance performance, underwriting effectiveness, and operational efficiency across teams and portfolios.

Insurance performance report key metrics
Overview of this report

What is a insurance performance report?

An Insurance Performance Report measures premium growth, claims activity, policy performance, and profitability across products, agents, or business lines. 

Premium growth and trend review

Tracks written premium changes across products, regions, or reporting periods.

Agent and branch comparison

Compares sales, claims impact, and portfolio results across channels.

Claims volume and ratio view

Measures claim frequency, loss ratios, and settlement-related performance.

Product profitability tracking

Shows margin performance and contribution by insurance product line.

Policy retention performance

Examines renewal rates, retention changes, and customer policy continuity.

Underwriting results overview

Evaluates risk selection outcomes and overall underwriting performance.
No credit card required.

Built for your team

Built for underwriting and operations teams

Enable performance evaluation across insurance operations through structured reporting designed for underwriting, finance, and claims teams. 

Built for underwriting and operations teams
Holistic business visibility

Holistic business visibility

Access policy, premium, and claims metrics within one unified reporting environment for analysis.

Policy and premium insights

Policy and premium insights

Understand how product lines contribute to revenue generation across markets, channels, and teams.

Secure access management

Secure access management

Ensure controlled sharing of sensitive insurance data across departments for secure access controls.

Claims efficiency monitoring

Claims efficiency monitoring

Evaluate claims processing timelines and cost impact across departments and workflows for planning.

Recurring performance tracking

Recurring performance tracking

Monitor business outcomes through scheduled reporting cycles across teams, regions, and periods now.

Channel and region comparison

Channel and region comparison

Analyze how distribution and geography affect outcomes across regions, channels, and markets today.
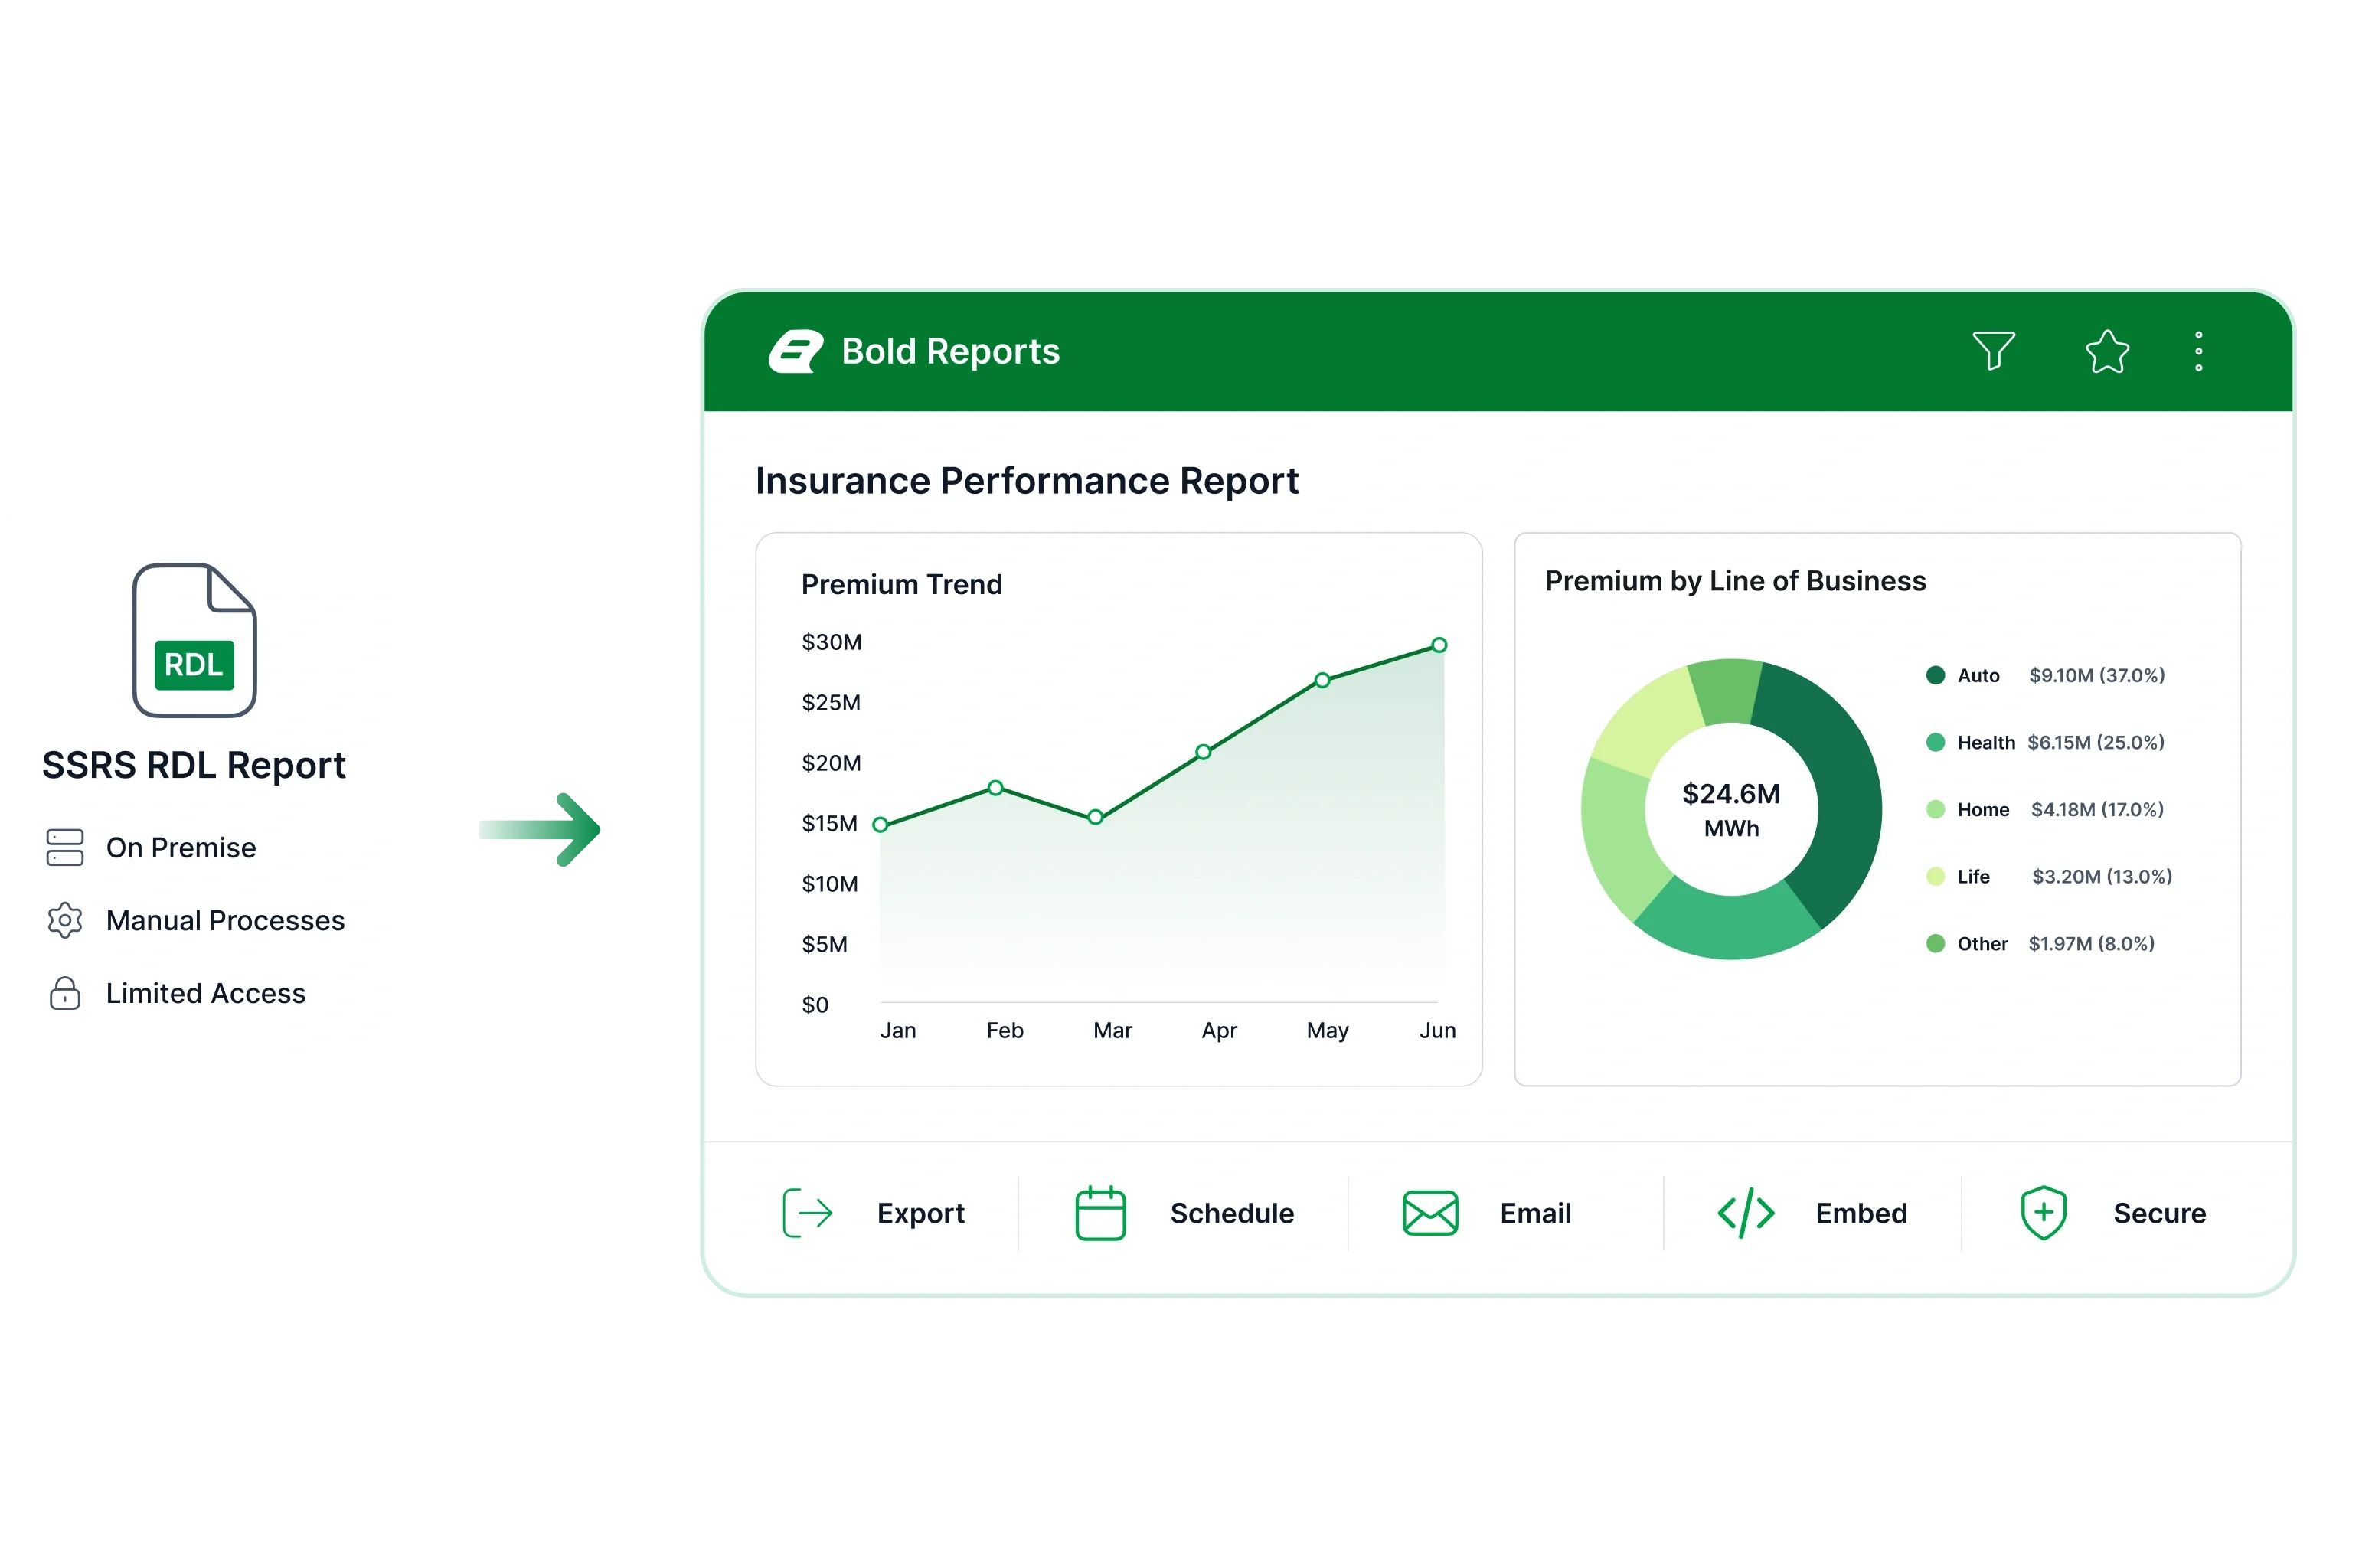
Modernize existing SSRS reports

Extend insurance reporting for recurring reviews

Modernize insurance reporting for claims, policies, compliance with RDL workflows. Enterprise access, scheduled delivery.

  • Executive reporting access.
  • Recurring report scheduling.
  • Enterprise reporting workflows.
Extend insurance reporting for recurring reviews
Tailor to your needs

Build & customize

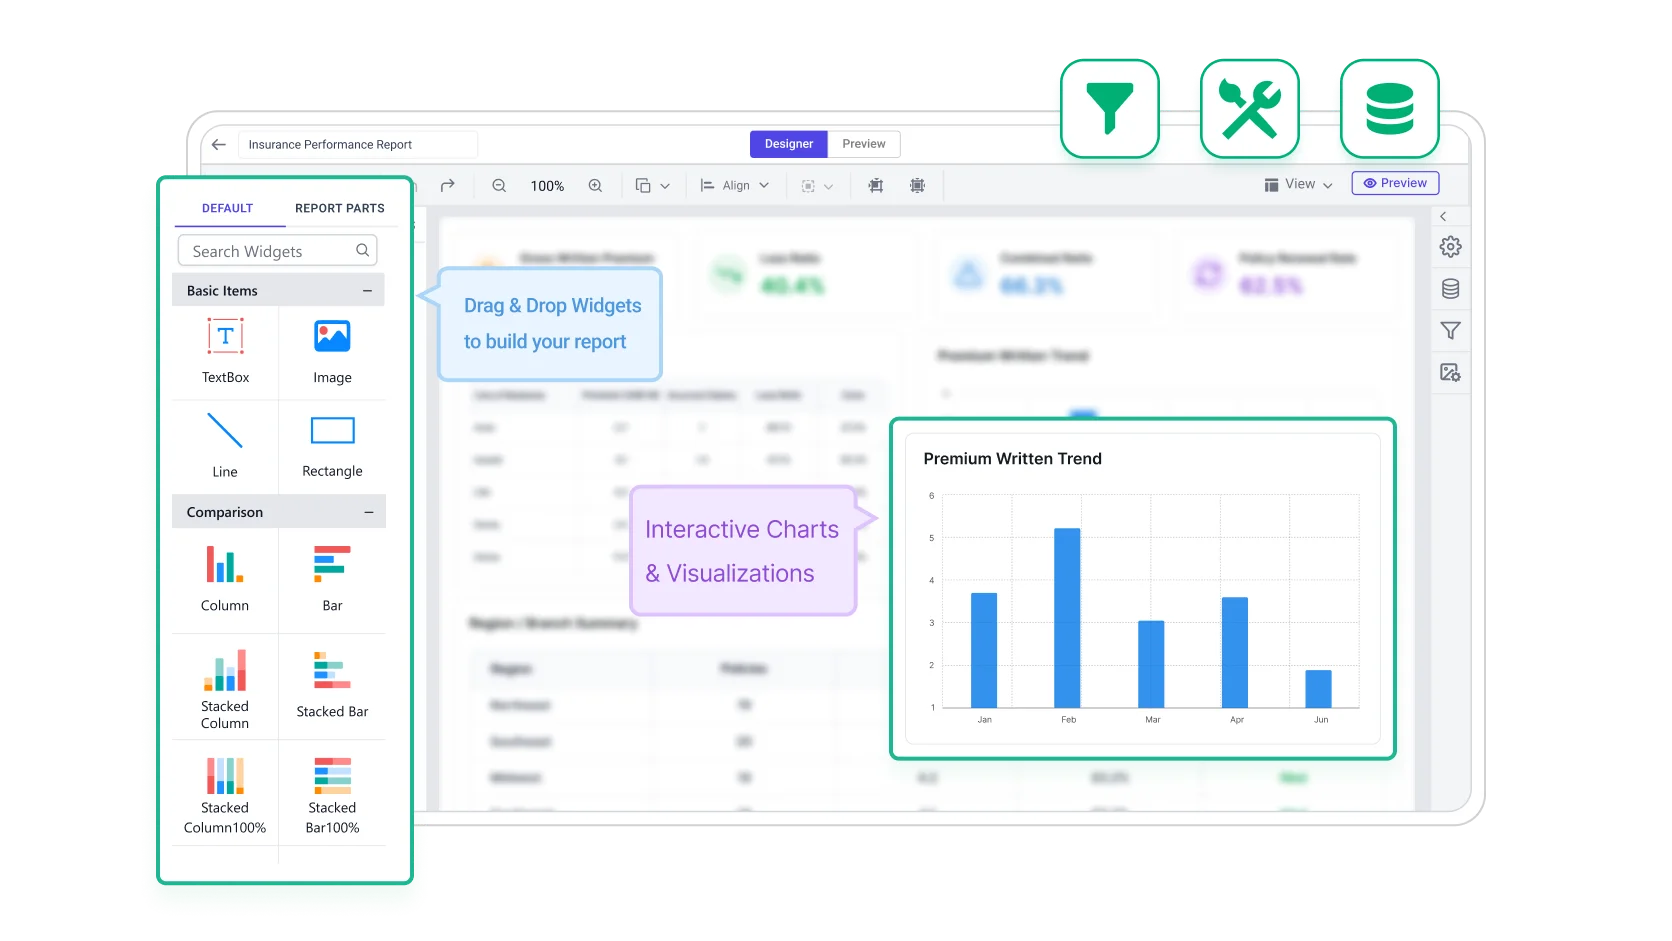
Customize the report with filters, KPIs, and sharing options so teams can focus on policy performance, premium trends, claim behavior, and profitability across business segments.

Filter icon

Filter by business line.

Access icon

Assess policy and claims activity.

Highlight icon

Highlight strategic insurance kpis.

Export icon

Export for portfolio reviews.

Share icon

Share insights with insurance teams.

Build  and customize insurance performance report

No credit card required.

Connectors

Data integrations

Connect to over 25+ data sources from files and databases to web services for flexible integration, transformation, and storage, all ready for reporting.

Common questions answered

Frequently asked questions

Understand how policy activity, claims trends, profitability, and risk indicators are reported across portfolios, products, and time periods for planning.

Stop Exporting Data. Start Embedding Reports.

Turn your data into production-ready reports instantly

Create pixel-perfect, print-ready reports with powerful exporting and zero complexity.

No credit card required.