
Sales Reports: Types, Benefits, Key Metrics, and Use Cases
TL;DR
Sales reports help teams track and analyze sales performance over time by measuring key metrics like revenue, deals closed, and conversion rates.
Introduction
In 2026, sales reports are essential tools for improving sales performance, optimizing revenue generation, and making data-driven decisions. As organizations collect more sales data across CRM systems, pipelines, and customer touchpoints, turning that data into actionable insights is critical for staying competitive.
Modern sales reports go beyond tracking revenue and closed deals. They provide visibility into sales performance, pipeline health, conversion trends, customer behavior, and future revenue opportunities. By transforming raw sales data into meaningful insights, sales reports help teams identify opportunities faster, improve forecasting, and optimize sales strategies.
In this guide, you’ll learn what sales reports are, why they matter, how sales reporting works, which key metrics to track, and how to use sales reports to drive better business outcomes.
What is a sales report?
A sales report is a business document that summarizes sales activities, performance metrics, revenue trends, and sales outcomes over a specific time period. Organizations use sales reports to monitor progress against targets, identify opportunities, evaluate team performance, and make data-driven business decisions.
This kind of report consolidates key information such as:
-
- Total revenue
- Number of deals closed
- Sales pipeline activity
- Win rates
- Sales team performance
- Product sales trends
It turns raw sales data into actionable insights, helping teams improve performance and drive revenue growth.
Why does a sales report matter?
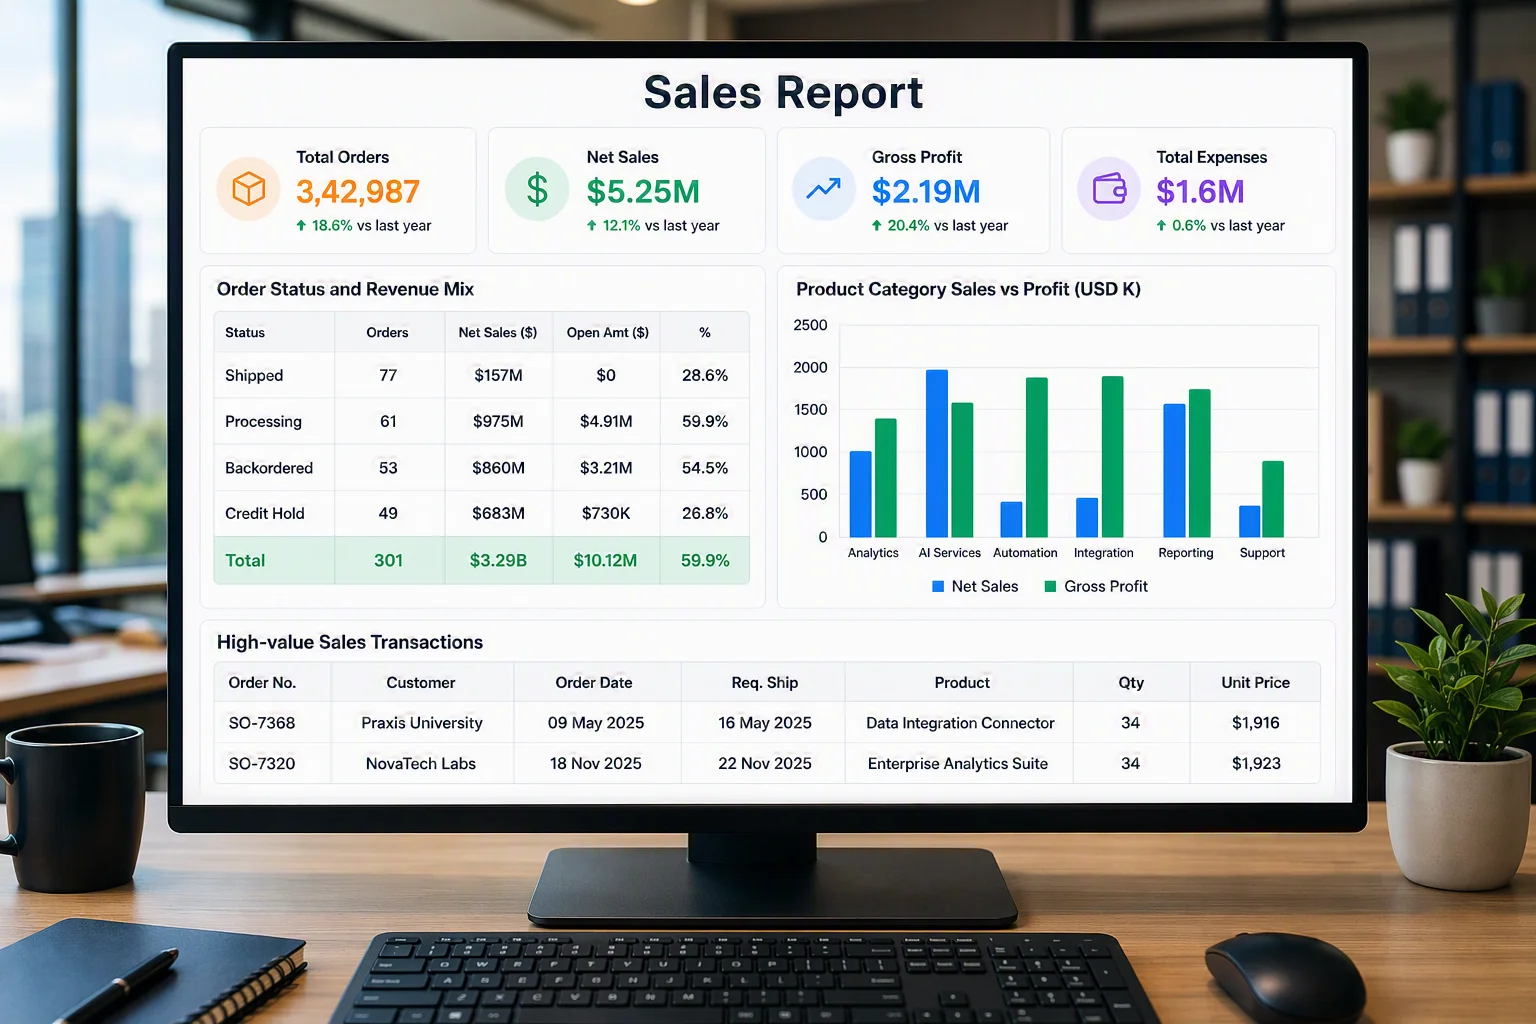
A sales report is more than a record of sales activities; it’s a strategic tool that helps teams measure performance, make informed decisions, and drive revenue growth. By visualizing sales data, sales reports provide the visibility businesses need to understand what is working, identify areas for improvement, and capitalize on growth opportunities.
1. Performance measurement
Sales reports provide a clear view of key performance metrics, helping teams track progress against targets and evaluate overall sales effectiveness. By monitoring metrics such as revenue, deals closed, conversion rates, and sales activities, organizations can identify strengths, address performance gaps, and continuously improve results.
2. Better decision-making
Accurate sales reporting enables teams to make informed, data-driven decisions rather than relying on assumptions. With access to real-time sales metrics, businesses can optimize sales strategies, allocate resources more effectively, and respond quickly to changing customer demands and market conditions.
3. Revenue forecasting
Sales reports play a crucial role in forecasting future revenue. By analyzing historical sales data, current pipeline activity, and performance trends, teams can predict revenue more accurately, set realistic goals, and plan resources with confidence.
4. Pipeline visibility
A well-structured sales report provides visibility into every stage of the sales pipeline. Teams can track deal progression, monitor pipeline health, and identify bottlenecks that may impact conversions or delay revenue generation. This visibility helps ensure opportunities are managed effectively, and sales targets remain on track.
5. Accountability
Sales reports create accountability by providing clear visibility into individual, team, and departmental performance. With access to measurable results and performance benchmarks, managers can identify coaching requirements, recognize achievements, and ensure sales activities remain aligned with business goals.
By improving performance measurement, pipeline visibility, and accountability, sales reports help teams optimize sales strategies, increase conversions, and achieve sustainable revenue growth.
How does sales reporting work?
Understanding how sales reporting works is essential for turning sales data into actionable business insights
1. Collect sales data
The first step is gathering data from all your sources, including your CRM systems, ERP platforms, e-commerce applications, and marketing tools. This data may include customer information, sales activities, revenue, deal status, and conversion metrics.
2. Organize and centralize data
The collected data is then cleaned, categorized, and consolidated into a centralized reporting system. Organizing data by product, sales representative, region, or customer segment makes it easier to analyze and compare performance.
3. Calculate sales metrics and KPIs
Once the data is organized, the reporting system calculates key metrics such as revenue, win rate, conversion rate, sales pipeline value, average deal size, and customer acquisition cost. These sales KPIs provide insights into business performance.
4. Analyze trends and performance
The data is analyzed to identify sales trends, performance patterns, and growth opportunities. Teams can uncover high-performing products, successful sales channels, and areas of the sales funnel that need improvement.
5. Visualize metrics through reports
The analyzed data is displayed through charts, tables, and reports. This makes complex sales data easier to understand and helps stakeholders quickly identify important insights and trends.
6. Share insights and act
Sales reports are shared with sales managers, executives, and stakeholders to support strategic decision-making. Teams use these insights to optimize sales strategies, improve forecasting, increase conversions, and drive revenue growth.
Key metrics to include in sales reports
To create a high-impact sales report, you need to track the right sales metrics and KPIs. These key metrics provide insights into sales performance, pipeline efficiency, and overall business growth, making them essential for SaaS and data-driven teams.
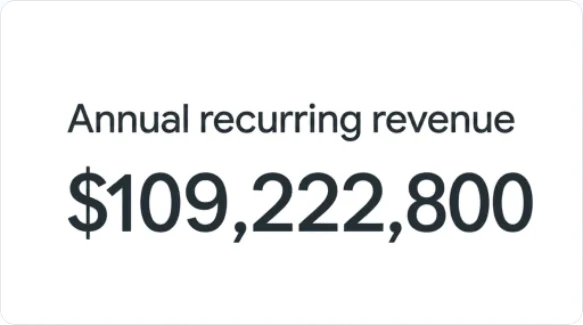
1. Annual recurring revenue (ARR)
This is the total recurring revenue a business expects to generate over a 12-month period from active subscriptions. It is a key indicator of long-term growth and revenue stability, helping teams evaluate business health, forecast future revenue, and measure annual growth.
2. Monthly recurring revenue (MRR)
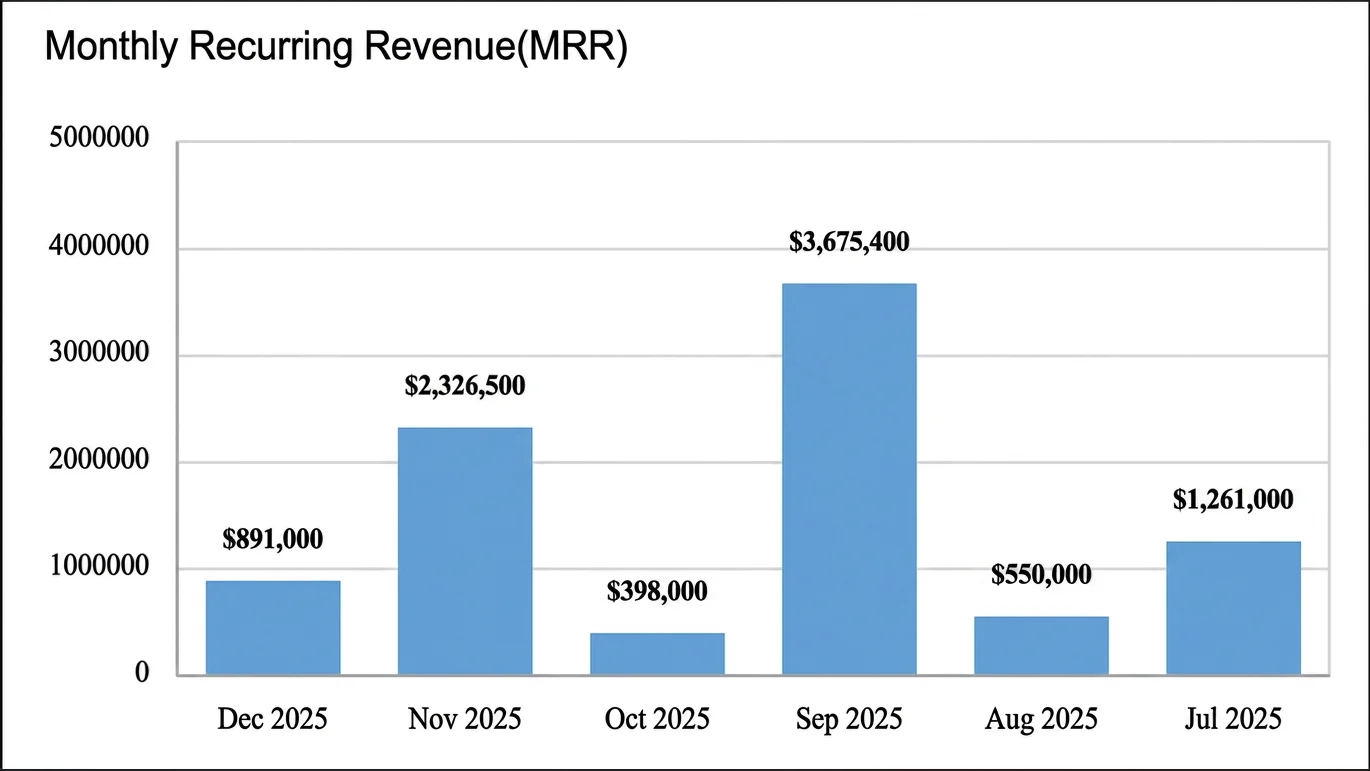
This metric measures the predictable revenue generated from subscriptions each month. Monitoring MRR helps teams measure month-over-month growth, identify revenue trends, and assess the impact of acquisition and retention efforts.
3. Customer acquisition cost (CAC)
Customer acquisition cost measures the total cost of acquiring a new customer, including sales and marketing expenses. Tracking CAC helps organizations evaluate acquisition efficiency, optimize spending, and improve profitability.

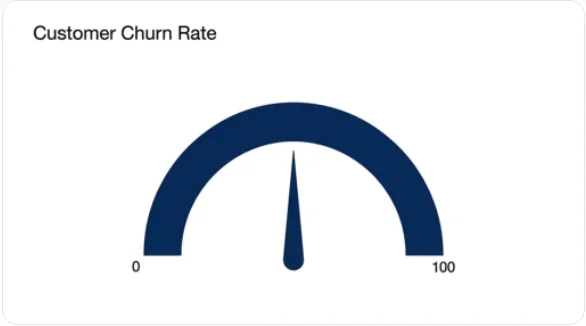
4. Customer churn rate
This metric measures the percentage of customers who cancel subscriptions, stop purchasing, or fail to renew within a specific time period. It helps businesses assess customer loyalty and recurring revenue performance.
Lower churn rates indicate good customer retention and long-term business growth.
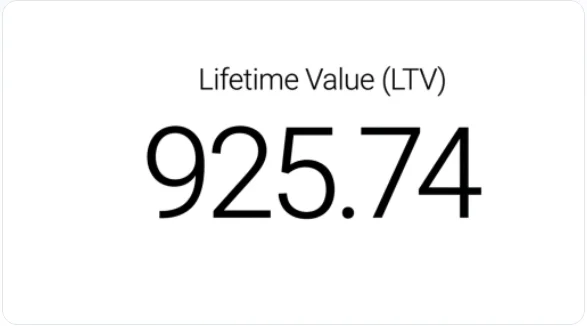
5. Customer lifetime value (LTV)
Customer lifetime value estimates the total revenue a customer is expected to generate throughout their relationship with a business. This metric helps teams understand long-term customer value and profitability.
A higher LTV indicates stronger customer relationships and sustainable revenue growth.
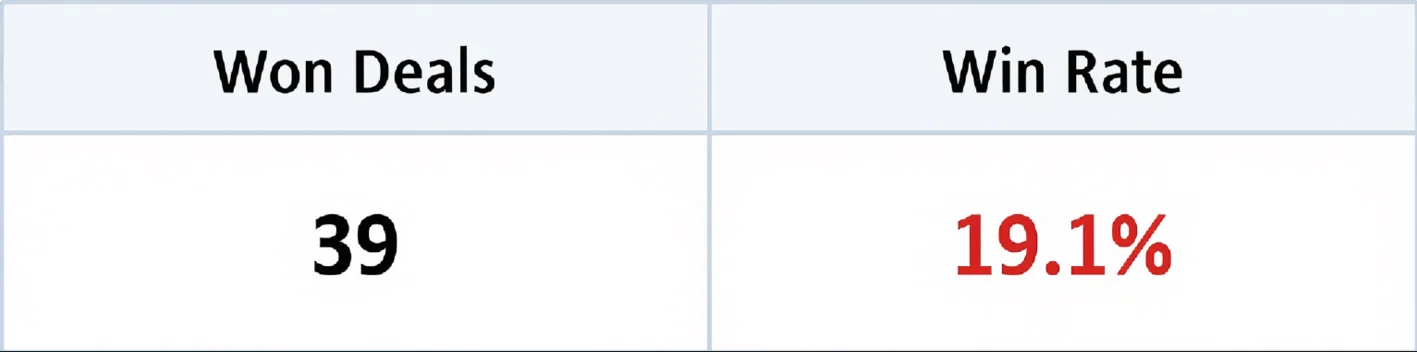
6. Win rate (close rate)
The win rate tracks the percentage of deals successfully closed compared to total opportunities. It’s a key metric for evaluating sales effectiveness and strategy performance.
5 common use cases for sales reports
Sales reports serve multiple functions.
1. Sales performance management
Sales managers need clear visibility into individual and team performance to ensure targets are met and productivity remains high. However, performance being tracked across multiple sales channels can make it difficult to identify strengths and improvement areas.
With sales performance reports, teams can:
-
- Measure individual and team performance against KPIs and targets.
- Identify top performers and performance gaps.
- Direct coaching for performance improvement.
By integrating performance reporting into daily sales operations, organizations can improve accountability, increase productivity, and consistently achieve sales goals.
2. Forecasting and budgeting
Accurate forecasting and budgeting depend on reliable sales data and visibility into future opportunities. Without structured reporting, organizations may struggle to predict revenue and allocate resources effectively.
With sales forecasting reports:
-
- Project future revenue using sales data and pipeline trends.
- Align budgets with expected sales performance.
- Support resource planning with data insights.
By integrating forecasting into sales reporting, organizations can improve planning accuracy and reduce uncertainty.
3. Territory analysis
Organizations often need to compare sales performance across regions or markets to identify growth opportunities and optimize resource allocation. Fragmented data can make these comparisons difficult.
With territory analysis reports:
-
- Sales performance is compared across regions.
- High-performing and underperforming markets are identified quickly.
- Sales resources can be allocated more effectively based on performance data.
By providing visibility into regional performance, territory analysis helps businesses maximize sales opportunities and improve market coverage.
4. Product performance tracking
Understanding which products drive revenue is essential for optimizing sales and product strategies. Without clear reporting, businesses may miss opportunities to capitalize on top-performing products.
With product sales reports:
-
- Revenue and sales volume are tracked by product or service.
- Best-selling and underperforming products are identified.
- Product strategy and sales efforts can be aligned with market demand.
By monitoring product performance, organizations can make smarter decisions that support revenue growth and profitability.
5. Customer analysis
Customer behavior and purchasing patterns play a critical role in sales success. However, analyzing customer data in multiple systems can limit visibility into customer value and retention trends.
With customer analysis reports:
-
- Customer purchasing behavior is tracked and analyzed.
- Customer lifetime value (LTV) and retention trends are measured.
- High-value customer segments are identified for targeted engagement.
By leveraging these insights, businesses can strengthen customer relationships, improve retention, and maximize long-term revenue growth.
Types of sales reports every sales manager should use
Different types of sales reports provide targeted insights into specific stages of the sales process, helping teams track performance, analyze trends, and optimize revenue growth.
- Sales performance report: Tracks and analyzes sales activities, revenue, and key performance metrics over a defined period. It helps teams evaluate performance across regions, markets, and sales channels while identifying gaps and opportunities to improve sales performance.
- Sales pipeline report: Provides a clear view of deals at each stage of the sales funnel, from lead generation to closing, helping teams monitor pipeline health, track deal progression, and identify bottlenecks that may impact revenue growth.
- Sales forecast report: Predicts future revenue based on historical sales data, current pipeline activity, and trends. It helps organizations improve forecasting accuracy, plan resources effectively, and align sales strategies with revenue goals.
- Revenue report: Breaks down total revenue by product, region, or time period. It provides a clear view of revenue sources and helps teams focus on high-performing areas that drive business growth.
Sales report vs. dashboard vs. forecast
Understanding the differences among sales reports, sales dashboards, and sales forecasts helps organizations choose the right tool.
| Feature | Sales report | Sales dashboard | Sales forecast |
| Purpose | Analyze sales performance and outcomes. | Monitor sales KPIs in real time. | Predict future sales and revenue. |
| Time focus | Past and current performance. | Current performance. | Future performance. |
| Data presentation | Detailed reports, tables, and summaries. | Charts, graphs, and other visual widgets. | Revenue projections and forecasts. |
| Update frequency | Daily, weekly, monthly, or quarterly. | Real time or near real time. | Periodically based on forecast cycles. |
| Business value | Evaluates performance and identifies opportunities. | Enables continuous monitoring and faster decisions. | Supports planning, budgeting, and resource allocation. |
| Best for | Performance analysis and reporting. | Real-time sales tracking. | Revenue planning and strategic forecasting. |
Common sales reporting mistakes and solutions
These common reporting mistakes can result in inaccurate insights, poor decisions, and missed opportunities:
1. Tracking too many metrics
Including too many KPIs can make sales reports difficult to interpret and distract teams from the metrics that matter most. Focus on key indicators that align with your business goals.
2. Lack of context
Sales data without context can be misleading. Comparing results against historical performance, benchmarks, or targets helps teams understand what the outcomes are and where action is needed.
3. Ignoring sales trends
Looking only at short-term results can cause teams to miss important patterns. Analyzing trends over time helps identify growth opportunities, performance shifts, and potential risks.
4. Relying on manual reporting
Manual reporting through spreadsheets is time-consuming and increases the risk of data entry errors, inconsistencies, and reporting delays. Modern sales reporting tools automate data collection and reporting, improving both accuracy and efficiency.
5. Using inaccurate or incomplete data
The quality of a sales report depends on the quality of the underlying data. Inaccurate, outdated, or incomplete data can distort insights and lead to poor business decisions. Regular data validation and automated reporting tools help improve reporting accuracy.
How Bold Reports helps teams scale sales reporting
As a company grows, managing and analyzing increasing volumes of sales data becomes more challenging. Bold Reports helps organizations scale sales reporting with:
-
- Self-service reporting: It empowers both technical and nontechnical users to create, customize, and share sales reports without heavy reliance on IT teams. It accelerates report creation and enables faster access to actionable sales insights.
- Seamless integration with sales systems: With built-in support for multiple data sources, Bold Reports easily integrates with CRM platforms, marketing tools, and databases, eliminating data silos and providing a unified view of sales performance.
- Enterprise-grade security: Bold Reports provides secure, role-based access control, ensuring users only access data relevant to their roles. This enhances data security, protects sensitive information, and enables efficient, permission-based collaboration.
- Advanced reporting and customization: Create highly customizable reports. Teams can tailor reports to their specific KPIs and business goals, enabling more accurate sales forecasting, performance tracking, and revenue analysis.
- Scalable embedded reporting: Bold Reports enables businesses to embed sales reports directly into their applications. It’s easy to scale reporting across teams, customers, and products while maintaining performance and a seamless user experience.
Final thoughts
Sales reporting has evolved into a powerful driver of revenue growth for modern teams. By transforming raw sales data into actionable insights, businesses can optimize their sales funnel, improve conversion rates, and make faster, data-driven decisions.
Whether you’re tracking pipeline performance, analyzing conversion trends, or forecasting revenue, a strong sales reporting strategy helps teams stay aligned, improve efficiency, and consistently drive results. With a sales reporting tool like Bold Reports, businesses can move beyond static dashboards and build a flexible reporting system that grows with their needs.
Ready to turn your sales data into revenue growth? Start a 30-day free trial of Bold Reports, or request a demo to see how advanced sales reporting can increase conversions and accelerate deal cycles. Need help? Contact us to find the right reporting solution for your needs.
Frequently asked questions
- 1.
What is included in a sales report?
A sales report typically includes key data such as revenue, deals closed, conversion rates, pipeline status, and performance metrics. Advanced sales reports may also include forecasting, insights into customer behavior, and trend analysis.
- 2.
How often should sales reports be generated?
Sales reports can be created daily, weekly, monthly, or quarterly depending on business needs. Teams often use real-time dashboards with scheduled reports to stay updated and make timely decisions.
- 3.
What makes a sales report effective?
An effective sales report is clear, accurate, and actionable. It focuses on relevant metrics, uses visual dashboards for easy interpretation, and provides insights that support data-driven decisions.
- 4.
What is the difference between a sales report and a sales dashboard?
A sales report provides structured analysis and summaries, while a sales dashboard delivers real-time visual monitoring of sales KPIs.
- 5.
How can automation improve sales reporting?
Automation reduces manual work, improves data accuracy, and ensures reports are generated and delivered on time. It also enables teams to focus on analyzing insights rather than compiling data.
- 6.
What tools are used to create sales reports?
Sales reports are commonly created using CRM systems and reporting software. Solutions like Bold Reports help automate data collection, generate interactive dashboards, and deliver real-time metrics.






