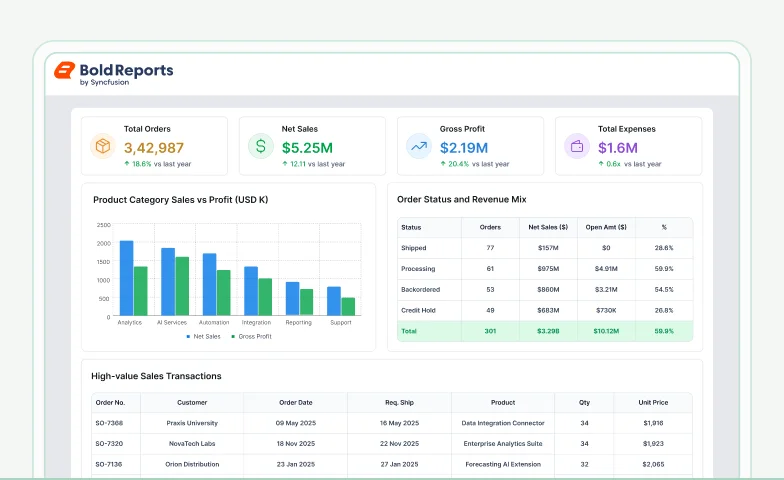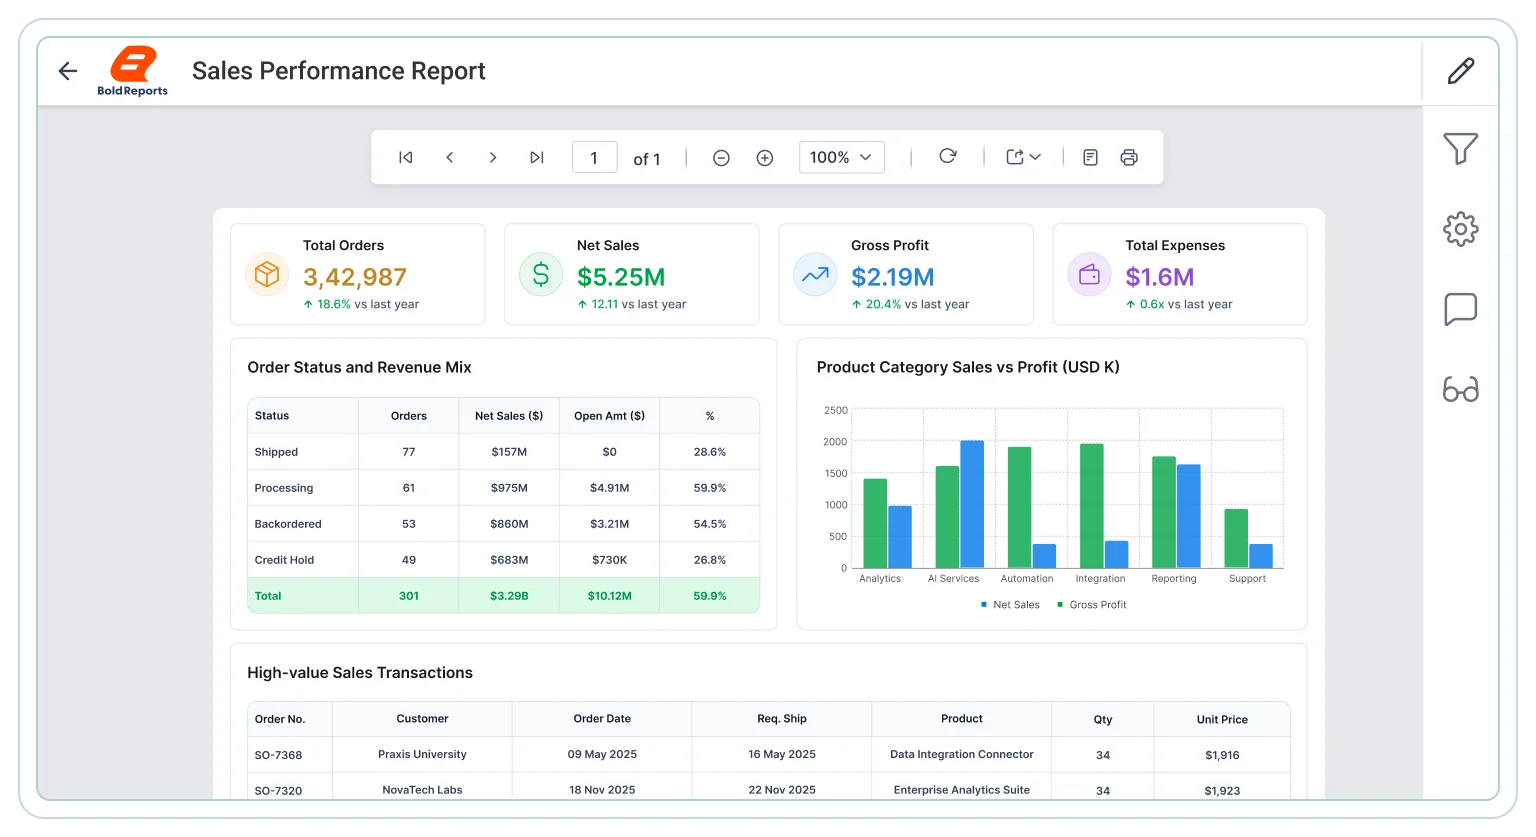







Sales Performance Report
Evaluate sales activity with a paginated report designed for trend analysis, performance comparison, and visibility into revenue growth, customer demand, product performance, and regional sales activity across recurring reporting workflows.
Editable .rdl file
i
The download includes the report .rdl file only. Upload it to Bold Reports Designer to preview, edit, and customize the report based on your requirements.
Need help customizing the report? Explore the
documentation
or
contact
our support team.
J&J
Schneider
Bridgestone
Siemens
Verizon
HP
Fidelity
Intel
Explore key use cases
Sales reporting supports revenue evaluation, demand analysis, regional comparison, and trend assessment. Bold Reports offers export-ready reports for reviews, forecasting, and performance improvement.
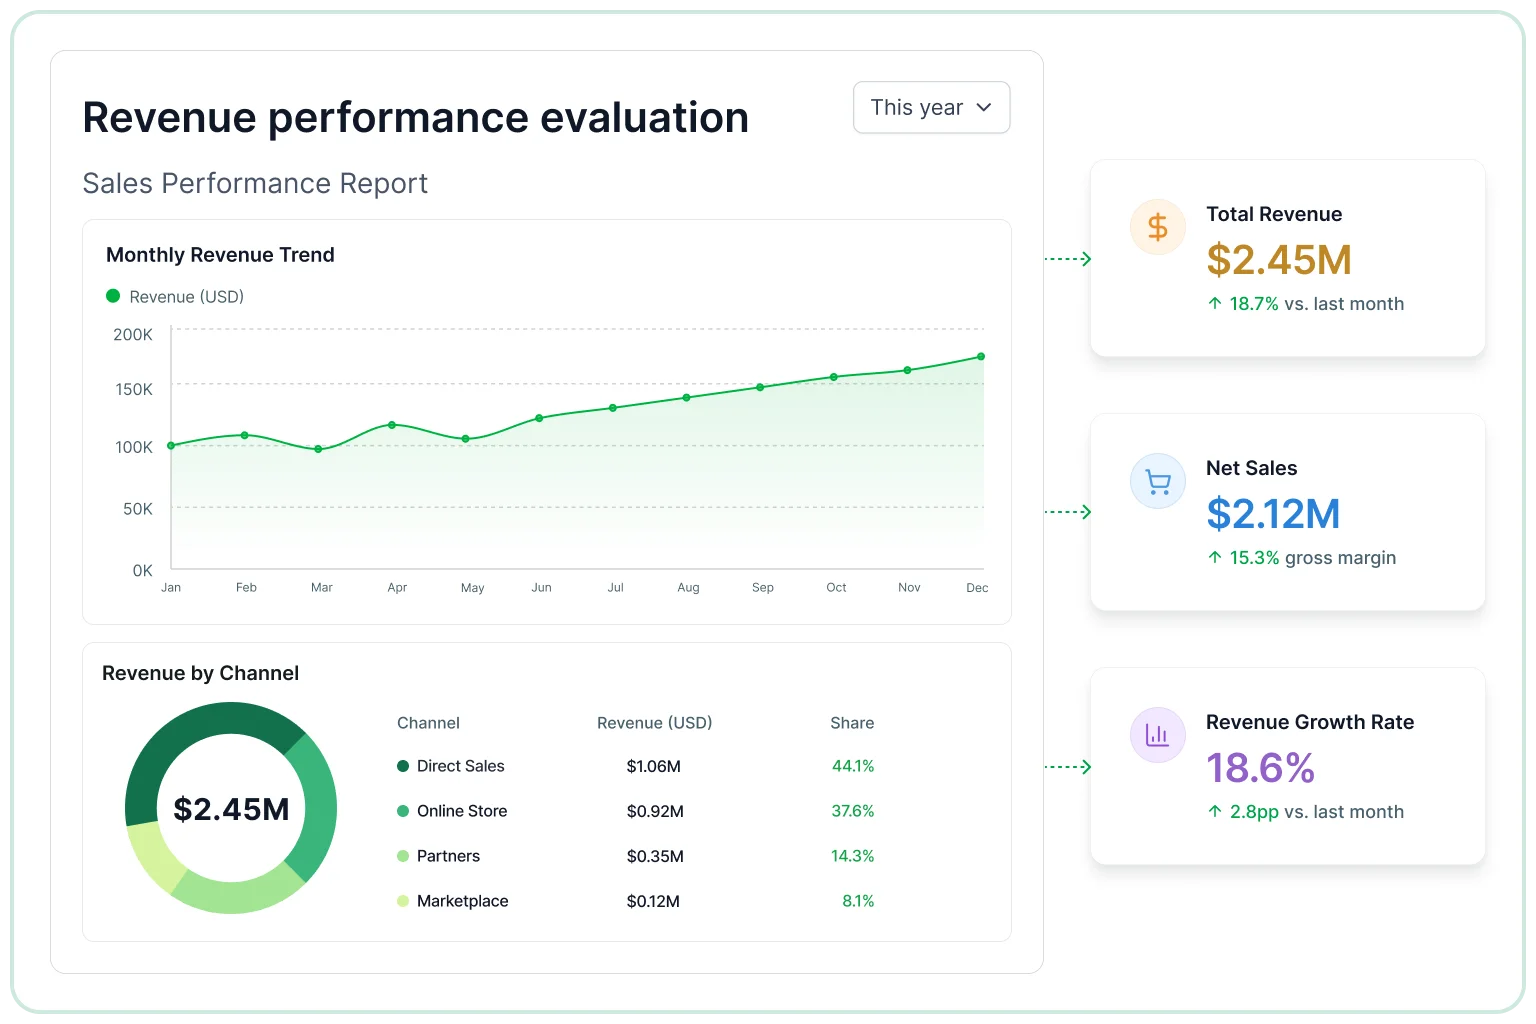
Revenue performance evaluation
Review revenue performance over time to identify growth patterns, performance shifts, and key contributors across products and regions.
- Review revenue trends across reporting periods.
- Compare sales growth against targets.
- Identify high-performing and underperforming periods.
- Evaluate contribution by product lines and regions.
- Assess overall revenue growth patterns.
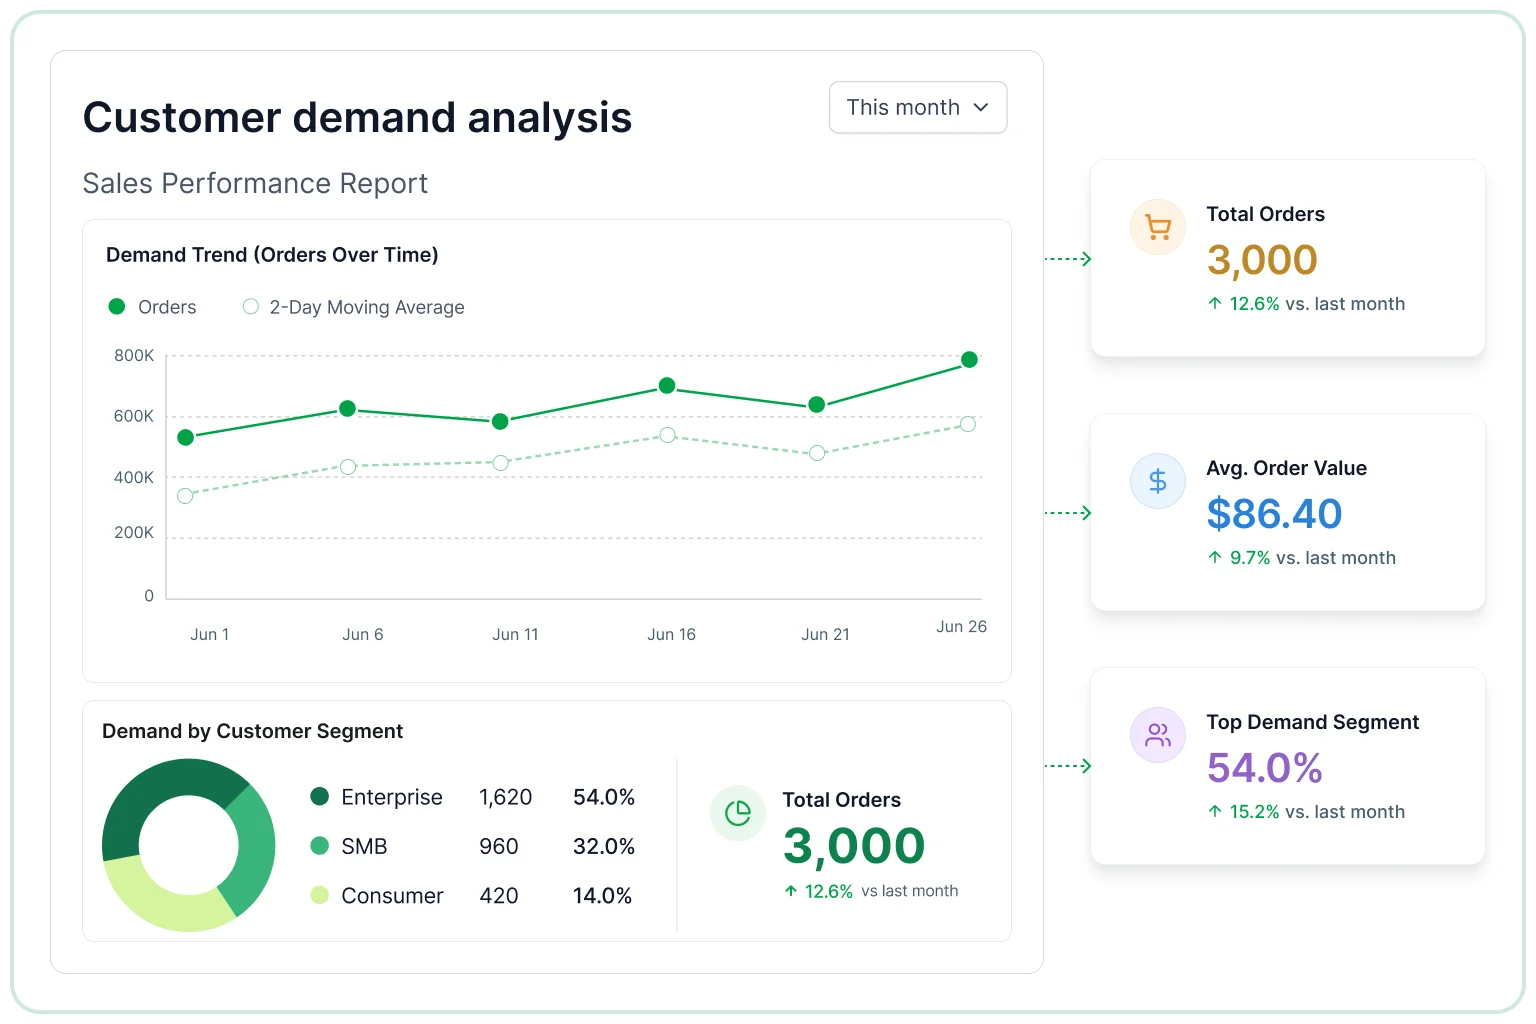
Customer demand analysis
Understand purchasing behavior and product demand to support sales planning and customer-focused decision-making.
- Review customer order patterns across reporting periods.
- Compare demand across product categories.
- Identify repeat purchase trends.
- Analyze changes in purchase frequency.
- Evaluate customer demand movement over time.
Regional sales comparison
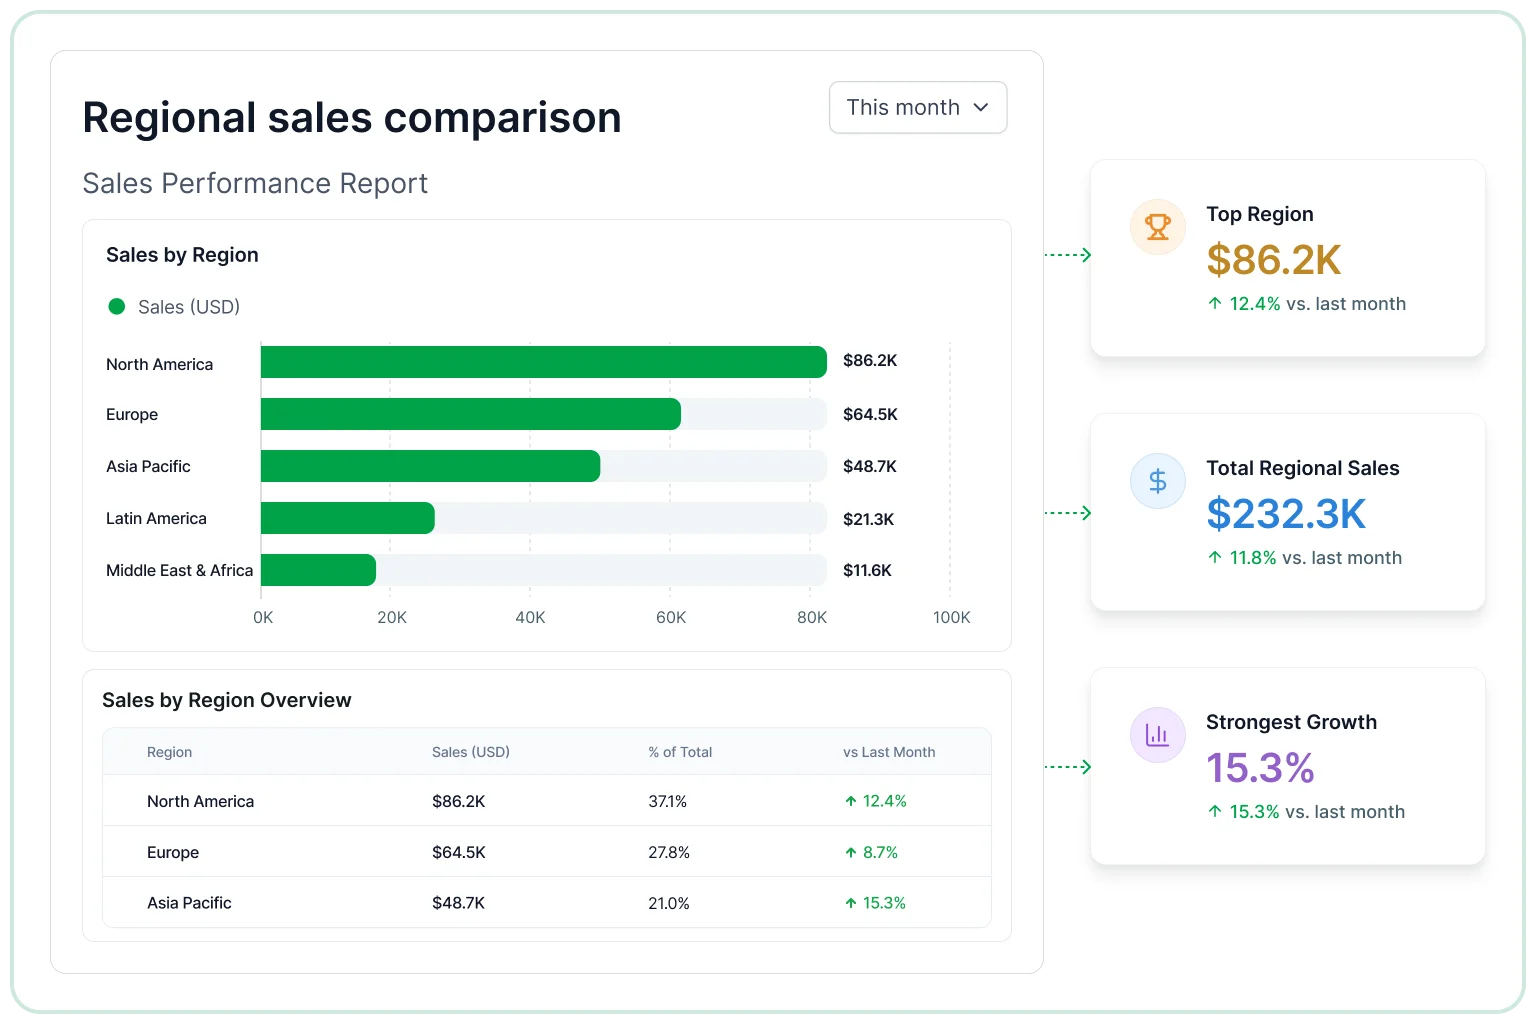
Compare geographic sales performance to identify strong markets, performance gaps, and growth opportunities.
- Review revenue contribution by region.
- Identify high-performing and underperforming markets.
- Assess demand differences across locations.
- Compare sales performance across territories.
- Evaluate regional trends over time.
Sales trend monitoring
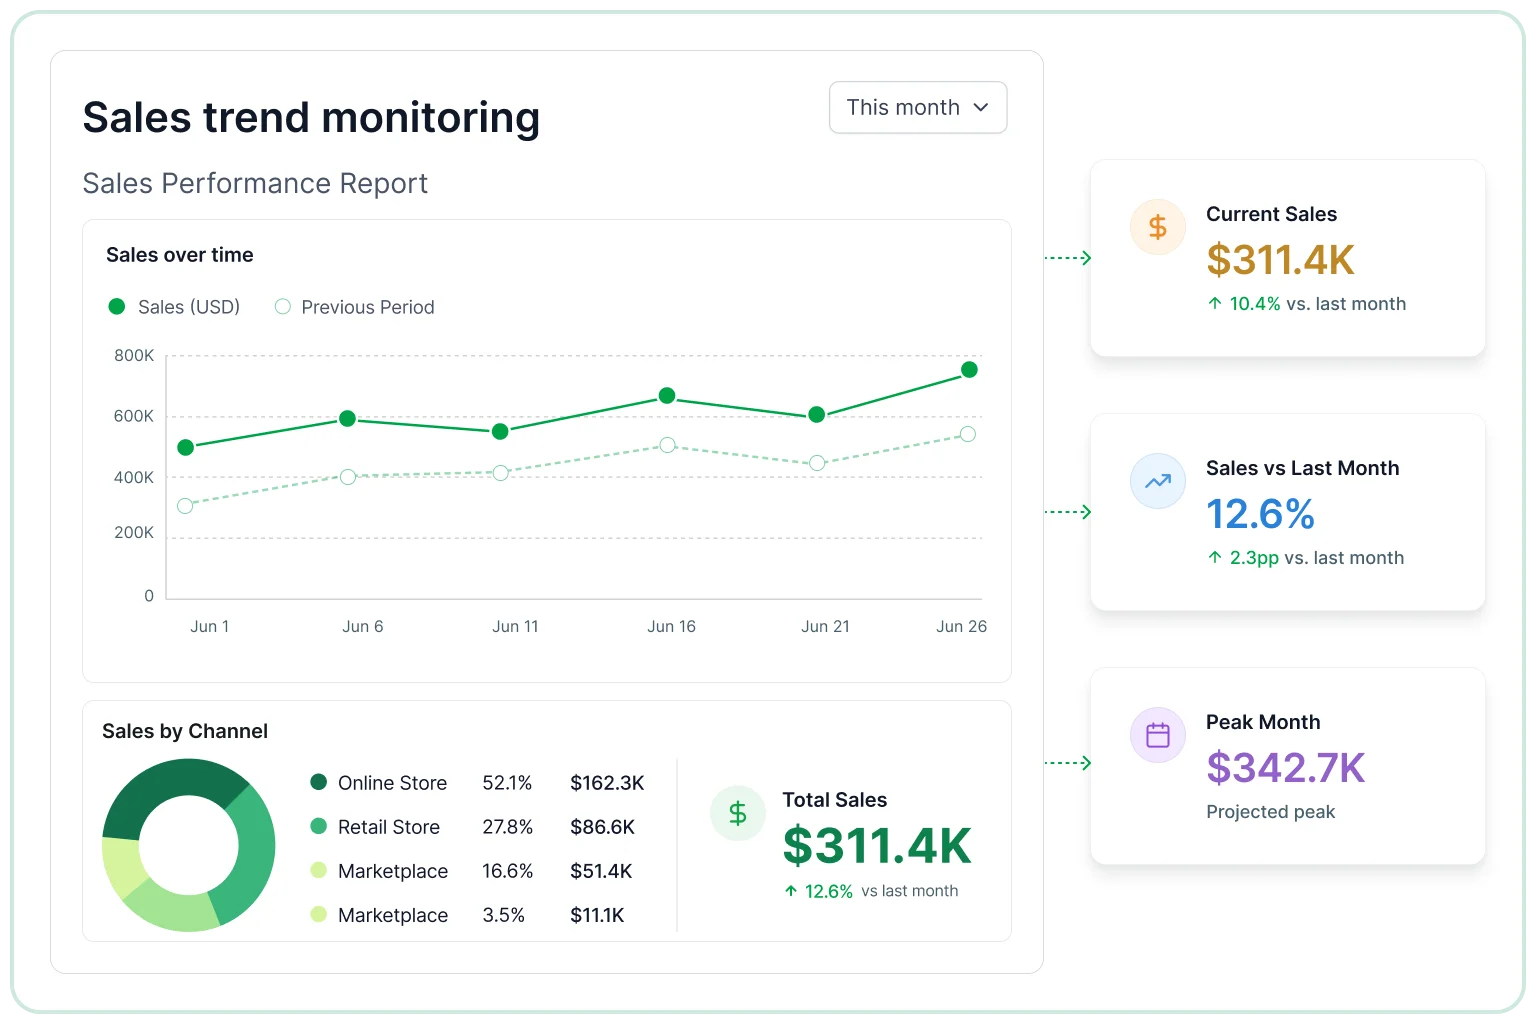
Examine sales activity over time to identify performance patterns, seasonal trends, and growth opportunities.
- Analyze historical sales performance.
- Compare results across reporting periods.
- Identify seasonal fluctuations in demand.
- Evaluate long-term sales trends.
- Track overall sales momentum.
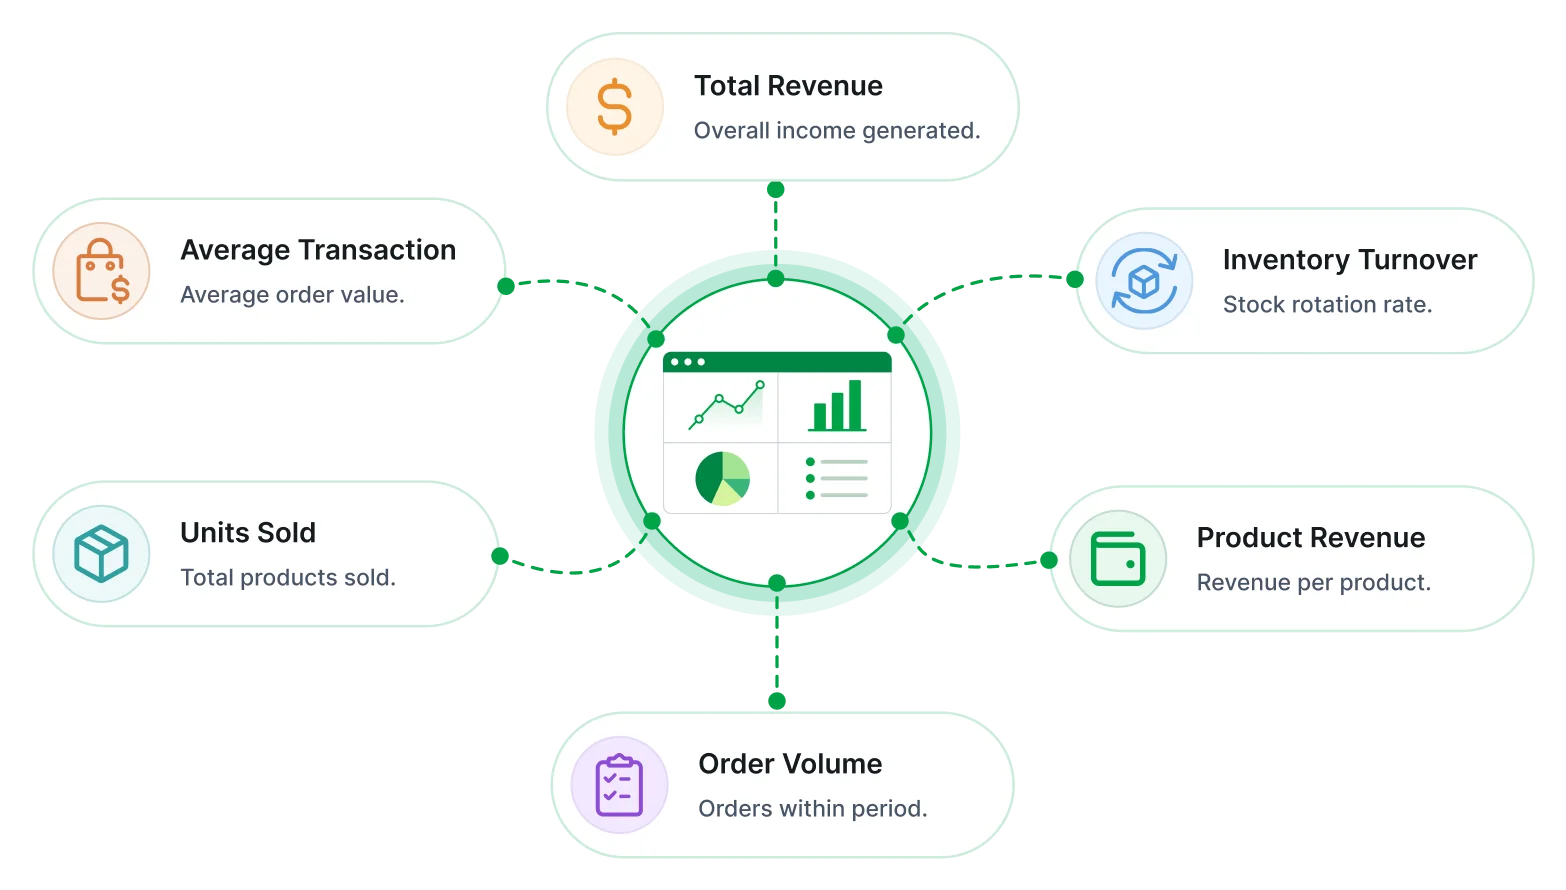
Track key metrics
These metrics help evaluate revenue performance, customer demand, sales growth, and operational effectiveness.
What is a Sales Performance Report?
The Sales Performance Report combines revenue activity, customer demand, product performance, and regional sales into a unified view. Organizations use it to evaluate sales effectiveness, identify growth opportunities, and support informed decisions.
Revenue performance visibility
Review revenue trends, sales activity, and growth performance through a consolidated reporting view.
Regional sales insights
Assess and track sales performance across regions, territories, and markets for data-driven decisions.
Customer demand analysis
Understand purchasing behavior, order activity, and product demand patterns.
Trend identification
Analyze historical sales patterns and seasonal performance changes.
Product performance evaluation
Compare product contribution and sales outcomes across categories and product lines.
Decision support
Provide actionable insights for planning, forecasting, and sales strategy development.
No credit card required.
Designed for sales and revenue teams
Get unified insights on revenue activity, customer demand, product performance, and regional sales trends for informed decisions.
Centralized reporting
Combine sales data from multiple sources into one view for consistent analysis and clearer decisions.
Revenue performance analysis
Track revenue growth, order activity, and sales outcomes over time to spot trends and gaps.
Secure and role-based access
Protect sales information with controlled permissions so only approved users can view or manage data.
Customer demand insights
Evaluate buying behavior and product demand trends to better align inventory and sales efforts.
Automated report delivery
Schedule recurring reports to support sales reviews, planning, and timely performance tracking.
Regional sales visibility
Compare sales across regions to identify top markets, growth opportunities, and performance gaps.
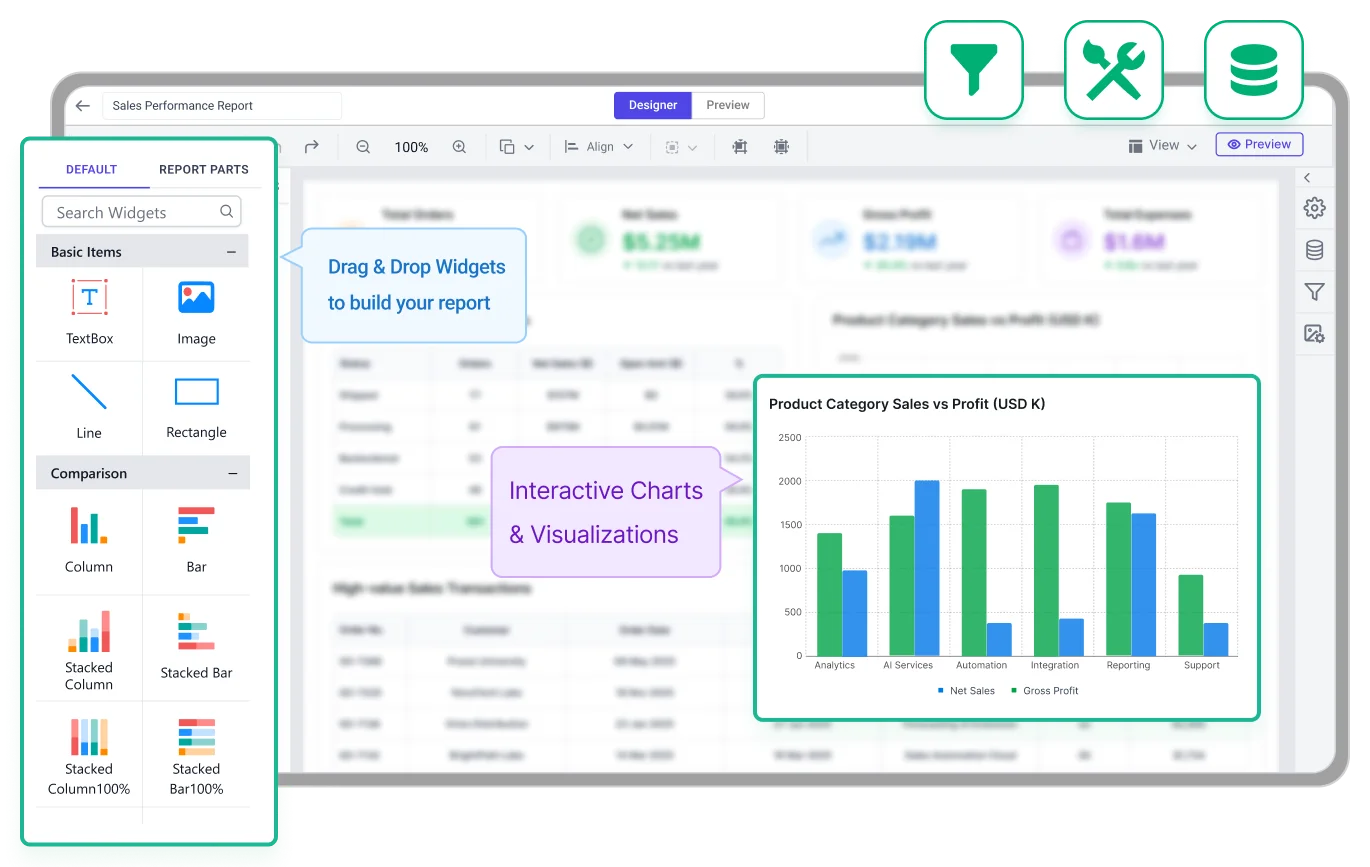
Build & customize
Sales performance reporting can be configured around KPIs, filters, and recurring delivery requirements. Bold Reports supports export-ready layouts and scheduled outputs for sales analysis and performance tracking.
No credit card required.
Sales performance report templates
Track sales performance, uncover trends, and support forecasting with structured, data-driven reporting.
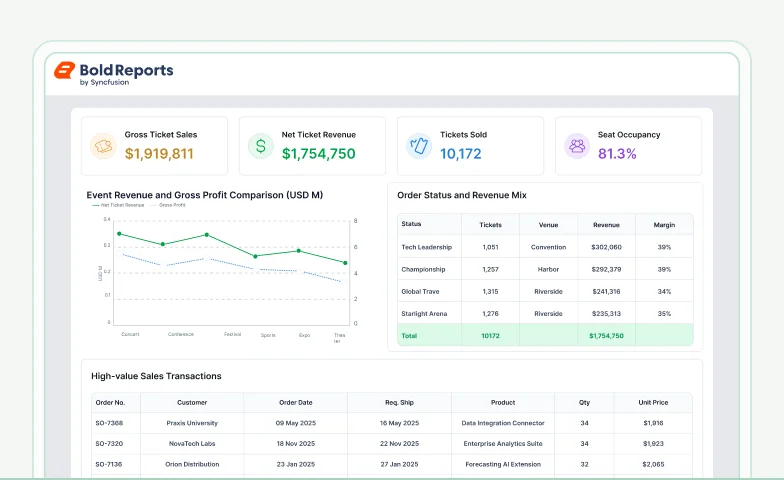
Sales Analysis Report
Explore sales data to identify trends and performance drivers.
Financial Analysis Report
Assess financial performance across revenue, costs, and profitability.
Ticket Sales Analysis Report
Analyze ticket sales, demand, events, categories, and buying patterns.
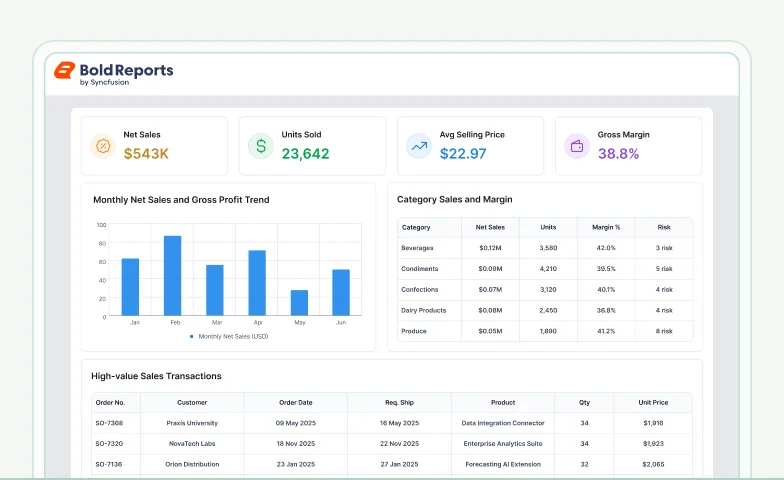
Northwind Product & Supplier Sales Report
Understand how products and suppliers impact overall sales performance.
Data integrations
Connect to over 25+ data sources from files and databases to web services for flexible integration, transformation, and storage, all ready for reporting.
Frequently asked questions
Evaluate overall sales performance across revenue, customers, and regions.
Common KPIs include revenue, sales growth, order volume, product contribution, customer demand, and regional sales performance.
Returns, refunds, and order adjustments can be incorporated into sales calculations to ensure accurate revenue and performance reporting.
Yes. Reports support period-over-period comparisons to help identify trends, growth patterns, and performance changes.
Yes. Sales metrics can be grouped by product, category, region, territory, or other business dimensions for deeper analysis.
Currency values can be standardized using exchange rates during data preparation to support consistent reporting across regions.
Yes. Reports can be scheduled to run automatically at defined intervals, helping teams maintain consistent reporting workflows.
Turn your data into production-ready reports instantly
Create pixel-perfect, print-ready reports with powerful exporting and zero complexity.
No credit card required.