
Sales Reports: The Complete Guide for 2026
TL;DR:
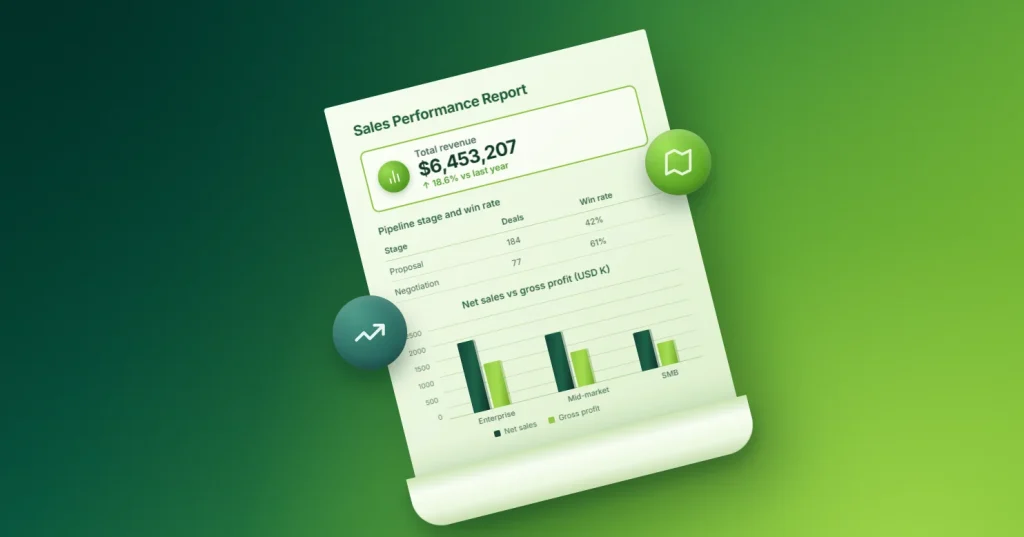
This guide covers everything you need to know about sales reports—what they are, why they matter, metrics and KPIs to track, different types and formats, and how to build one, either by starting from a template or building from scratch. It also breaks down the differences between sales reports, dashboards, and forecasts, common reporting mistakes, and what to look for in sales reporting software.
Introduction
A sales report turns scattered numbers of deals closed, revenue booked, and calls made into a single view a team can act on. Every sales organization eventually needs one. Reps use them to track quota, managers use them to spot who needs coaching, and leadership uses them to decide where to invest next quarter.
The problem is that “sales report” means different things to different people. A rep’s daily activity log, a manager’s weekly pipeline review, and a board’s quarterly revenue summary are all sales reports, but they don’t look anything alike and don’t answer the same questions.
This guide covers the full picture—what a sales report is, why it matters, metrics and KPIs worth tracking, different types and formats teams use, how sales reporting actually works, common mistakes, what to look for in reporting software, and how to build a report of your own.
What is a sales report?
A sales report is a document that summarizes sales activity and performance over a set period, whether that’s revenue, deals closed, pipeline movement, win rates, or team performance, so managers and leadership can track progress against targets and make decisions.
Most sales reports consolidate some combination of:
-
- Total revenue and revenue growth.
- Number of deals closed and win rate.
- Sales pipeline activity and stage progression.
- Individual and team performance.
- Product or service sales trends.
- Customer behavior and retention signals.
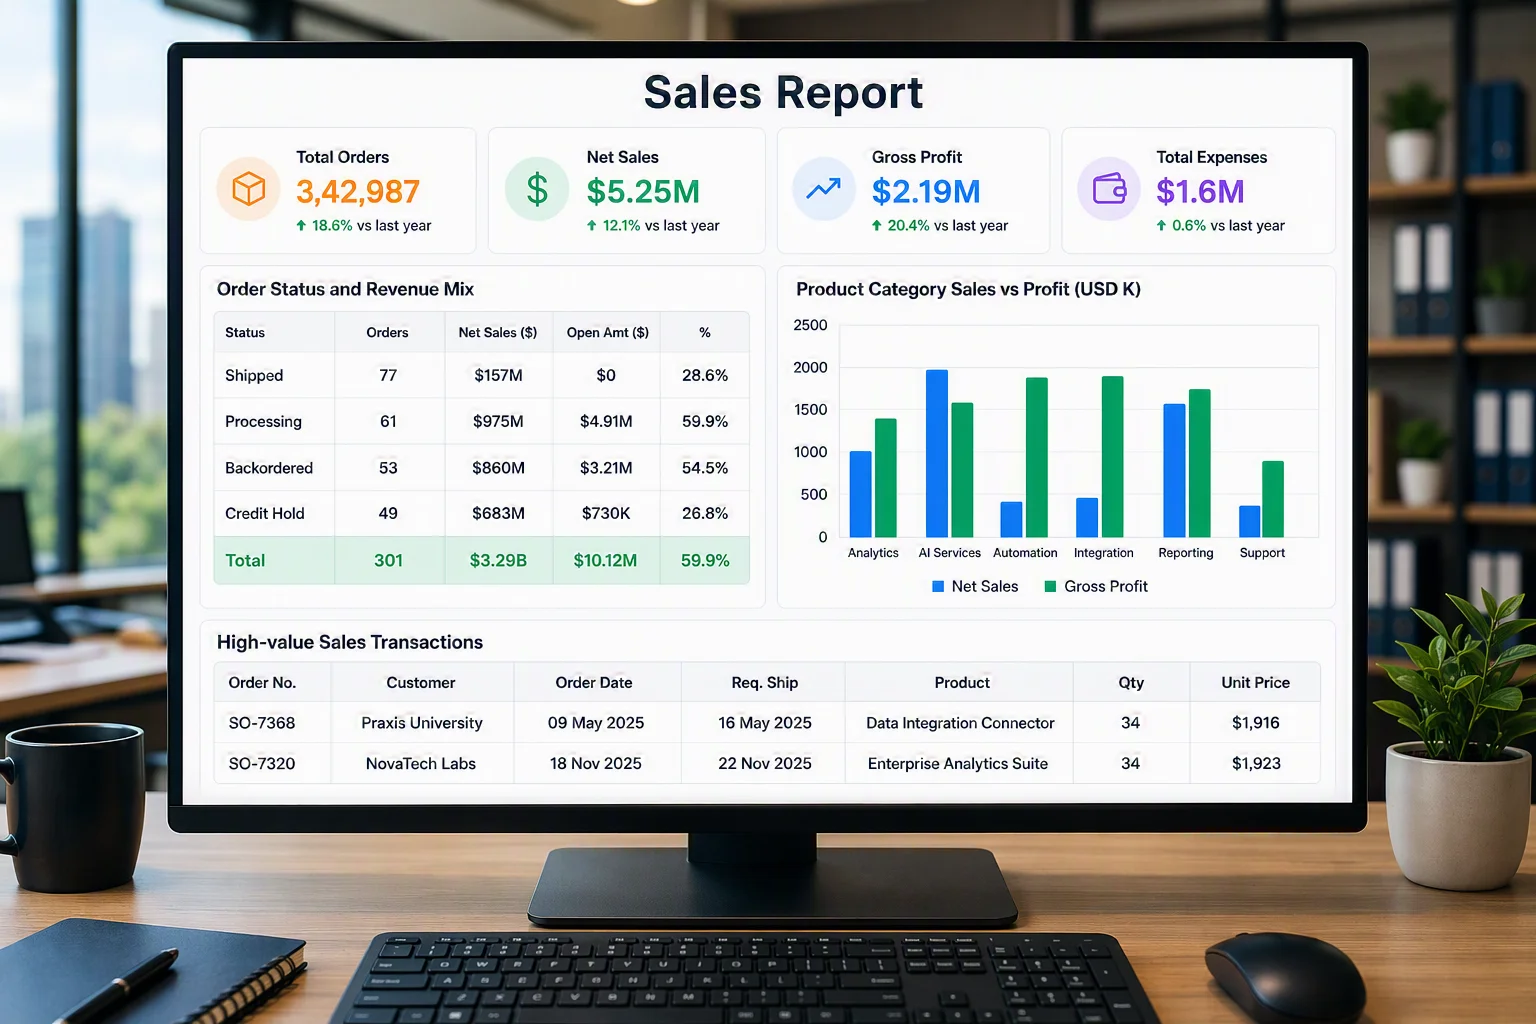
On their own, these numbers are just data. A sales report’s job is to organize them into something a specific audience can read in a few minutes and act on.
Why sales reports matter
A sales report is a strategic tool, not just a record. Done well, it changes what a team does next, and the benefits compound the longer a team reports consistently.
1. Performance measurement
Sales reports give teams a clear read on how they’re doing against target revenue, deals closed, and conversion rates, without waiting for a quarterly review to find out. A team that only checks performance once a quarter finds out about a problem three months after it started; a team reviewing weekly catches the same problem in week one.
2. Better decision-making
Reporting replaces guesswork with evidence. Teams can adjust pricing, reallocate territory, or change outreach cadence based on what the data shows, not what feels true. This matters most when intuition and data disagree, which is exactly when a report earns its keep.
3. Revenue forecasting
Historical performance and current pipeline activity, when read together, are what make revenue forecasts credible instead of aspirational. A forecast built only on this quarter’s pipeline, without historical win rates and cycle length, tends to be optimistic; a report that tracks both grounds the number in what has happened before.
4. Pipeline visibility
A report that shows every stage of the pipeline makes it possible to catch deals stalling at proposal before the bottleneck shows up as a missed quarter. Without that visibility, the first sign of a problem is usually a quota miss, which is when it’s too late to do anything about it.
5. Accountability
Visible, measurable performance data gives managers a fair basis for coaching and gives reps a clear picture of where they stand. It also removes ambiguity from performance conversations.
How sales reporting works
1. Collect the data
Pull from CRM systems, ERP platforms, e-commerce tools, and marketing platforms, wherever sales activity happens. Fragmented data sitting in four different systems is the most common reason reporting stalls before it starts.
2. Organize and centralize it
Clean and group the data by rep, region, product, or segment so it’s comparable. This step is invisible when done well and obvious when skipped, mismatched naming or duplicate records are what make a report untrustworthy.
3. Calculate the metrics
Revenue, win rate, conversion rate, pipeline value, average deal size, and other KPIs get computed from the organized data. The formulas matter less than consistency: a win rate calculated one way this quarter and another way next quarter makes trend comparisons meaningless.
4. Analyze trends
Look for patterns in which products, channels, or reps are outperforming, and where the funnel is leaking. This is the step that turns a report from a status update into something that changes a decision.
5. Visualize it
Charts, tables, and KPI cards make the analysis readable briefly. The right visualization depends on the question: trend lines for change over time, bar charts for comparison, tables when the exact number matters more than the shape.
6. Share and act
The report reaches the people who need it, ideally on a schedule, so decisions happen on a cadence instead of whenever someone remembers to pull the numbers. A report nobody opens has the same value as no report at all.
Essential sales KPIs to track
A sales report is only as useful as the metrics behind it. These are the KPIs that show up in almost every effective sales report:
-
- Total revenue and revenue growth rate: The top-line number and how fast it’s changing period over period.
- Average deal size: Total revenue divided by deals closed; a leading indicator of pricing and deal quality.
- Win rate (close rate): The percentage of opportunities that convert to closed-won deals.
Formula: (Closed-won deals ÷ total opportunities) × 100.
Example: 12 wins from 50 opportunities is a 24% win rate. For context, HubSpot’s Sales Trends Report puts the average B2B win rate at roughly 21% across all opportunities, so a rate meaningfully below that is usually a qualification or messaging problem rather than a fluke.
-
- Sales cycle length: How long, on average, it takes a deal to move from open to closed.
Formula: Total days to close ÷ number of deals closed in the period.
Example: 900 total days across 30 closed deals is a 30-day average cycle. Watch this one by segment, since a single blended average tends to hide the gap between fast, simple deals and slow, complex ones.
-
- Quota attainment: Actual performance against the target set for a rep, team, or period.
- Pipeline coverage and stage-by-stage conversion: How much pipeline exists relative to target, and where deals drop off.
- Customer acquisition cost (CAC): The total sales and marketing cost to acquire one new customer.
Formula: Total sales and marketing spend ÷ new customers acquired in the period.
Example: $50,000 in combined spending that lands 25 new customers works out to a $2,000 CAC.
-
- Customer lifetime value (LTV): Total revenue a customer is expected to generate over the relationship.
Formula: Average revenue per customer × average customer lifespan (for subscription businesses: average revenue per account ÷ churn rate is a common shortcut).
Example: A customer paying $200 a month who stays for 30 months has an LTV of $6,000.
-
- For subscription businesses specifically: Annual recurring revenue (ARR), monthly recurring revenue (MRR), and customer churn rate.
Not every report needs all of these. The right set depends on the audience. Reps care about deal-level activity, managers care about team and pipeline metrics, and leadership cares about revenue and forecast accuracy. Picking three to five that match the reader is more useful than including all nine.
Types of sales reports
Sales reports are usually organized around either a reporting cadence or a specific business question. Most organizations use some combination of both.
| Type | Focus | Best for |
| Daily sales report | Same-day transactions, activity, and performance | Reps, floor teams, and high-velocity sales teams |
| Weekly sales report | Short-term trends and team check-ins | Sales managers |
| Monthly sales report | Sales trends and quota tracking | Managers and leadership |
| Quarterly or annual report | Strategic, board-level roll-up reports | Executives and board members |
| Sales performance report | Quota attainment and rep and team results | Sales managers |
| Sales pipeline report | Deal-stage progression and funnel health | Sales operations |
| Sales forecast report | Predicted revenue vs. pipeline and history | Sales ops and finance teams |
| Sales KPI report | A handful of top-line metrics at a glance | Anyone doing a quick daily check |
| Sales activity report | Calls, meetings, and follow-ups logged by reps | Managers coaching on effort and pipeline inputs |
| Territory or regional report | Performance compared across regions or markets | Distributed or multimarket sales teams |
| Product or category report | Revenue and volume by product or category | Product, inventory, and promotional planning |
Notice that these fall into two different groups. Some are defined by cadence (daily, weekly, and monthly) and others are defined by subject (pipeline, forecast, territory, and product). In practice, most reporting tools let you apply either lens to the same underlying data, so a sales performance report can be filtered into a daily, regional, or product-level view without needing a separate report for each.
Sales reports by industry
The core metrics stay similar across industries, revenue, win rate, pipeline health, but what counts as a “deal” and what the report needs to emphasize shifts depending on how the business sells:
-
- SaaS: Recurring-revenue metrics (ARR, MRR, and churn) usually matter more than one-time deal size, since the value of a customer is spread across a subscription rather than a single transaction.
- Retail: Sales by store, category, and SKU matter alongside seasonal trend tracking, since a single revenue number hides which locations or products are driving it.
- Manufacturing: Sales reporting often sits alongside production and supply chain metrics, order volume, supplier performance, since sales figures alone don’t explain whether the business can fulfill the demand it’s generating.
- Insurance: Policy sales, renewal rates, and agent performance replace a generic “deals closed” metric, since retention and renewal matter as much as new business.
- Government and education: “Sales” reporting often becomes budget, grant, or enrollment reporting, with an emphasis on compliance and transparency rather than revenue growth.
Sales report format
Regardless of type or cadence, most well-built sales reports share the same underlying structure:
-
- Header and context: Report titles, date ranges, and applied region, team, and channel filters, mean anyone opening the report knows exactly what they’re looking at.
- Summary section: Three to five headline KPIs, revenue, quota attainment, and win rate are presented as simple numbers before any detail.
- Detail tables: The underlying data can be broken down by rep, region, product, or deal for anyone who needs to dig past the summary.
- Visualizations: Trend lines for change over time, bar charts for comparisons, and tables for exact figures match the question each chart is answering.
- Notes or commentary: A short explanation of anything unusual in the numbers helps since a chart alone can’t explain why a number moved.
The format should follow the audience, not the other way around. A rep’s daily report can skip the commentary section entirely, while a board-level quarterly report often needs more narrative than table.
Comparing sales reports, sales dashboards, and sales forecasts
These three terms often get used interchangeably, but they answer different questions:
| Sales report | Sales dashboard | Sales forecast | |
| Purpose | Analyze performance and outcomes | Monitor KPIs in real time | Predict future revenue |
| Time focus | Past and current | Current | Future |
| Update frequency | Daily to quarterly | Real time / near real time | Periodic, by forecast cycle |
| Best for | Performance analysis | Continuous monitoring | Planning and budgeting |
Most teams need all three. If you’re specifically comparing report and dashboard software, reports are for structured analysis, dashboards are for continuous monitoring. For a closer look at when to reach for each one, see our breakdown that compares dashboards and reports.
Sales report examples & templates
Seeing a real report is faster than reading a description of one. Here are three live, interactive Bold Reports examples, not static screenshots. Every filter, drill-through, and export works exactly the way it would on your own data.
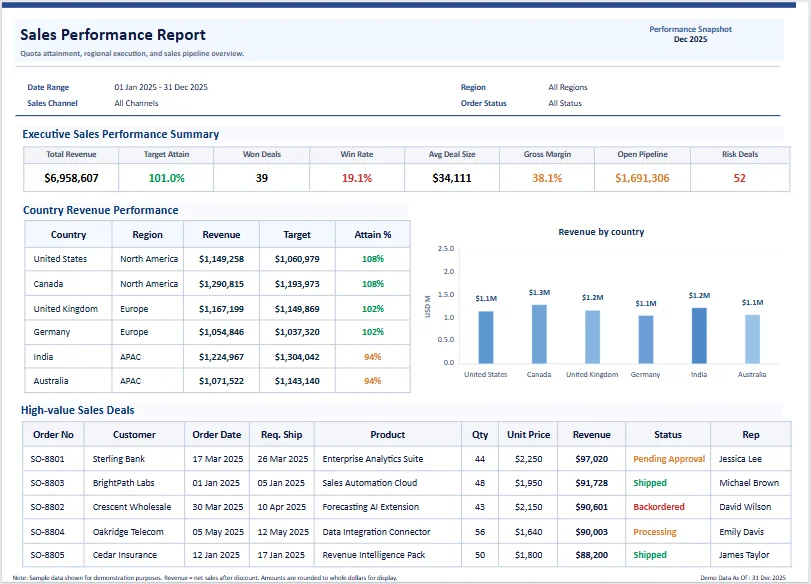
Sales performance report
Sales managers can view revenue, quota attainment, and win rates by rep and team in weekly and monthly reviews to see who’s ahead and where coaching is needed.
Sales analysis report
Sales operations teams can see pipeline stages, rep performance, and revenue forecasting in one pixel-perfect view, helping them spot patterns before they show up in the quarterly numbers.
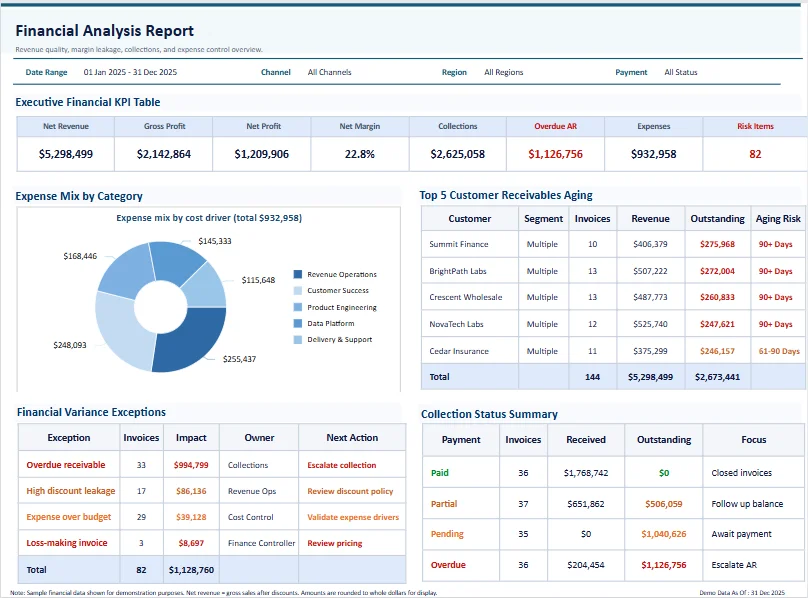
Financial analysis report
Finance and revenue teams can monitor profitability, cash flow, and margins tied directly to sales activity when they need to answer whether the business is making money.
These three are only part of the picture. Bold Reports has five live templates in total, including the northwind product & supplier and ticket sales analysis templates, each with its own live demo and editable starting point.
How to create a sales report
A well-designed sales report helps teams monitor performance, track progress toward goals, and make better business decisions. Follow these steps to create a report that is clear, relevant, and actionable.
1. Define the audience and purpose.
A report for a rep’s daily check-in and one for a board update shouldn’t look the same, even from the same data, because they’re answering different questions for different readers.
2. Pick the reporting cadence.
Usually, it’s daily or weekly for reps, monthly for managers, quarterly or annual for leadership. Let the audience’s decision cycle set the cadence, not the other way around.
3. Choose a small set of metrics.
Pull from the KPI list above and resist the urge to include everything available. Reports that try to show everything get read by no one, because nothing on the page signals what actually matters.
4. Connect your data.
Point the report at a live data source, CRM, ERP, or database, rather than a static export, so the numbers stay current without manual re-pulling every period.
5. Add visuals and filters.
Use charts for trends and comparisons, KPI cards for the numbers that need to be seen instantly, and filters so one underlying report can serve more than one audience or view.
6. Automate delivery.
Schedule the report to generate and send on its own instead of relying on someone to rebuild and resend it each period. This is usually the single highest leverage step, since it’s the one most reports skip.
Sales reporting software: What to look for
Most sales reporting tools cover the basics—a chart, a table, an export button. The differences that matter over time show up in a few specific areas:
- Automated scheduling and delivery, not just manual exports, so reports arrive on their own instead of depending on someone remembering to run them.
- Direct integration with the CRM, ERP, or billing systems you already use, rather than requiring a manual data dump before every report.
- Self-service report building for non-technical users, so a sales manager can adjust a report without filing a ticket with IT.
- Role-based access control, so a rep sees their own numbers and a manager sees the team’s, from the same underlying report.
- Export formats that match how the report will actually be used, like PDF for a board packet, Excel for further analysis, and Word for a narrative summary.
- Embeddability, if the report needs to live inside your own product rather than a separate reporting tool a customer must log into.
Bold Reports is built around this list specifically: self-service reporting for non-technical users, role-based security for access control, and embedded reporting for teams that need reports inside their own applications rather than a standalone tool.
AI and automation in sales reporting
The most immediate automation win in sales reporting is still scheduling reports that generate and deliver themselves, daily, weekly, or monthly. They remove the manual rebuild that causes most reporting to quietly fall behind until someone notices the numbers are stale.
AI is increasingly showing up on top of that layer, surfacing anomalies a reader might otherwise miss, summarizing trends in plain language, and speeding up report-building itself so less time goes into formatting and more into analysis. The Bold Reports AI SSRS expression builder is one concrete example, using AI to help write and test report expressions instead of building them by hand, one syntax error at a time.
CRM integration
A sales report is only as current as the system it pulls from. Connecting directly to your CRM, ERP, or billing platform means the numbers update automatically instead of depending on someone exporting a spreadsheet every reporting period.
This matters most for pipeline and forecast reports specifically, where the underlying deal data changes daily. A report connected live to the CRM reflects a deal that closed this morning; a report built from last week’s export doesn’t, and the gap between the two is exactly where bad decisions come from.
Common sales reporting mistakes
Tracking too many metrics
Too many KPIs make a report hard to read and dilute attention away from what matters. Lead with the three to five numbers that drive decisions and move everything else to a detail table for people who want to dig deeper.
Reporting numbers without context
A number alone doesn’t mean much. “$482K in revenue” says nothing until it’s compared to something. Show it against a target, a benchmark, or the prior period so the reader knows immediately whether it’s good or bad.
Only looking at short-term results
Short windows hide patterns; a single bad week can look like a crisis, and a single good one can look like proof a problem is solved. Track trends over time, not just the latest snapshot, before drawing conclusions.
Relying on manual reporting
Manual spreadsheets are slow and tend to fall behind the moment the person who maintains them gets busy. Automated, scheduled reports remove both the delay and the error risk.
Using inaccurate or incomplete data
A report is only as good as the data behind it, and a polished-looking report built on bad data is more dangerous than an obviously rough one, because it looks trustworthy. Validate the source before trusting the output.
Sales reporting best practices
-
- Match the report to the reader, not the other way around. Build the report around who’s reading it and what decision it supports rather than making one person adapt to a generic format.
- Keep the summary short—three to five KPIs at the top with everything else available but not front and center.
- Review cadence should match how fast the underlying activity changes. Don’t build a daily report for a metric that only moves monthly.
- Automate anything recurring. If a report goes out every week, it should generate and send itself.
- Revisit the metrics periodically. The KPIs that mattered at last year’s team size or growth stage may not be the right ones now.
Final thoughts
A sales report only works if the right person reads it, and that depends on matching the format, the metrics, and the cadence to who’s on the other end. Use the KPI and type breakdowns above to figure out what your report needs to include, then either start from one of the five live templates or build your own from scratch.
Ready to put this into practice? Start your free trial, no credit card required, or explore the full sales reporting solution.
Frequently asked questions
-
- 1.
What is a sales report?
A sales report is a document that summarizes sales activity and performance over a set period, including data on revenue, deals closed, pipeline activity, and team performance, so managers and leadership can track progress and make decisions.
- 2.
Why are sales reports important?
They replace guesswork with evidence. They show what’s working, flag pipeline problems early, support accurate forecasting, and give managers a fair basis for coaching and accountability.
- 3.
What should a sales report include?
Most sales reports include total revenue, deals closed, win rate, and a breakdown by rep, region, or product. The exact mix depends on the audience and reporting cadence.
- 4.
How often should sales reports be generated?
It depends on the audience. Reps and floor teams often need daily views, managers typically review weekly or monthly, and leadership generally works from monthly, quarterly, or annual roll-up reports.
- 5.
What’s the difference between a sales report and a sales dashboard?
A sales report is a structured, point-in-time analysis built for a specific audience. A sales dashboard is a live, continuously updated view built for ongoing monitoring.
- 6.
What are the most important sales KPIs?
Total revenue, win rate, average deal size, sales cycle length, and quota attainment cover most use cases. Subscription businesses should also track ARR, MRR, and churn rate.
- 7.
Which software is best for creating sales reports?
The best option is one that meets specific needs. Look for automated scheduling, direct CRM or ERP integration, self-service report building, role-based access control, and embeddability if the report needs to live inside your own application. Bold Reports covers all five.
- 1.






