
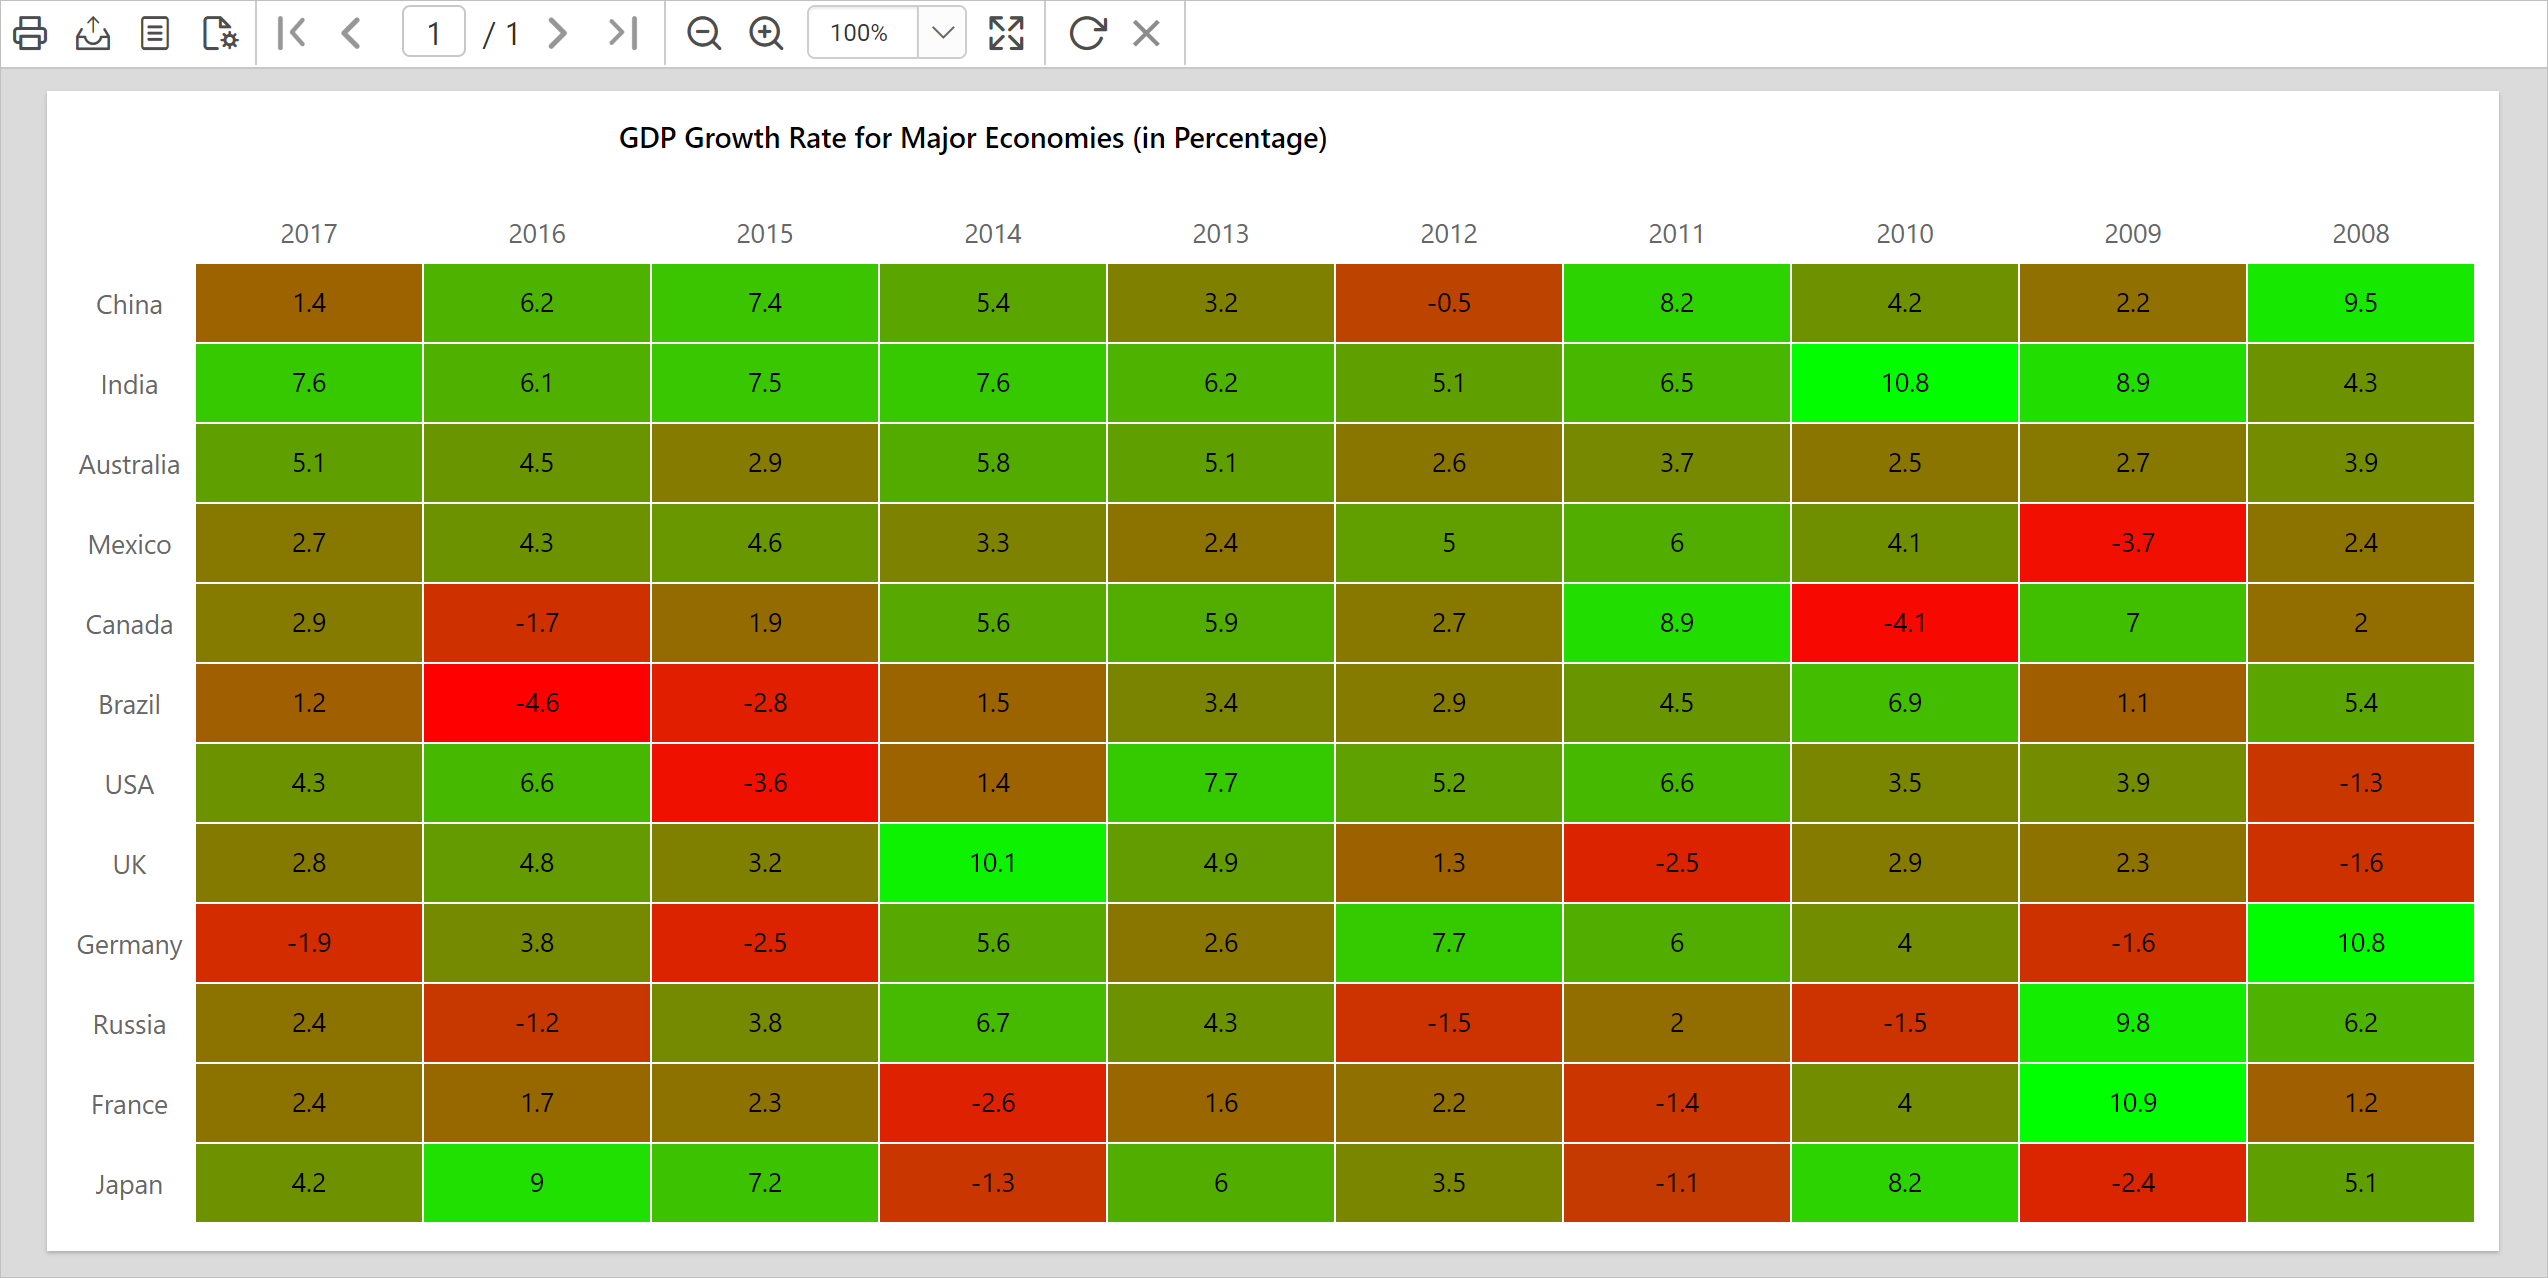
In this blog post, we are going to create a heat map to visualize the gross domestic product (GDP) growth rate of major economies over time using colors in a matrix. We can achieve this scenario using expressions, but a big drawback with generating heat maps using an expression is that the color scale must be predefined. To overcome this, we can use the concept of custom code in SSRS.
Custom code must be written in VB .NET. It is saved as part of the Report Definition Language. Any expression can call custom code embedded into a report, and therefore we can use custom code multiple times in a single report. You can create and embed multiple custom functions in a report.
Writing a VB .NET custom function
First, to make the color variations dynamic, we need to create a mathematical function that will generate a list of background colors based on input parameters. Here, I have written a custom VB.NET function that basically returns a hexadecimal color code based on three arguments.
Function GetHeatMapColor(data As Decimal, min As Decimal, max As Decimal) As String
  Dim colorR As Byte = 255
  Dim colorG As Byte = 255
  Dim colorB As Byte =  0
  Dim pointVal as Decimal =  (data - min) / (max - min)
  colorR = colorR - ( pointVal  * colorR)
  colorG = colorG * pointVal
  Return "#" & Right("0" & Hex(colorR), 2) & Right("0" & Hex(colorG), 2) & Right("0" & Hex(colorB), 2)
End Function
It will generate a color variation between red and green; red on the low end and green at the high end.
Designing a report and data feed
First, create a new report or open an existing report in Bold Reports Designer. Here, I am going to showcase a demo using an already-created matrix report. You can refer to the “Design SSRS matrix report” documentation for how to design a matrix report. To feed data to this report, I have used the GDP growth rate JSON data of major economies from the years 2008 to 2017 and transformed the JSON data into rows and columns using SQL Query. The data set contains Country, Year, and GDP columns.
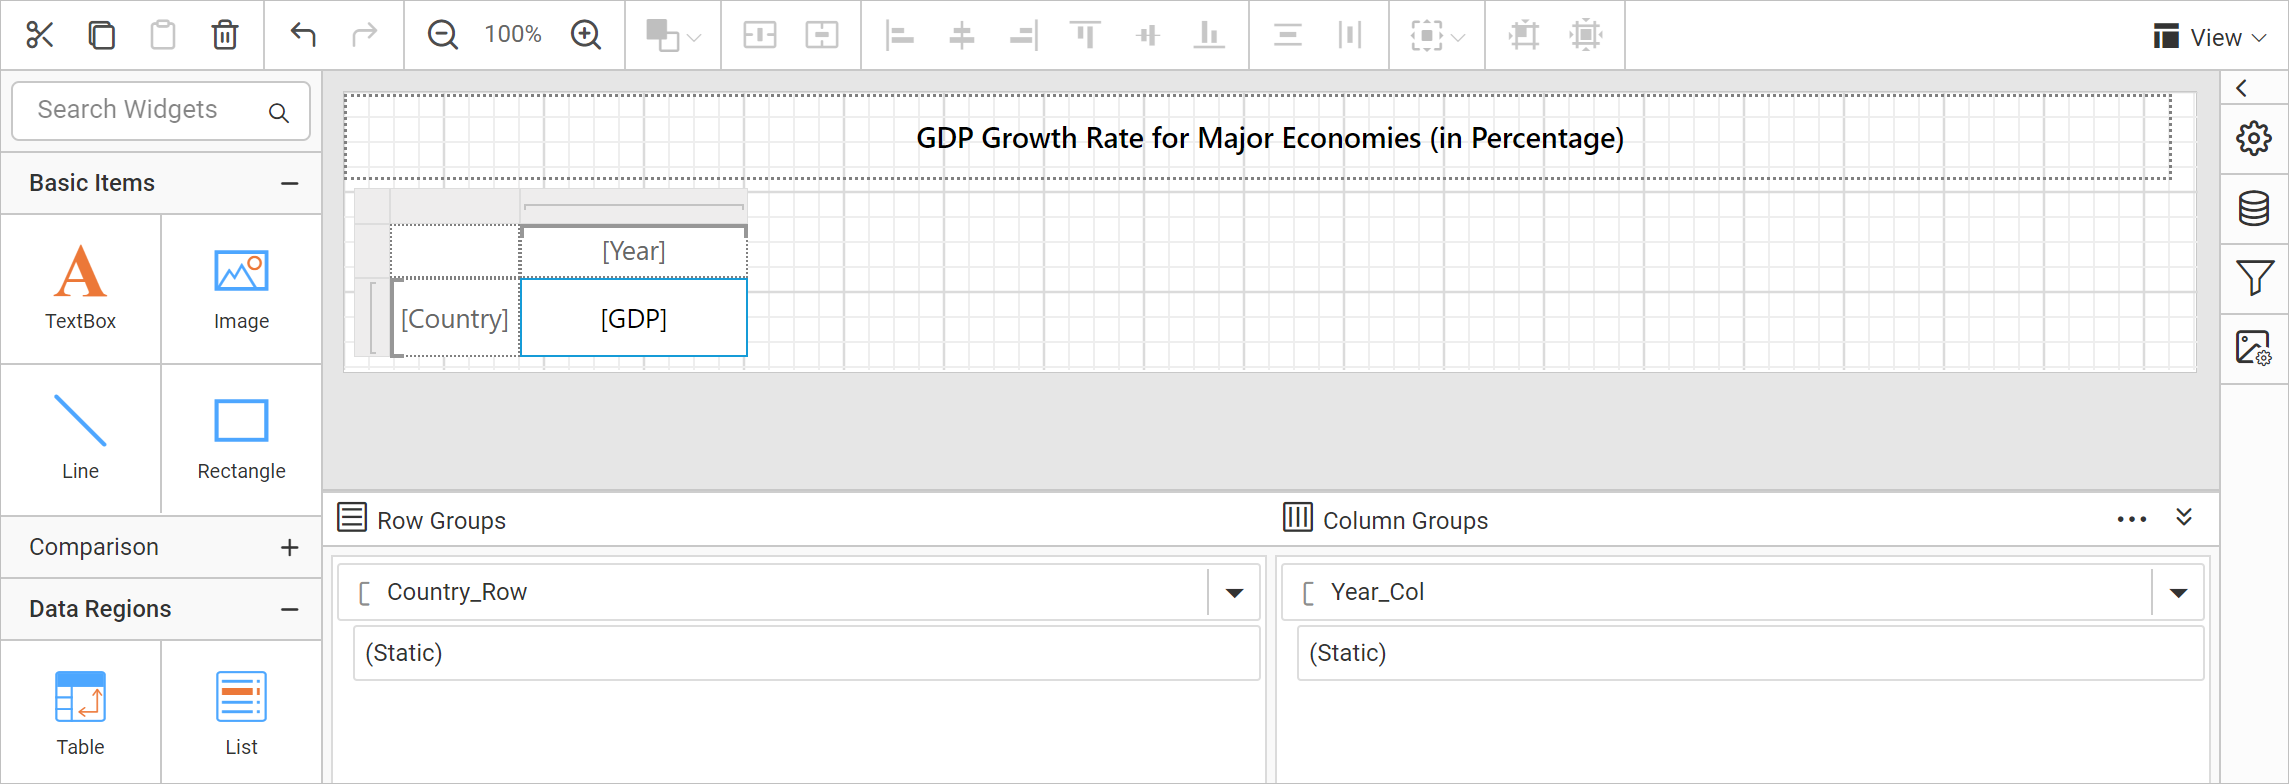
You can download the report design: GDP heat map sample report.
Embed custom code
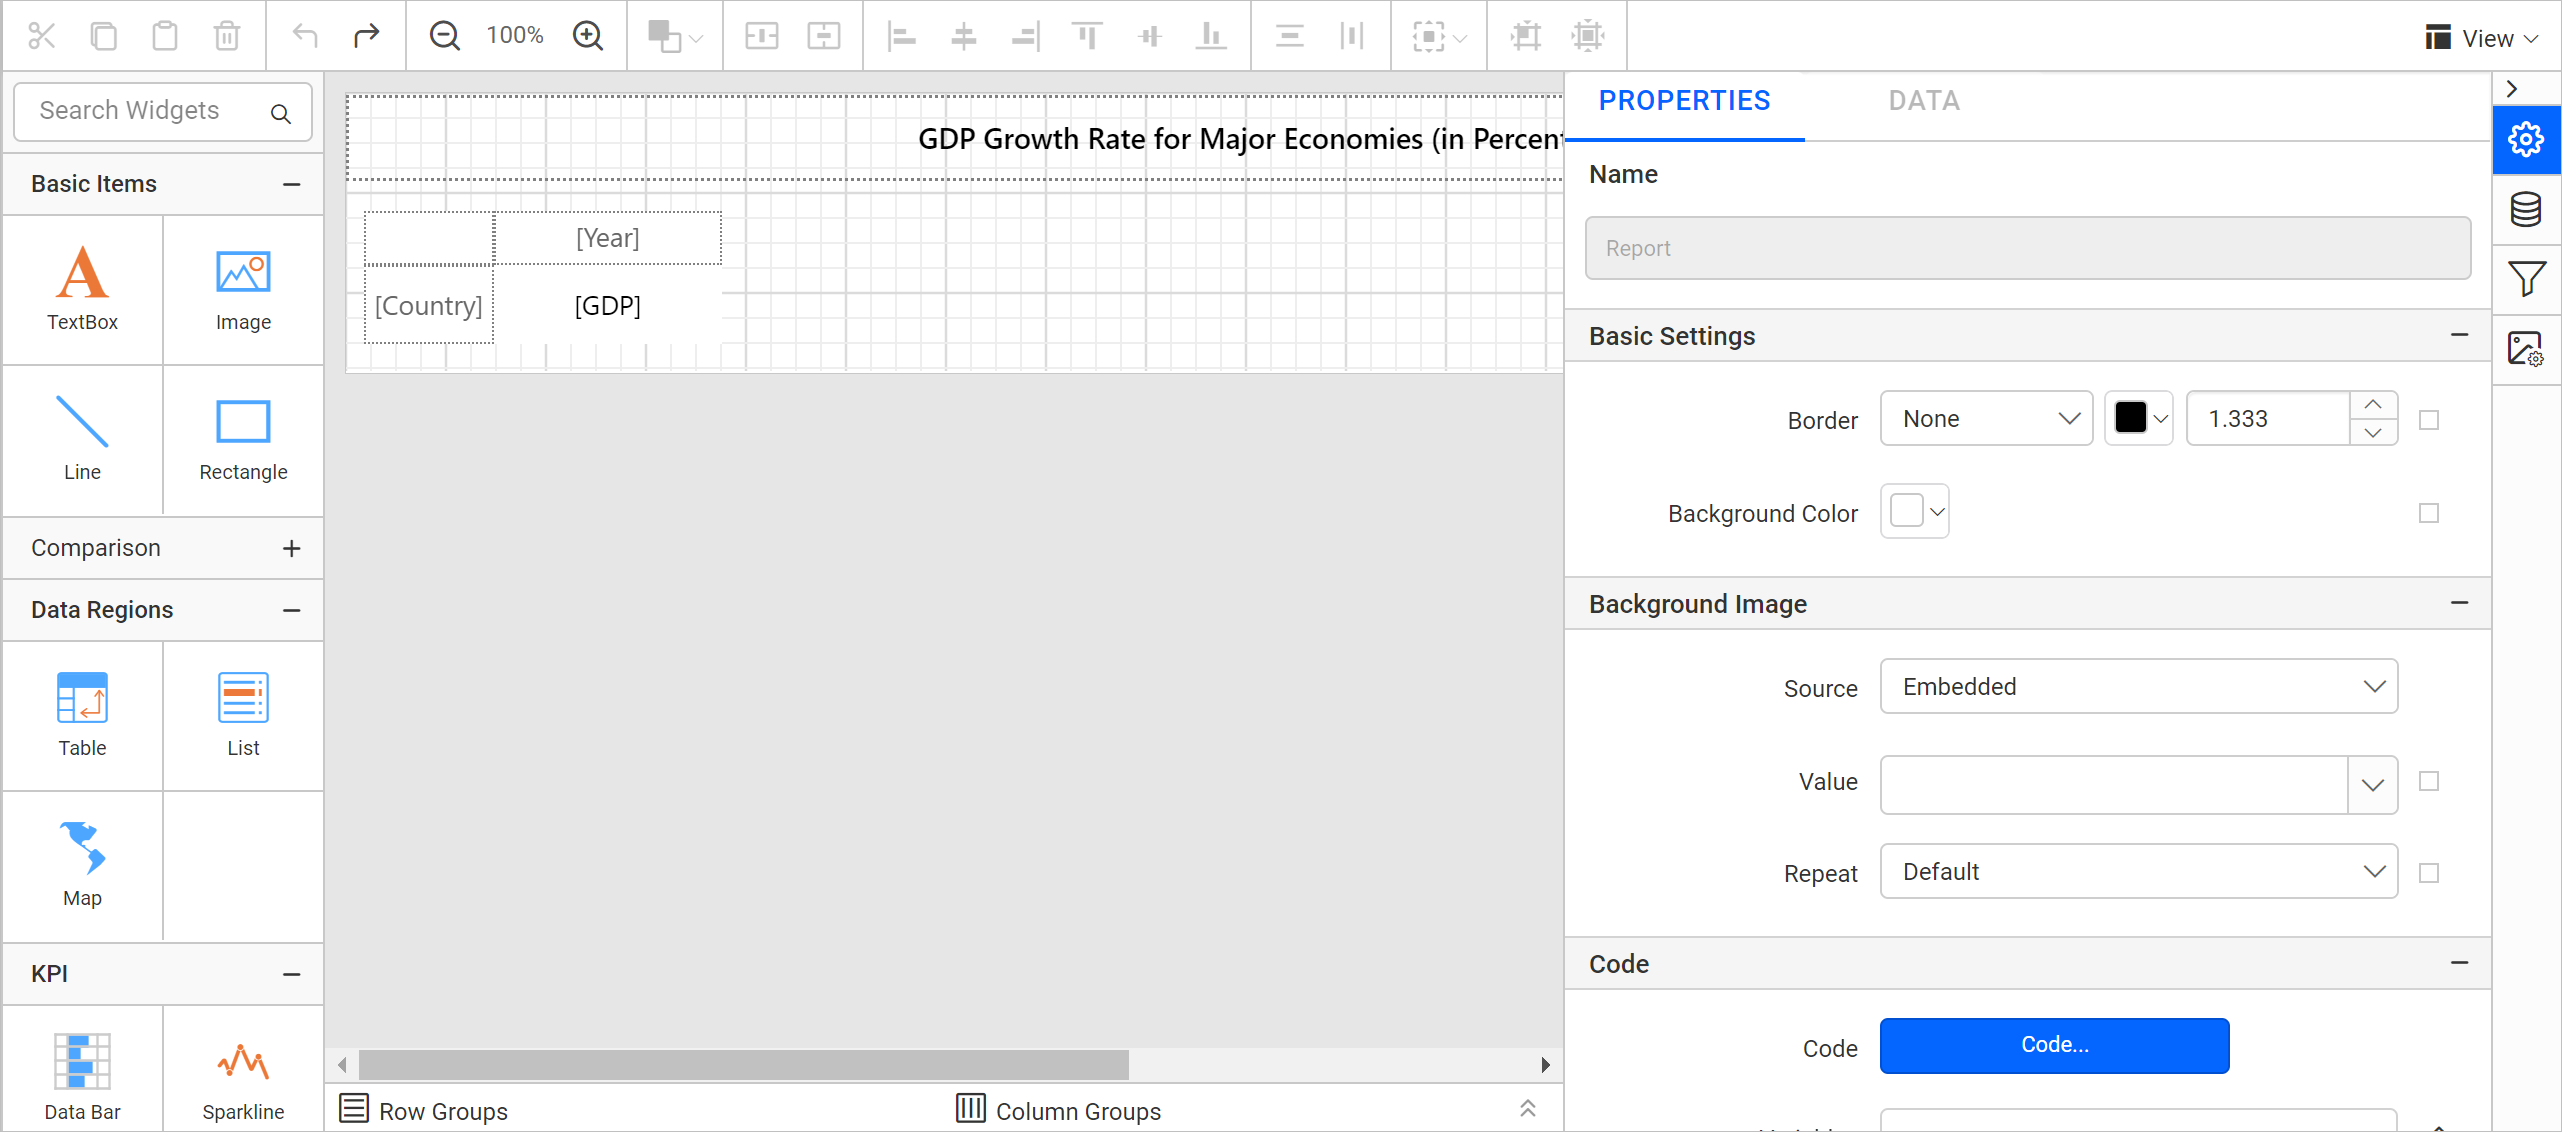
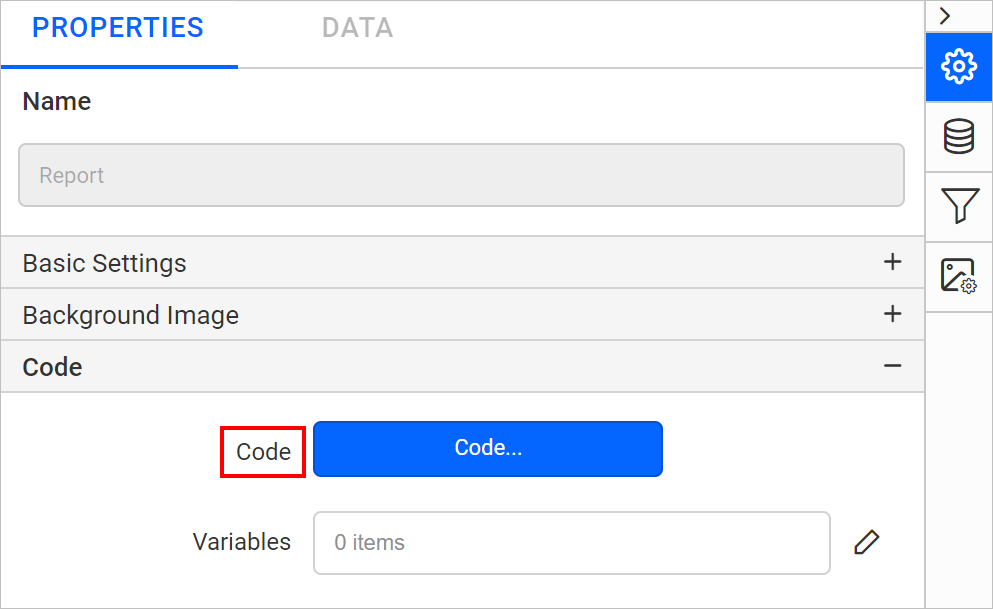
Now, let’s embed the custom function in a report using the Code property available under report properties.
- In the properties panel, open the report properties.
Report properties view - Under the Code category, click Code to open the Code Module.
Code property listed in properties panel - In the Code tab, enter the custom code function snippet.
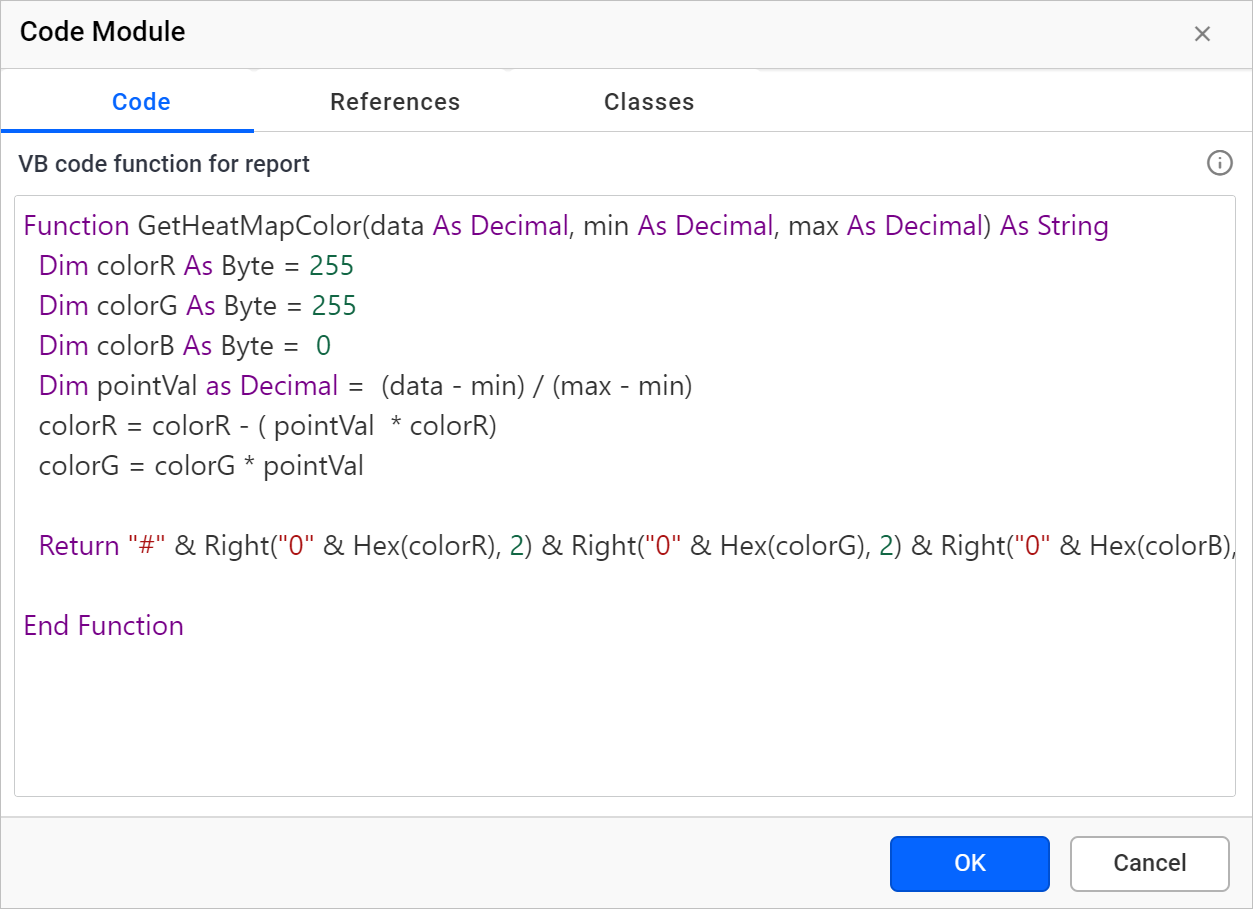
Embed custom code in Code property - Click OK.
Refer to the “Code Module” documentation to learn in detail about the other options.
Generate heat map using custom code
You can call the embedded custom code using expressions. To generate a heat map based on the GDP growth rate range, set an expression for the background color property of a [GDP] cell in the matrix. To call the function embedded in the custom code property, you must follow the below syntax:
=Code.FunctionName(Parameter1,Parameter2,...,ParameterN)
Select a matrix cell that holds a [GDP] data field and open the properties panel.
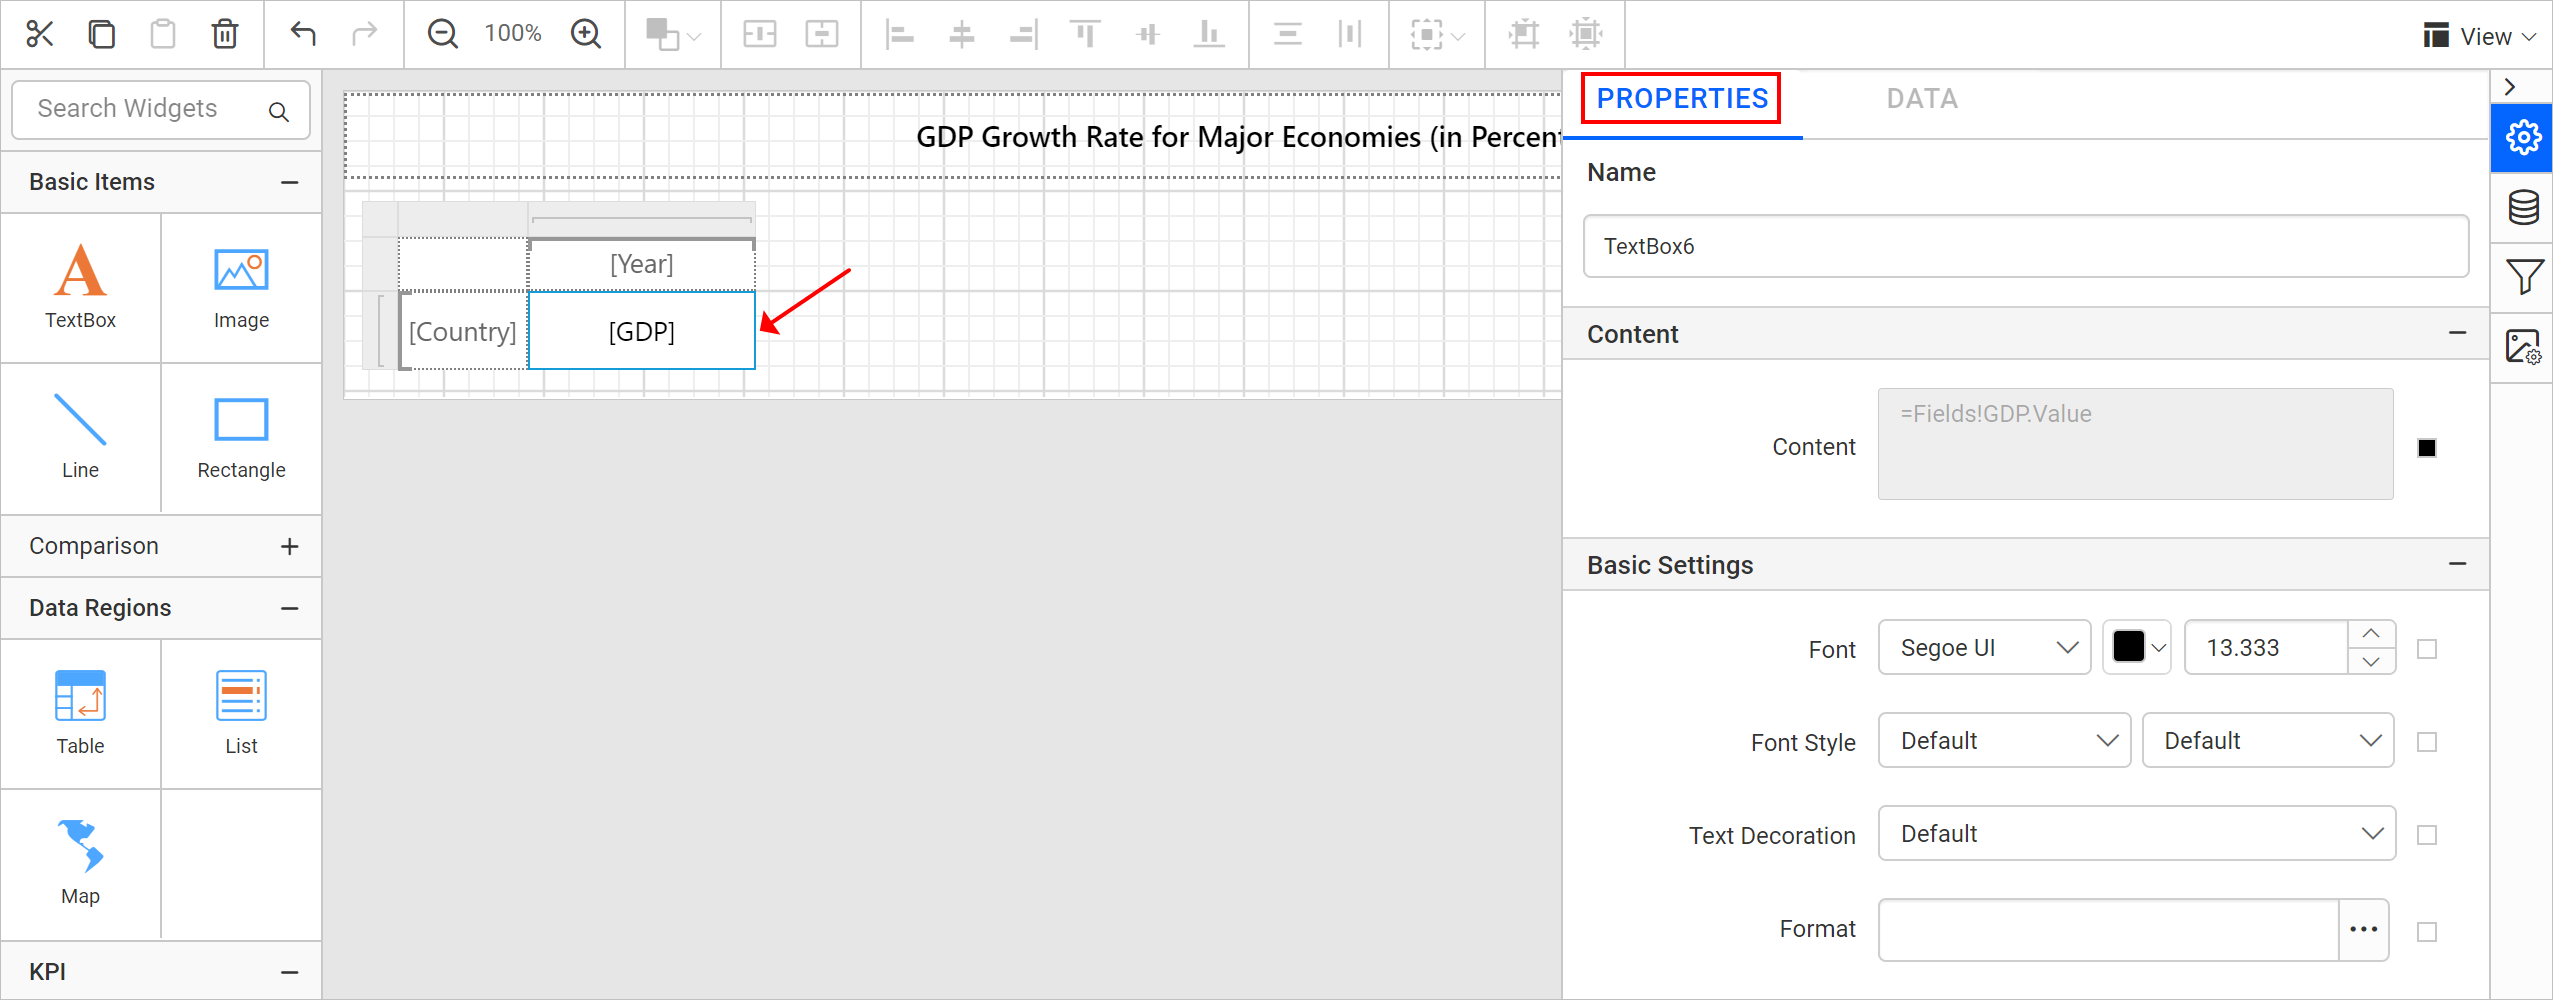
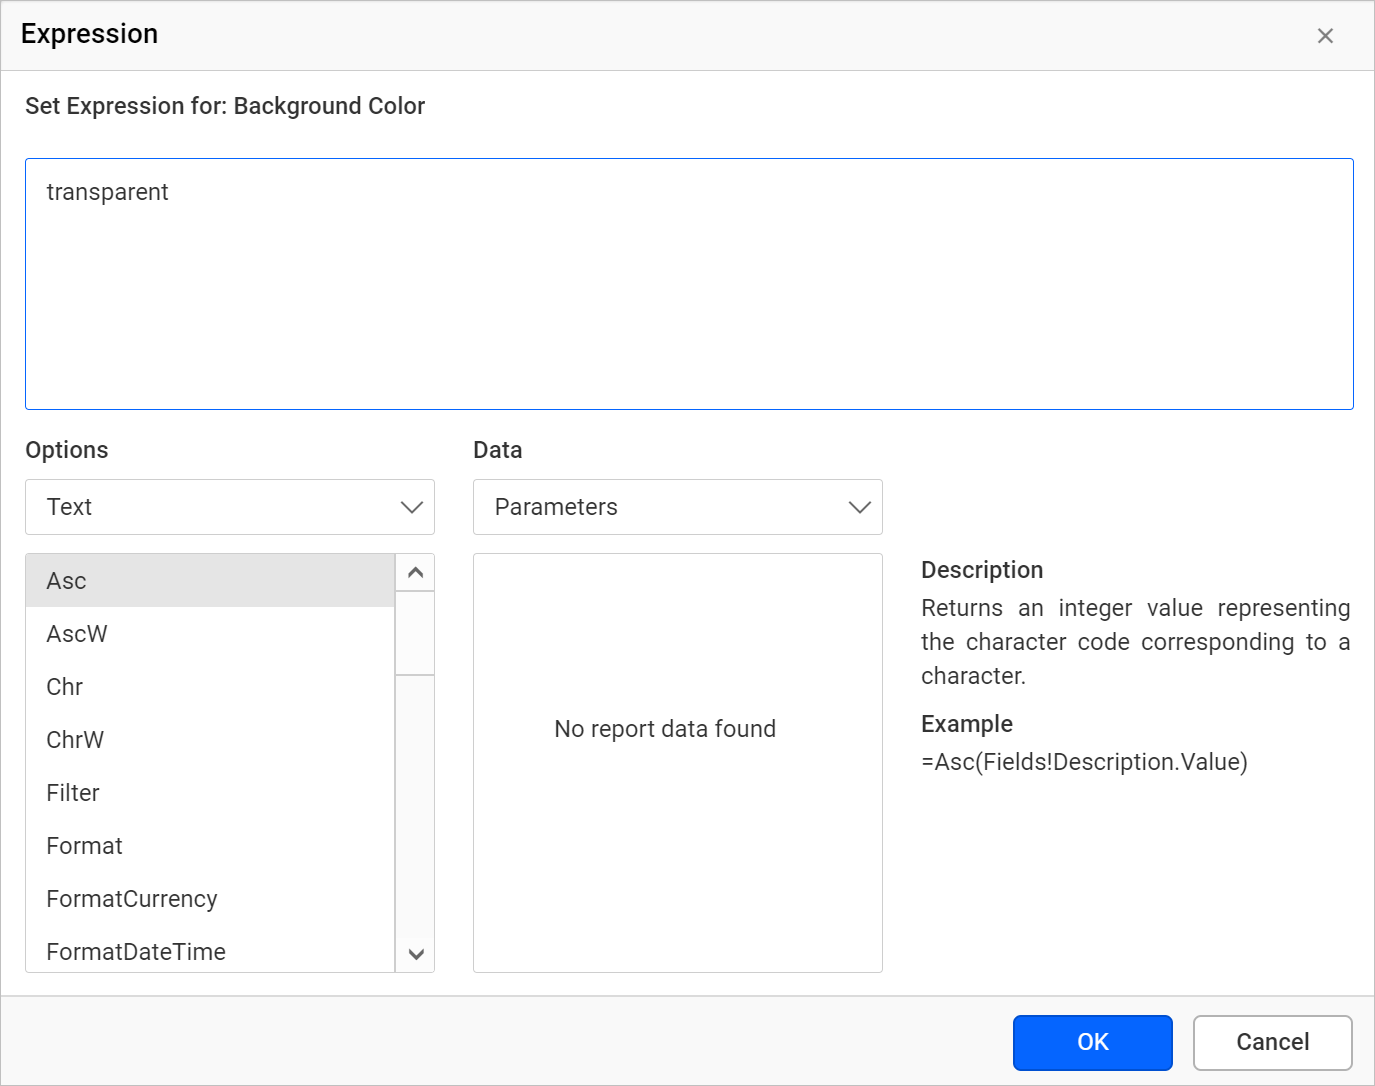
Under the Appearance category, open the expression builder for the Background color property.
Enter the following expression in the expression builder.
=Code.GetHeatMapColor(Fields!GDP.Value, MIN(Fields!GDP.Value, "GDPGrowthData"), MAX(Fields!GDP.Value, "GDPGrowthData"))
Our goal is to generate a heat map based on GDP growth rate. So, in the previous expression, I am passing the GDP data set field value and the minimum and maximum values of the GDP data set field as parameters for GetHeatMapColor custom code function.
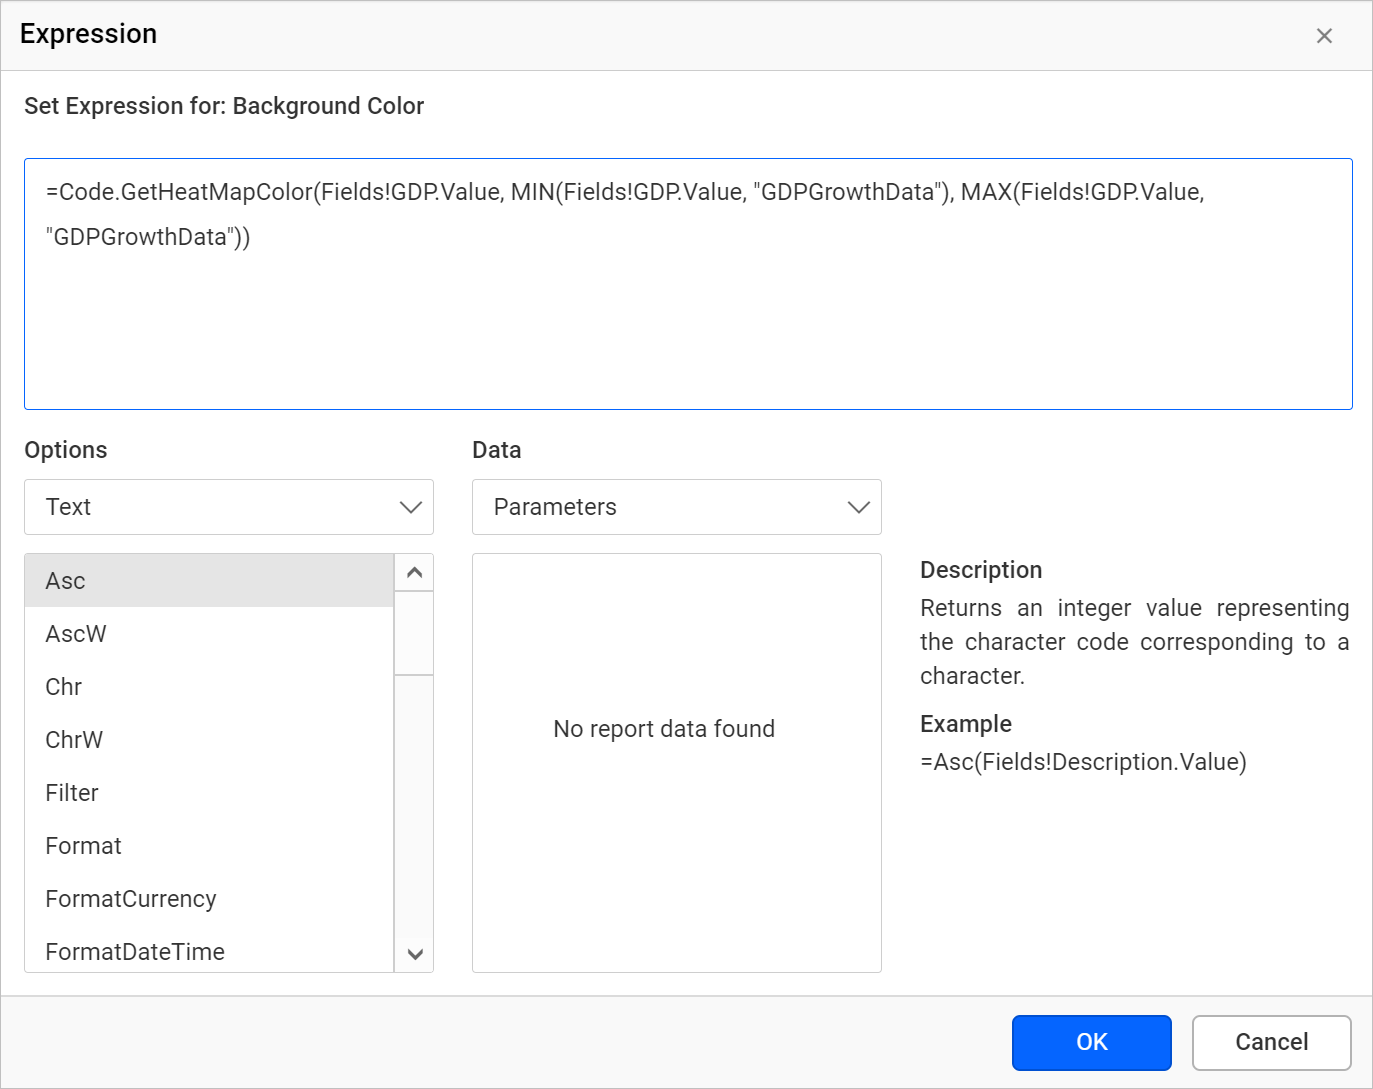
Click OK.
Report preview
At run time, the background color for each cell value is applied by processing the GDP growth rate value of specific cells with minimum and maximum GDP growth rate values in the GetHeatMapColor custom function.
Conclusion
In this blog, we have learned how to create a heat map in a matrix using the custom code function. To explore further, go through our sample reports and Bold Reports documentation. I have also attached the generated .rdl file for further reference.
If you have any questions, please post them in the comments section. You can also contact us by submitting your questions through our contact page or, if you already have an account, you can log in to submit your support question.
Bold Reports now comes with a 15-day free trial with no credit card information required. We welcome you to start a free trial and experience Bold Reports for yourself. Give it a try and let us know what you think!
Stay tuned to our official Twitter, Facebook, LinkedIn, Pinterest, and Instagram pages for announcements about releases.