
Power BI vs. SSRS: Which One Should You Choose in 2026?

TL;DR:
- Choose Power BI if you need dashboards, self-service analytics, and data exploration.
- Choose SSRS if you need pixel-perfect and paginated operational reports.
- Choose a hybrid or alternative like Bold Reports® if you want modern SSRS with flexibility without rebuilding everything.
Introduction
In 2026, the debate between Microsoft Power BI and SQL Server Reporting Services (SSRS) is still creating confusion for many organizations. At first glance, many organizations assume the choice is obvious: Power BI feels modern and cloud-first, while SSRS appears older and tied to traditional SQL Server environments. But that comparison is misleading.
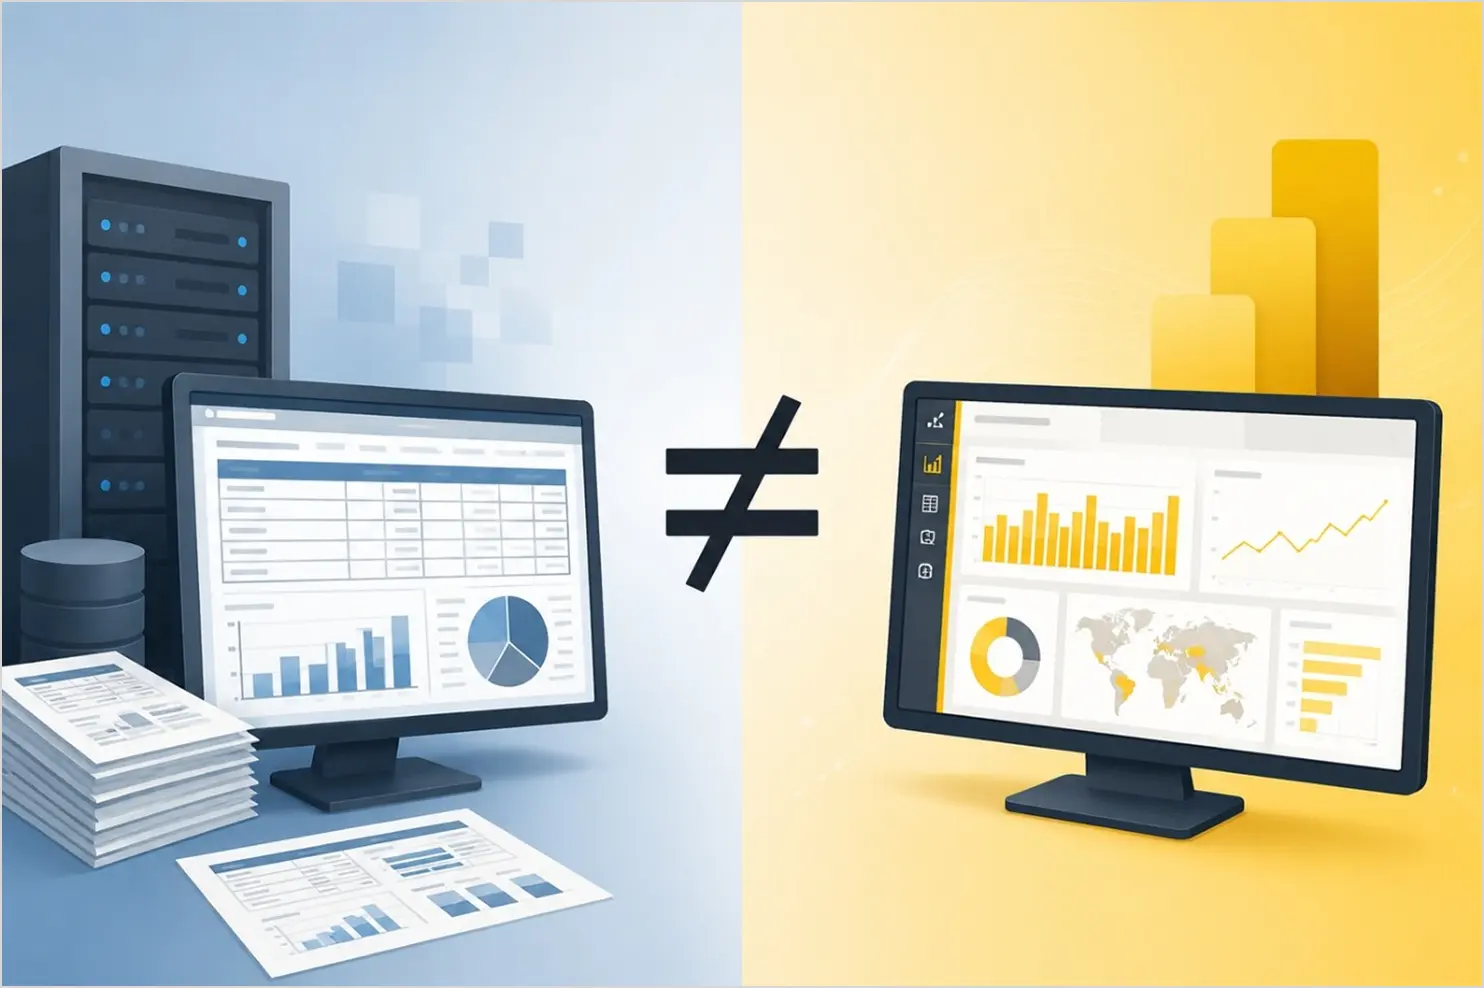
Power BI and SSRS were never built to solve the same problem. One is designed for interactive analytics, real-time dashboards, and self-service BI. The other excels at pixel-perfect operational reporting, scheduled report delivery, and highly formatted enterprise documents.
Choosing the wrong tool doesn’t just affect the quality of your reports; it impacts scalability, licensing costs, performance, governance, and how teams consume data across your business. In this guide, we’ll break down the real differences between Power BI and SSRS, where each fits best, and why many organizations in 2026 are re-evaluating their reporting strategy altogether.
What is Microsoft Power BI?
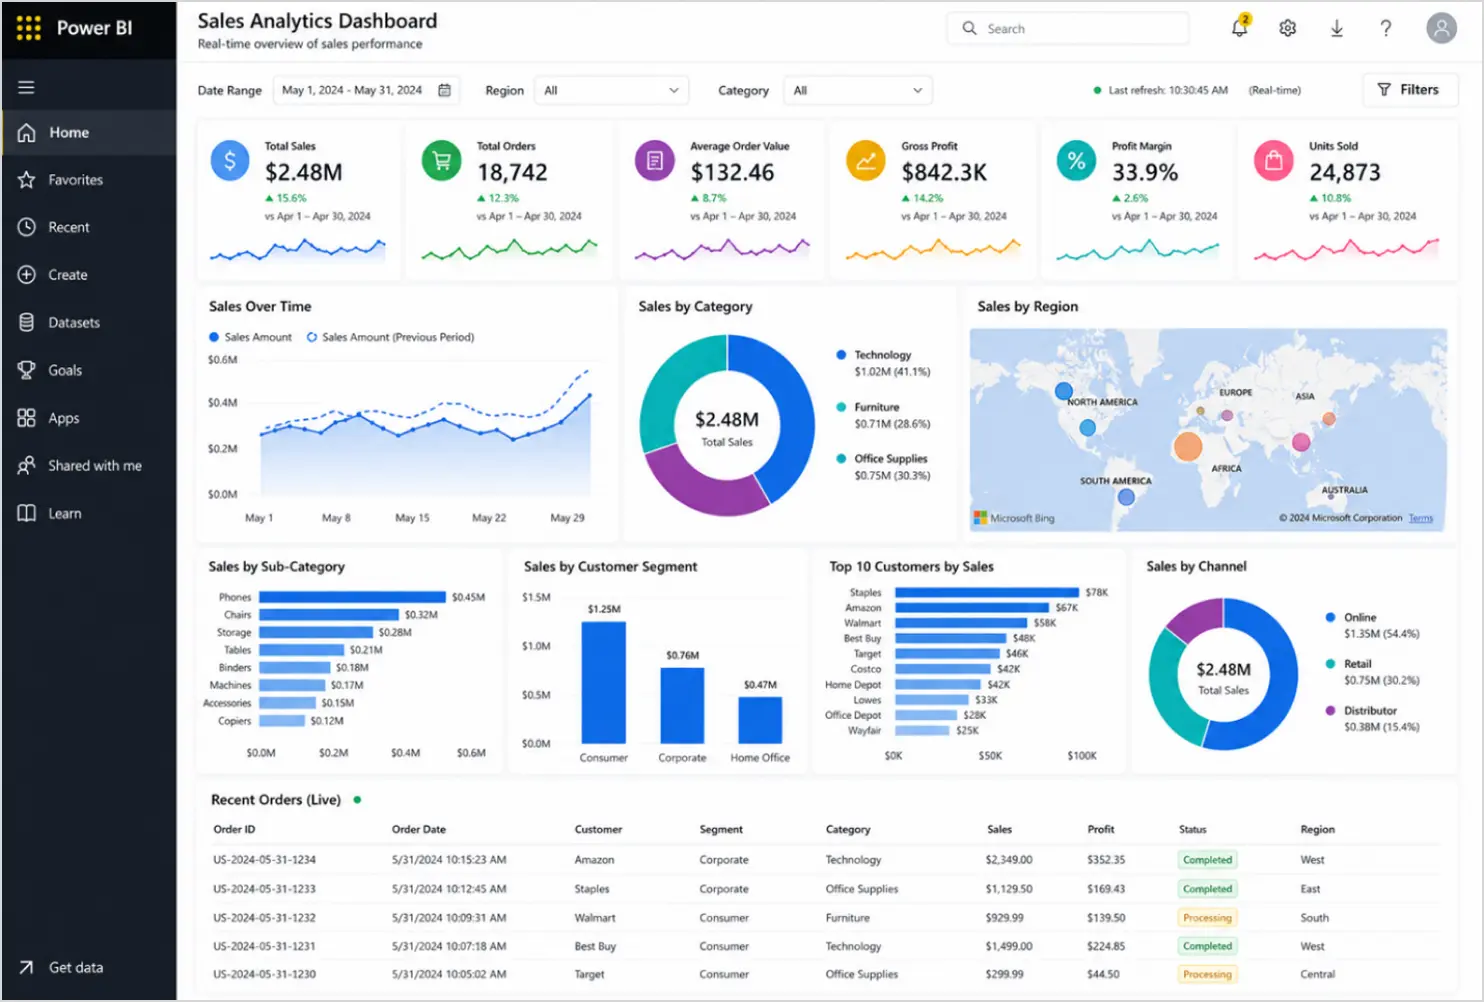
Microsoft Power BI is Microsoft’s cloud-first business intelligence platform built for interactive analytics and self-service reporting. It’s designed to help teams explore data visually through dashboards, charts, KPIs, and real-time reports without relying heavily on developers or IT teams.
Power BI became popular because it makes data analysis accessible to business users, not just analysts.
Key features of Power BI
-
- Interactive dashboards and visualizations: Power BI is built for exploration. Users can drill into metrics, filter dashboards dynamically, and uncover trends in real time.
- Self-service analytics: Business teams can create their own reports without waiting on centralized reporting teams.
- Cloud-based collaboration: Using Power BI Service, organizations can publish, share, and access reports securely from anywhere.
- AI and real-time insights: Built-in AI features like forecasting, anomaly detection, and natural language queries help users analyze data faster.
Best use cases for Power BI
Power BI works best when organizations need:
-
- Executive dashboards.
- KPI tracking.
- Sales and marketing analytics.
- Real-time operational monitoring.
- Self-service business intelligence.
- Interactive data exploration.
In short, Power BI is optimized for analytics, not highly formatted operational reporting.
What is SSRS?
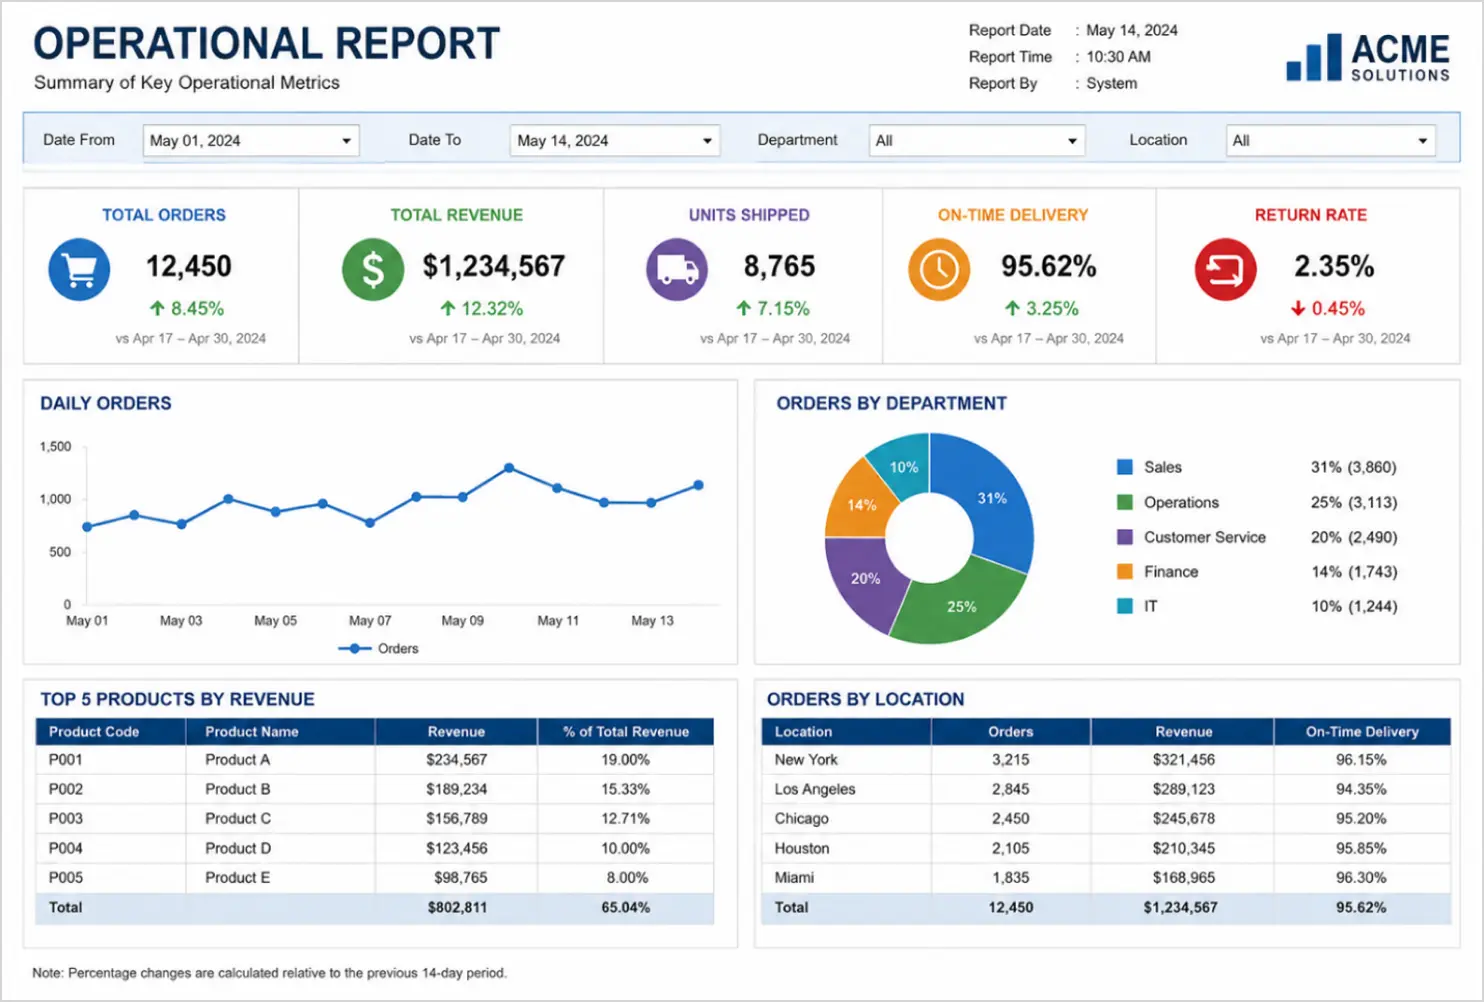
Microsoft SQL Server Reporting Services (SSRS) is Microsoft’s traditional enterprise reporting platform focused on structured, paginated, and print-ready reports. Unlike Power BI, SSRS was built for operational reporting where formatting, consistency, and scheduled delivery matter more than interactivity. Even in 2026, SSRS continues to be used by many enterprises for invoices, statements, compliance reports, and large-scale document generation.
Key features of SSRS
-
- Paginated, pixel-perfect reports: SSRS gives developers precise control over layouts, headers, tables, spacing, and pagination.
- Operational reporting: It’s widely used for finance reports, purchase orders, invoices, inventory reports, and compliance documents.
- Scheduled report delivery: Reports can be automatically generated and distributed through subscriptions and email scheduling.
- On-premises reporting environments: SSRS fits organizations that operate heavily within SQL Server and on-premises infrastructure.
Best use cases for SSRS
SSRS is best suited for:
-
- Invoice-style documents.
- Financial statements.
- Compliance reporting.
- Print-ready operational reports.
- Scheduled enterprise reporting.
- High-volume document generation.
In short, SSRS is optimized for structured reporting workflows, not interactive analytics.
Power BI vs SSRS: Key differences
| Feature | Power BI | SSRS |
| Primary purpose | Interactive BI & Analytics | Paginated Reporting |
| Deployment | Cloud-first | Primarily On premises |
| Visualization | Advanced dashboards & visualizations | Basic built-in visualizations |
| Real-time data | Supported | Limited real-time capabilities |
| Mobile experience | Optimized for mobile access | More limited compared to modern BI platforms |
| Interactivity | High | Limited interactive capabilities |
| Export & printing | Good support for export and sharing | Excellent print and export support |
| Learning curve | Moderate | More developer-oriented |
| Best for | Interactive analytics & dashboards | Structured operational reporting |
The biggest difference between Power BI and SSRS is how users consume data. Power BI focuses on interactive analytics and visual exploration. SSRS focuses on structured operational reporting and document generation. Power BI empowers business users analyze data visually, while SSRS is commonly used in IT-managed enterprise reporting environments.
Why Power BI paginated reports may not fully replace SSRS
Although Microsoft introduced Power BI Report Builder to support paginated reports inside the Power BI ecosystem, many enterprises still find it difficult to fully replace traditional SSRS environments. Power BI was fundamentally built as an analytics-focused platform, while SSRS was designed for operational and highly formatted reporting workflows. As a result, organizations may encounter considerations such as:
-
- Complex migrations from existing RDL-based report infrastructures.
- Higher licensing and capacity costs at enterprise scale.
- Embedded reporting requirements for SaaS applications.
- Different developer workflows compared to traditional SSRS environments.
- Governance and architecture complexity in large deployments.
This is one of the main reasons many businesses are still evaluating modern reporting platforms that can unify analytics, paginated reporting, and embedded experiences without forcing a complete reporting rebuild.

RDL vs PBIX: Why migration is complex
| Aspect | RDL (SSRS) | PBIX (Power BI) |
| File type | XML-based definition file | Compressed package format |
| Purpose | Paginated, pixel-perfect operational reports | Interactive dashboards & analytics |
| Contents | Layouts, parameters, expressions, data source references | Data models, visuals, queries, metadata |
| Output focus | Print-ready documents (invoices, statements, & compliance reports) | Dynamic dashboards, charts, & KPIs |
| Reusability | Primarily designed for SSRS environments | Often requires redesign or reconfiguration for Power BI environments |
| Migration challenge | RDL reports may require conversion or redesign when moving to Power BI environments | May require redesign of reports, datasets, or workflows |
Pros and cons of Power BI
Pros of Power BI
-
- Make modern visualizations with interactive dashboards, charts, maps, and KPI tracking.
- Deep integration with the Microsoft ecosystem, including Excel, Azure, SQL Server, and Dynamics 365.
- Frequent feature updates with AI capabilities, new connectors, and visualization improvements.
- Strong self-service BI capabilities that allow business teams to build reports without heavy IT dependency.
Cons of Power BI
-
- Licensing and capacity planning can become important considerations at an enterprise scale.
- Paginated reporting is supported, though some organizations may require additional customization for highly formatted operational documents.
- Governance and workspace management may require additional planning in large enterprise environments.
- Embedded analytics scenarios for SaaS applications may involve additional configuration for authentication and tenant management.
Pros and cons of SSRS
Pros of SSRS
-
- Use excellent, pixel-perfect operational reports such as invoices, financial statements, and compliance documents.
- It’s often included with existing SQL Server environments, reducing additional software costs.
- It’s reliable for enterprises running legacy Microsoft infrastructure.
- It has strong scheduling and automated report delivery capabilities.
Cons of SSRS
-
- The user experience can be outdated compared to modern BI platforms.
- You’ll have limited interactivity and dashboard-style exploration.
- It’s primarily designed for on-premises deployments rather than cloud-native environments.
- Its slower innovation cycle has limited extensibility for modern application development.
Where Power BI and SSRS struggle in 2026
Despite their strengths, organizations may encounter additional considerations as they move toward modern and scalable reporting ecosystems. Common considerations may include:
-
- Embedded analytics requirements for SaaS applications.
- API-first and developer-centric workflow expectations.
- Separation between operational reporting and interactive analytics.
- Scaling multi-tenant reporting architectures.
- Cloud deployment and governance considerations across large environments.
As reporting requirements continue to evolve, many businesses in 2026 are exploring modern reporting platforms that combine operational reporting with interactive analytics in a single solution.
Modern alternative: Why businesses are moving beyond Power BI & SSRS
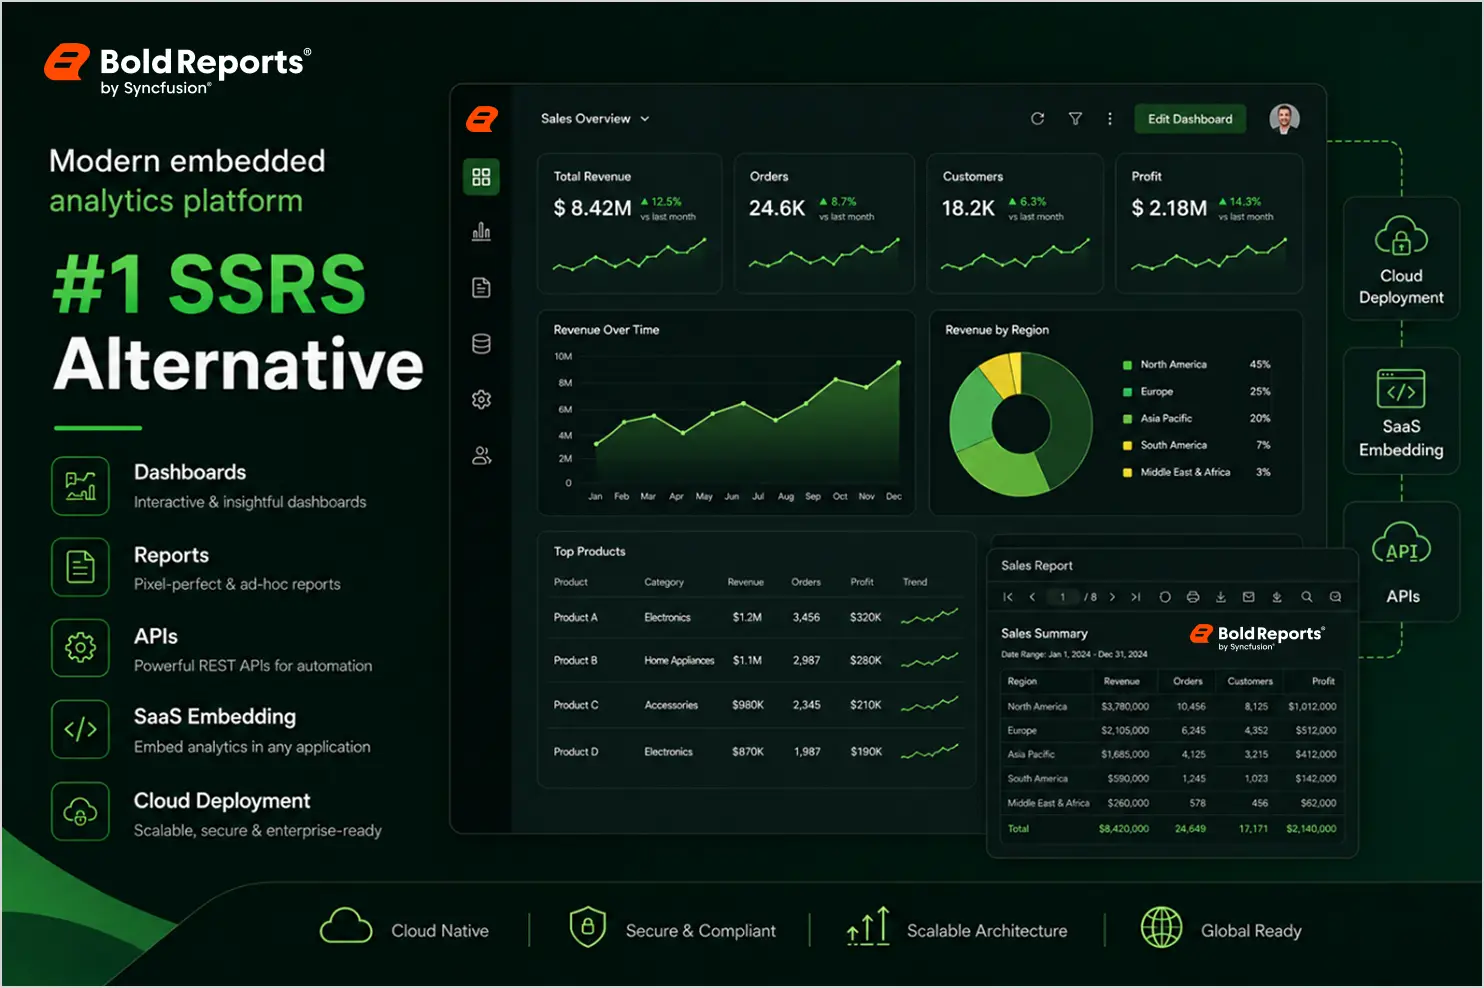
Organizations today need more than isolated dashboards or static reports. They need reporting platforms that support embedded reporting, developer customization, cloud scalability, and enterprise-grade reporting from a single environment. This shift is driving attention toward platforms like Bold Reports.
Unlike traditional reporting tools, Bold Reports is designed to help organizations combine modern analytics, embedded reporting, and enterprise reporting workflows within a single platform while helping reduce complexity across reporting environments. Many businesses want to modernize reporting without completely rebuilding their reporting ecosystem. Bold Reports helps organizations modernize reporting workflows while continuing to support enterprise reporting requirements.
Why businesses are evaluating modern reporting platforms
Many organizations seek reporting platforms that support both analytics and operational reporting within a unified reporting environment. Platforms such as Bold Reports are designed to support these evolving reporting requirements across operational, embedded, and interactive reporting scenarios.
Key advantages of Bold Reports
-
- Pixel-perfect, interactive reporting: Bold Reports supports highly formatted paginated reports while also enabling interactive reporting experiences, something many organizations struggle to balance across separate reporting systems.
- Built for embedded reporting: Embedded reporting capabilities make it easier for SaaS teams to integrate analytics directly into customer-facing applications without heavily customized reporting architectures.
- Cloud and on-premises flexibility: Organizations can deploy reports across cloud, hybrid, or on-premises environments depending on operational and compliance requirements.
- Developer-friendly SDKs and APIs: Developer-focused APIs and SDKs provide greater flexibility for report integration, customization, and automation workflows.
- More scalable pricing: Compared to Power BI’s growing licensing costs, Bold Reports can offer more predictable pricing for embedded and enterprise reporting scenarios.
Power BI vs. SSRS vs. Bold Reports
| Feature | Power BI | SSRS | Bold Reports |
| Interactive dashboards | Supported | Limited support | Supported |
| Paginated reports | Supported with Power BI Report Builder | Strong support | Strong support |
| Embedded reporting | Requires additional configuration in some scenarios | Primarily designed for traditional reporting environments | Built for embedded reporting scenarios |
| Cloud and on-premises deployment | Cloud-first with hybrid support options | Primarily on-premises deployments | Cloud, hybrid, and on-premises support |
| Developer control | Business-user focused with developer extensibility options | Developer-oriented reporting workflows | Developer-focused APIs and customization |
| Self-service analytics | Strong self-service BI capabilities | Limited self-service analytics capabilities | Interactive and self-service reporting support |
| Pixel-perfect reporting | Supported for paginated reporting scenarios | Strong operational reporting support | Strong paginated and operational reporting support |
| SaaS application integration | May require additional setup for embedded SaaS scenarios | More commonly used in internal enterprise reporting environments | Designed for embedded SaaS reporting scenarios |
| API & SDK Support | Moderate developer tooling support | Traditional reporting APIs and extensions | Strong API and SDK support |
Conclusion
At the end of the day, the discussion is not simply about choosing between Power BI and SSRS. It is about whether an organization’s reporting strategy aligns with evolving business, analytics, and operational reporting requirements.
Power BI helps teams explore and analyze data through interactive dashboards and analytics experiences. SSRS continues to support highly formatted and operational reporting workflows used across many enterprises.
As reporting ecosystems evolve in 2026, many organizations are looking for ways to reduce reporting complexity, support scalability, and unify analytics, operational reporting, and embedded reporting experiences within a more connected environment.
Platforms such as Bold Reports® are designed to support these modern reporting requirements while providing flexibility for cloud, embedded, and enterprise reporting scenarios.
Organizations evaluating the next phase of their reporting strategy are increasingly assessing whether their reporting architecture can support long-term scalability, developer flexibility, and evolving business reporting needs. Ready to modernize your reporting strategy in 2026? Start a free trial of Bold Reports or explore the pricing plans to find the best fit for your organization and see enterprise reporting in action.
Frequently asked questions
- 1.
Can Power BI fully replace SSRS?
For some organizations, Power BI can support both analytics and paginated reporting requirements. However, many enterprises continue using SSRS for operational reporting, highly formatted documents, and existing RDL-based reporting environments.
- 2.
Why do enterprises still use SSRS in 2026?
Because operational reporting never disappeared.
Finance, healthcare, logistics, and manufacturing teams still depend on scheduled, print-ready reports.
- 3.
Why is migrating from SSRS to Power BI difficult?
Migrating from SSRS to Power BI may involve more than file conversion alone. RDL and PBIX were designed for different reporting and analytics workflows, which can require redesigning reports, datasets, or reporting architectures depending on organizational requirements.
- 4.
Is Power BI expensive for large organizations?
At scale, it may be. Licensing and capacity planning can become important considerations for large-scale deployments, particularly when embedded analytics, Premium capacity, or external user access requirements are involved.
- 5.
Why do SaaS companies struggle with Power BI Embedded?
While Power BI Embedded supports embedded analytics scenarios, some SaaS organizations also evaluate factors such as multi-tenant architecture, licensing models, customization requirements, and deployment flexibility when selecting embedded reporting platforms.






