 8 min read
Create a Chart Report Using Bold Reports Designer
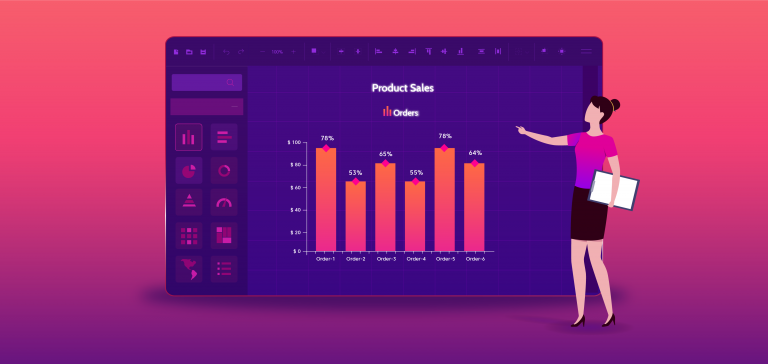
To transform numbers, figures, and measurements into visual information and present it in a meaningful way, RDL standard reporting provides a chart data region. A chart conveys a lot of information in little space and represents data graphically for better understanding. We can observe data trends and patterns quickly and precisely. In this blog post, we […]