Resolved the unhandled exception that occurred when running the report with the background page creation option in the MVC platform.
Provided support for en-NZ localization in the report viewer.
Version 10.1.21
Weekly release
3Improvements
Improvements
Report Viewer
Improved the page break functionality in the main report when configured in the sub report’s table.
Provided an API to utilize the cross-axis tooltip in the charts.
Fixed the horizontal scroller issue while opening and closing the parameter panel in Report viewer.
Version 10.1.20
Weekly release
3Improvements
Improvements
Report Viewer
Resolved the report viewer crash issue when setting the viewer id with integer instead of string (eg. id=”3viewer” instead of id=”viewer”).
Resolved the image rendering issue during PPT export on Linux.
Provided support for toggling the visibility of tablix group items using a textbox located outside the tablix region.
Version 10.1.19
Weekly release
3Improvements
Improvements
Report Viewer
Disabled the toolbar actions when the print action is triggered in classic toolbar mode.
Fixed the issue with reordering parameter values through custom properties.
Resolved the issue where the dynamic width expression of chart items without any scope was not being properly calculated when placed in a table cell.
Version 10.1.18
Weekly release
2Improvements
Improvements
Report Viewer
Resolved the issue where the print icon was not hidden when using the API to enable the on-demand feature.
Provided support to exclude blank page rendering in PPT export using a custom property.
Version 10.1.17
Weekly release
7Improvements
Improvements
Report Viewer
Provided support to customize the color palette for charts using the custom style feature.
Introduced a custom property for changing the Tablix toggle icon color.
Provided the custom property for adjusting the chart legend shape width.
Resolved the date-time value issue occurring while embedding reports from ej1 viewer to the ej2 viewer.
Fixed the issue where the tooltip in the parameter was not hiding properly.
Resolved the chart serialization issue related to the log scale property.
Improved the layout of Word documents when using the ‘AtLeast’ rowheighttype property.
Version 10.1.16
Weekly release
5Improvements
Improvements
Report Designer
Added support for Amazon Redshift Spectrum data source.
Report Viewer
Improved toolbar icon visibility in the preview when error messages are displayed.
Enhanced license error messages with correct URLs for invalid or missing license tokens.
Resolved the accessibility issue in the viewer component.
Resolved the issue with the background image repeat property for the tablix textbox item.
Version 10.1.15
Weekly release
7Improvements
Improvements
Report Designer
Fixed the issue where chart series colors reset to black when toggling series visibility.
Report Viewer
Fixed the issue of rendering the report when there is no style tag for text runs.
Resolved the overlapping issue in the preview when the chart has both round borders and a background color.
Resolved the disabling of the toolbar actions in classic mode when there are handled exceptions in the report.
Resolved chart items not rendering in export when one of the charts has an empty dataset.
Report Writer now shows currency in the correct format based on the provided language settings.
Resolved the page number mismatch in the table of contents page in PDF export.
Version 10.1.14
Weekly release
1Improvements
Improvements
Report Viewer
Resolved an issue where the image model was not rendering when placed in a table cell with merged columns with the disablepagesplitting and virtualization properties.
Version 10.1.13
Weekly release
6Improvements
Improvements
Report Viewer
Resolved the gauge report item position in the export within the report viewer.
Resolved the indicator size issue in the export within the report viewer.
Provided custom property support for corner radius in column and bar charts.
Resolved the border issue on the table of contents page in PDF exports when opened in Adobe Reader.
Fixed the issue in Excel export where the drill-down table does not show data when “ExcelToggleLayout” is enabled.
Resolved an issue where the fetch limit property was not applied to the subreport model in the report viewer.
Version 10.1.12
Weekly release
8Improvements
Improvements
Report Designer
Fixed the issue with NuGet package installation failure caused by changes related to x64 bit architecture.
Report Viewer
Resolved the extra page issue rendering when the body width and report width were the same with a 0 margin.
Resolved the console issue that occurred while navigating between pages.
Resolved the warning message regarding the limit on records while using the classic UI.
Fixed the issue in HTML export when the Markup Type is set to Plain Text.
Fixed an issue where GIF images were not exporting as static images in PDF format within the Linux environment.
Hidden parent group columns are now excluded from CSV exports.
Resolved the issue where sub report items were not functioning correctly within merged cell tables.
Version 10.1.11
Main release
17New features
13Improvements
9Bug fixed
What’s New
Report Server
Reverse Proxy Configuration Support
Bold Reports Server can now sit behind a reverse proxy such as Nginx or IIS ARR without breaking authentication, redirects, or asset paths. This gives IT teams more flexibility in how they expose the server on internal networks, letting them terminate SSL, apply access rules, and load-balance traffic at the proxy layer instead of on the report server itself.
Web API Data Source Management API
New API methods let integrators add and update Web API data sources programmatically, without going through the Bold Reports UI. This is useful for teams that provision data sources as part of an automated deployment pipeline, or that need to rotate API endpoints and credentials across many tenants without manual UI steps.
Report Parameters Retrieval API
A new API retrieves a report’s parameters, including their names, data types, default values, and valid value lists. This is useful for building custom parameter UIs in embedded scenarios, where an application wants to present its own parameter form rather than relying on the standard Bold Reports viewer panel.
Deployment Reports Support
Reports created in the master site and added to the deployment grid can now be published to all other site deployments in a single action. This removes the need to recreate or manually copy the same report across every tenant site in a multi-site deployment, which previously meant repeating the upload and configuration steps once per site.
Move Reports Between Categories API
Reports can now be moved between categories through the API, simplifying bulk reorganization of report libraries. Administrators managing large report catalogs can script category changes across many reports at once instead of dragging and dropping items one at a time in the UI.
Report and Dataset Version History API
Version history for a report or dataset can now be retrieved through the API, so past revisions can be reviewed or restored programmatically. This gives applications built on top of Bold Reports a way to surface change history or build their own rollback tooling, rather than relying on the version history view built into the designer.
Report Designer
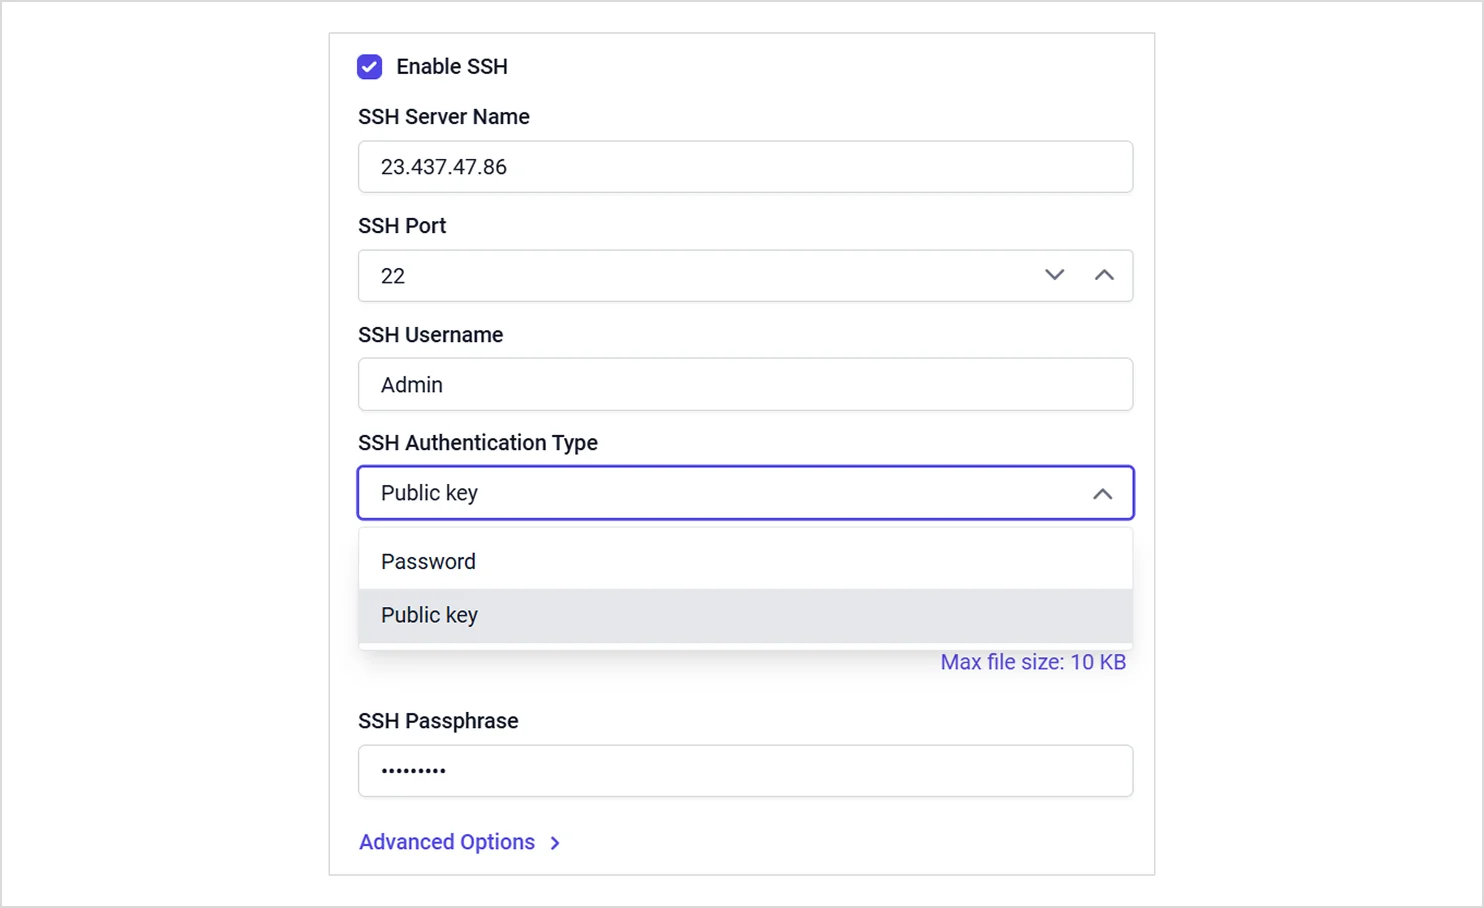
SSH Tunnel Authentication Modes
Added password and public key authentication modes in SSH tunnel configuration, giving teams more than one way to secure a tunneled database connection depending on their infrastructure’s requirements, instead of being limited to a single authentication approach.
Provided Multi TextRun support for Tablix cells in the Tablix report item, allowing multiple independently formatted text runs, each with its own font, color, or style, to sit within a single cell instead of one uniform block of text.
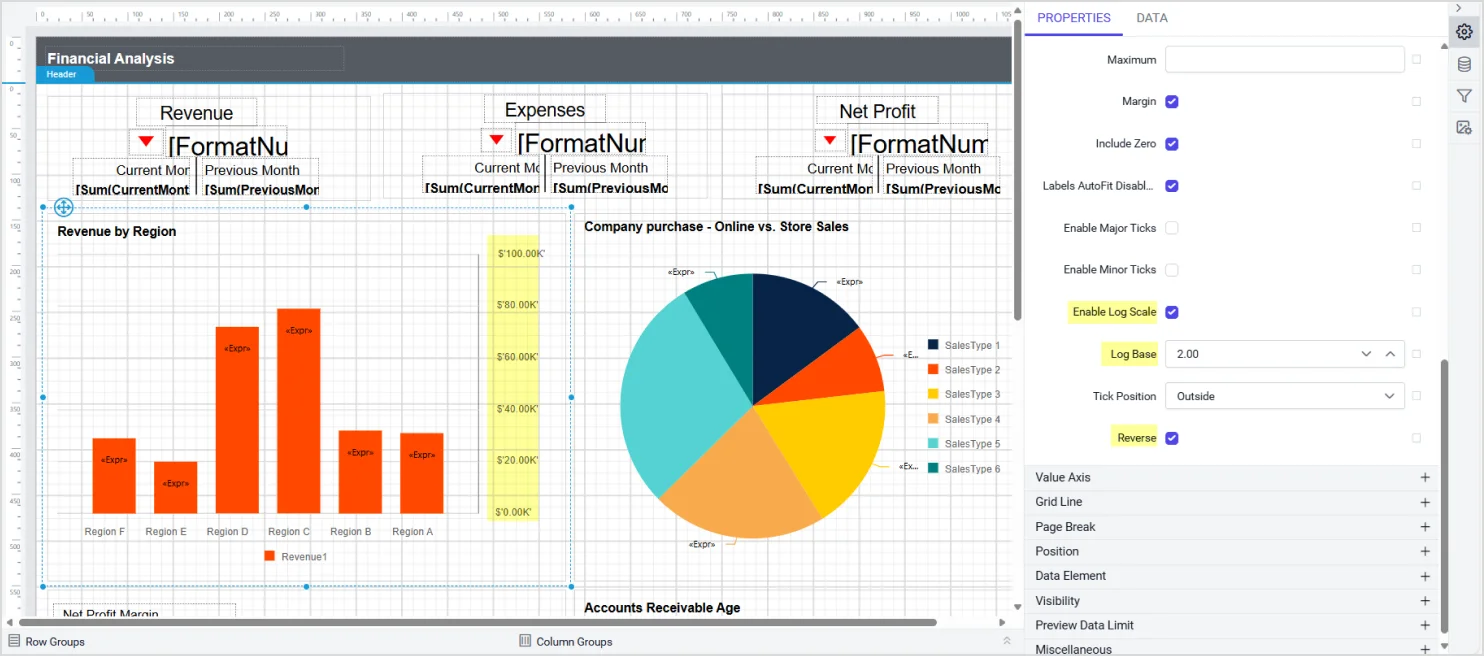
Reverse, Logarithmic, and Log Base Chart Axis Options
Provided support to configure reverse, logarithmic scale, and log base options in the chart axis properties, giving finer control over how a chart’s value axis is scaled and oriented, useful for data that spans several orders of magnitude or needs to read in a reversed direction.
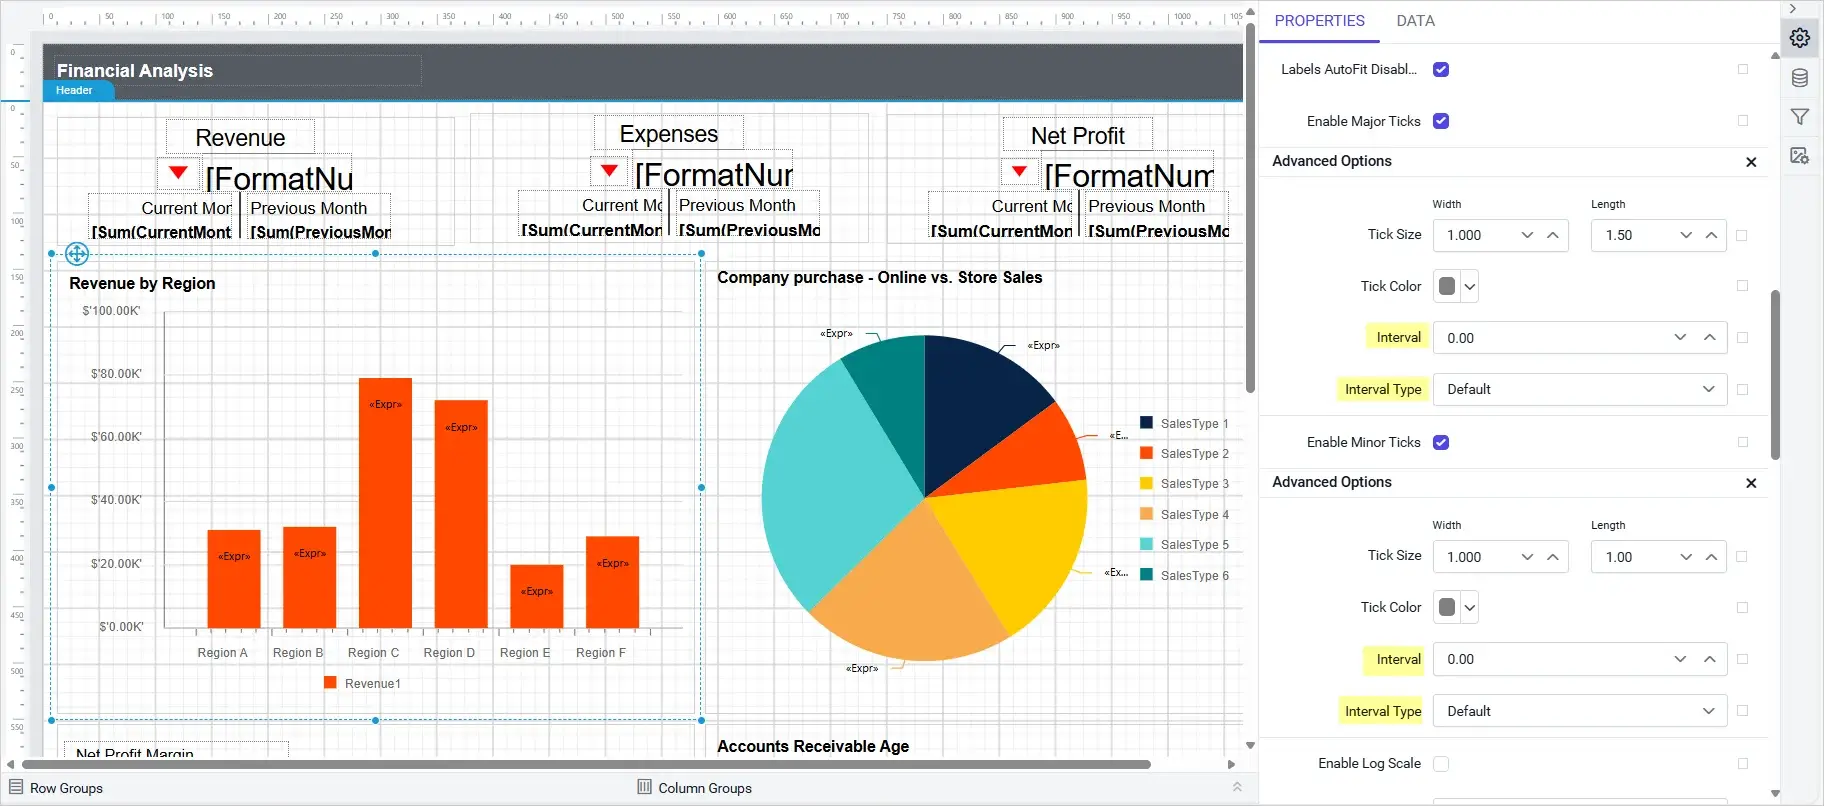
Provided support to specify interval values for both major and minor tick marks in the chart axis properties, allowing gridline density to be tuned independently for primary and secondary tick marks so a chart can show finer or coarser reference lines as needed.
A new on-demand report processing beta engine initially loads the top 1,000 records and fetches more data as users navigate, reducing load time and maintaining low memory usage.
Added custom report items for easy integration of PDF files and HTML content into reports, so external documents and web content can sit directly inside a report layout without converting or embedding that content separately first.
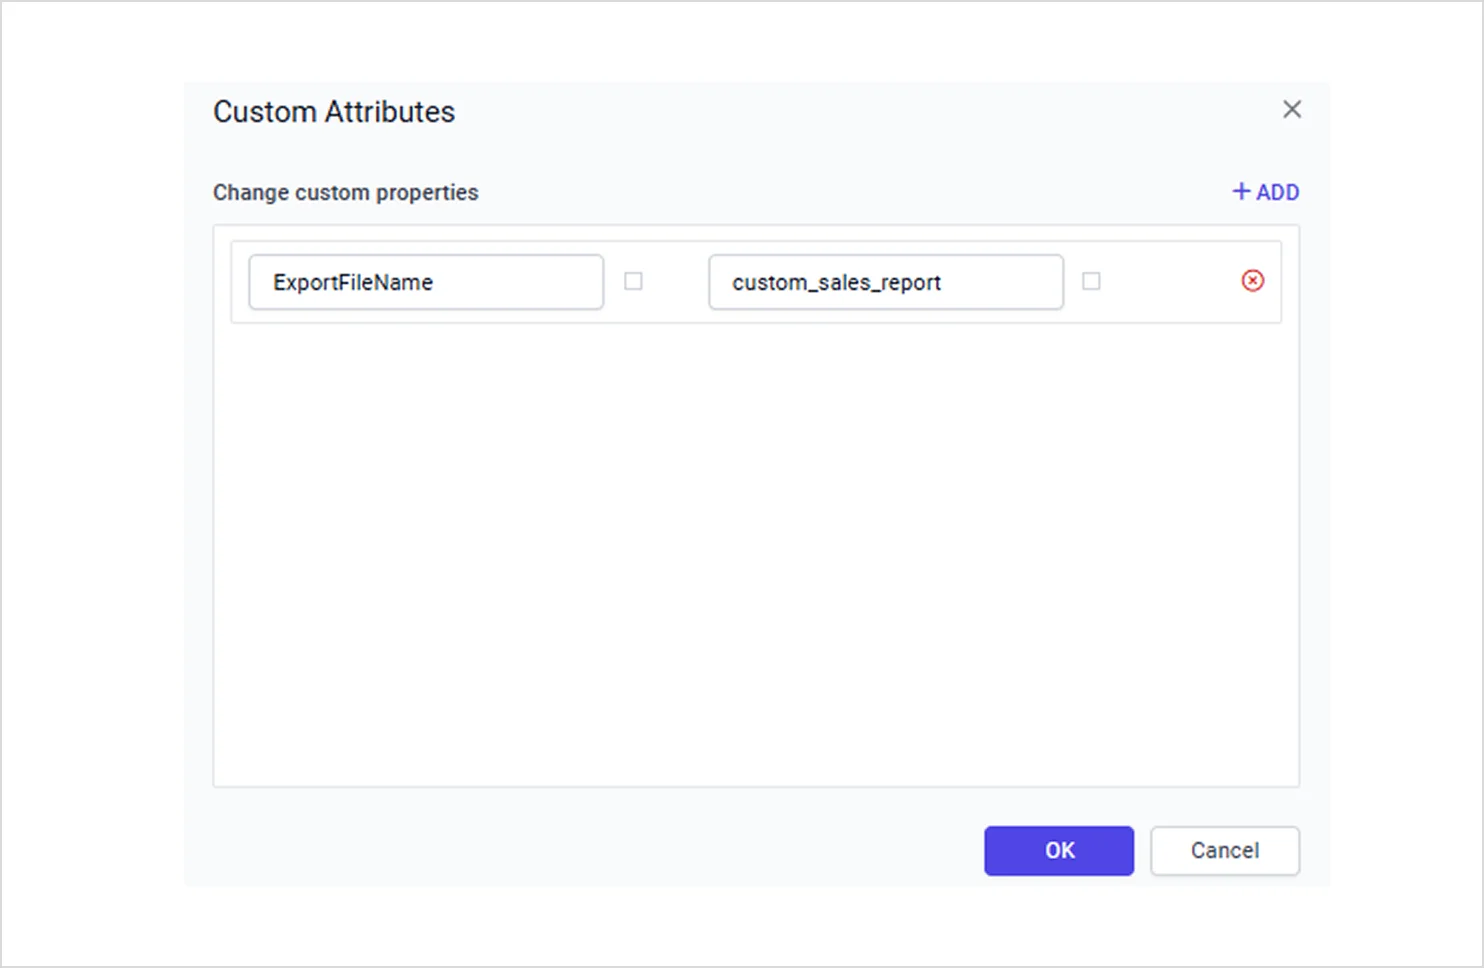
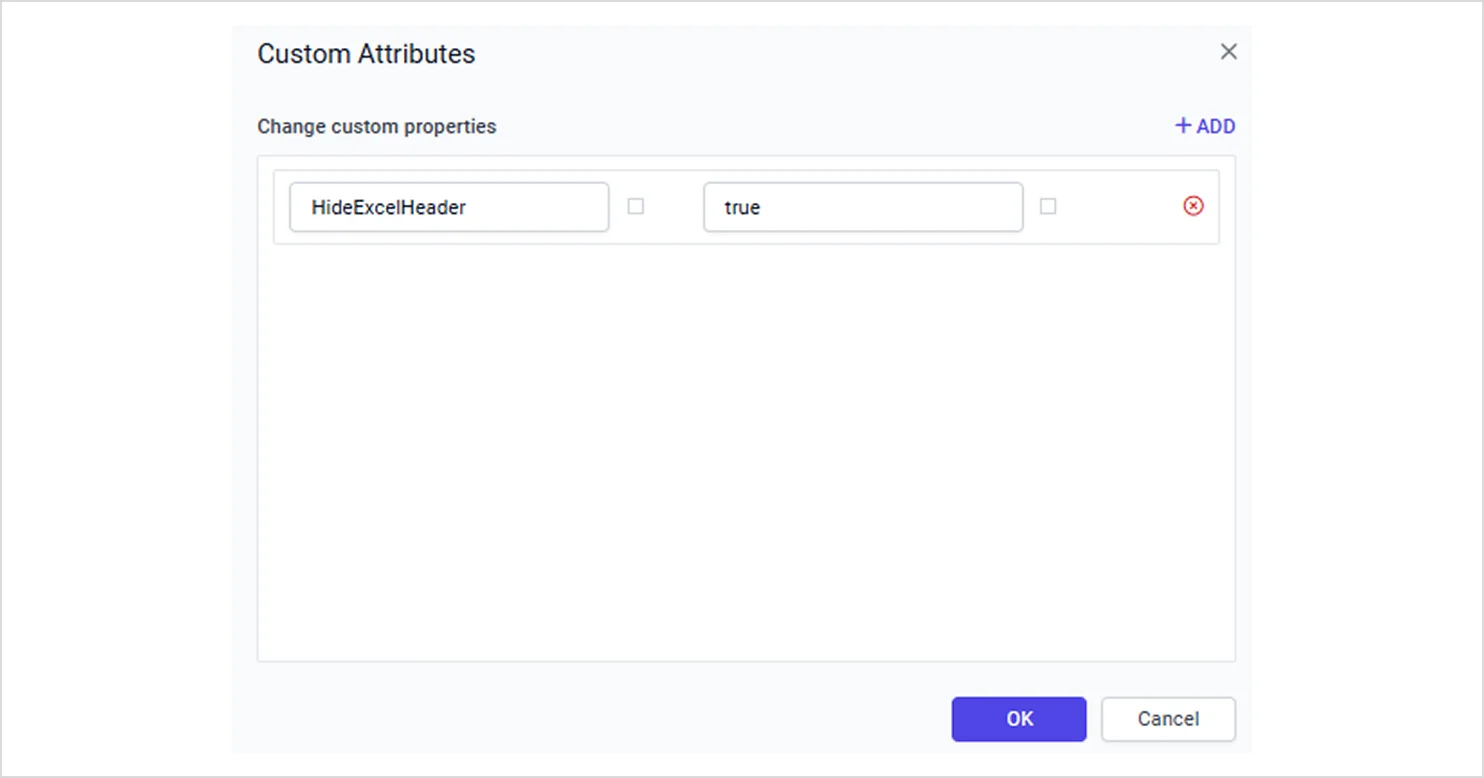
Added a new ExportFileName custom property in report settings for exporting reports with a user-defined file name, and provided the HideExcelHeader custom property, enabling exclusion of the report header when exporting to Excel documents.
IDP
Amazon S3 and Oracle File Storage Support
Added support for Amazon S3 as a storage provider for application data files, enabling secure, scalable, and durable storage of app-generated content, and added support for Oracle file storage covering dashboards, data sources, configuration files, and assets.
Reverse Proxy Setting Across Bold Reports Services
Added a new setting for reverse proxy support across Bold Reports services, so when enabled, the platform uses internal service URLs to streamline internal communications and simplify proxy-based deployments.
Improvements
Report Server
Clearer Sample Report Thumbnails
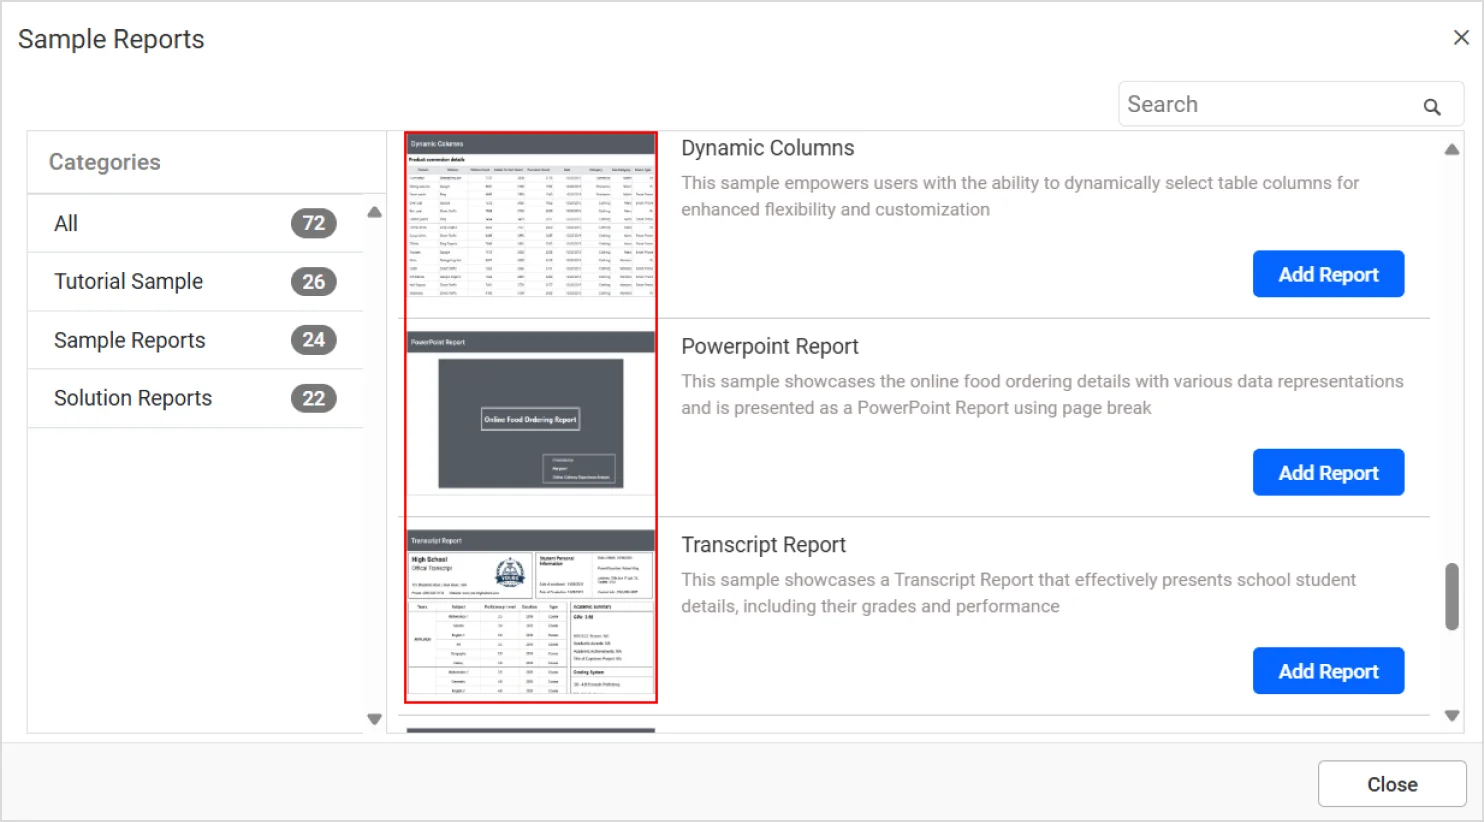
Added new sample reports and enhanced all thumbnails for clearer visual identification.
Sample reports are easier to tell apart at a glance when browsing the report gallery.
Relocated Menu Bar Sections
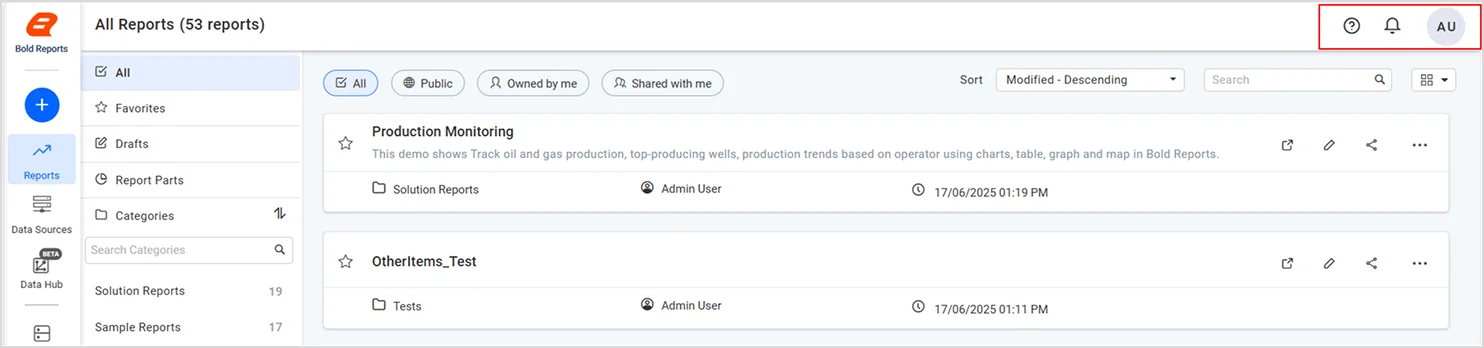
Relocated the help, notifications, and user profile sections to the top-right corner of the menu bar for quicker access.
This groups the most frequently used account-level controls in one consistent location.
Consolidated API Version
Consolidated all APIs into a single version for consistent and simplified usage.
Integrators no longer need to track multiple API versions with differing behavior.
Report Designer
Faster Dataset Saving for Large SQL Server Tables
Improved the efficiency of dataset saving for the SQL Server data connector with large tables, so datasets built on large tables now save noticeably faster instead of stalling the designer during the save operation.
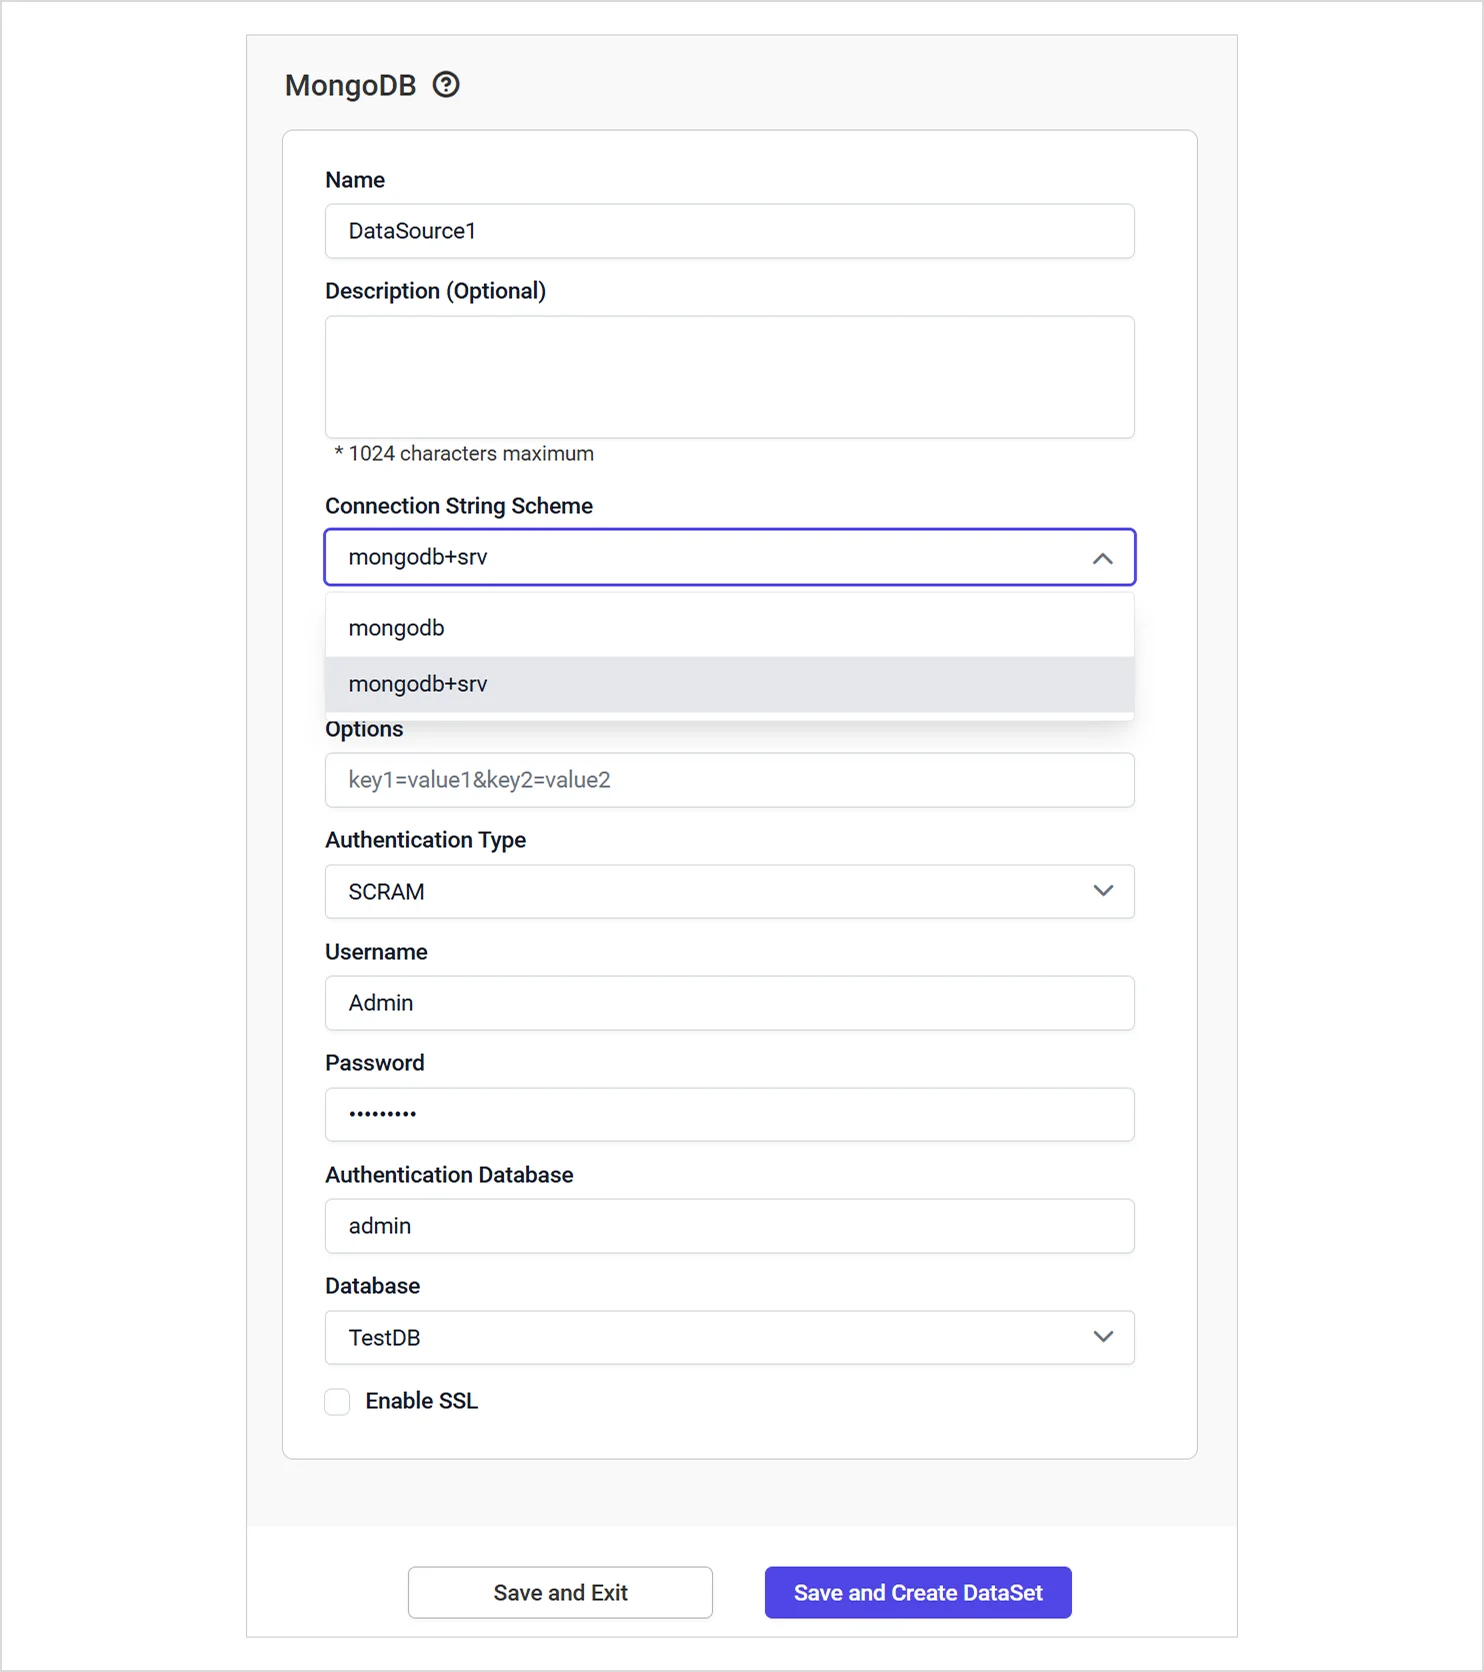
MongoDB Standard and SRV Connection Strings
Improved the MongoDB data connector to handle both standard and SRV connection string formats, covering MongoDB Atlas and other SRV-based deployments alongside traditional standard connection strings without requiring a manual workaround.