Resolved the Me.Value issue when a textbox value is provided as a string.
Resolved the Me.Value issue when a textbox value is provided as an expression containing a single quote (‘).
Improved the smart label feature for stacked bar charts and resolved the missing data label issue when LabelIntersectAction is set to Horizontal.
Added support for updating the custom default font in the controller.
Resolved an issue where the EnableComplexScript custom property was not applied correctly in the viewer.
Fixed backend processing for the client-side CSV Eliminate Header setting.
Added FillEmptySpace support for table items during PDF export.
Version 14.1.21
Weekly release
1Improvements
Improvements
Report Viewer
Fixed the count expression issue in the Tablix with nested column grouping.
Version 14.1.20
Weekly release
2Improvements
Improvements
Report Viewer
Added localization support for charts based on the Report Language.
Implemented JValue token handling in the Web API data provider.
Version 14.1.19
Weekly release
1Improvements
Improvements
Report Viewer
Resolved an issue with string operator precedence in the Report Viewer.
Version 14.1.18
Weekly release
14Bug fixed
Bug Fixes
Report Designer
Fixed an issue where the Tablix context menu would close when opened near the edge of the viewport.
Fixed an issue in On-Premises where previously opened reports in the Designer displayed an Unauthorized error after users re-authenticated through the UMS page.
Fixed an issue in On-Premises where shared datasets could not be created when the associated shared data source name contained an underscore (_) character.
Report Server
Fixed an issue with email template customization when creating or editing schedules in the user interface.
Fixed an issue with report publishing containing timestamps to internal and external sites.
Fixed a site duplication issue that appeared in the publish dialog.
Fixed a publish dialog spinning issue when publishing reports created by another user to internal and external sites.
Fixed an issue where the export type was not saved correctly when creating schedules through the API.
Fixed an issue where report parameter decimal values were displayed with excessive precision on the Schedule page.
Fixed an issue where multi-value parameters displayed only a single value.
Fixed an issue where query-based default parameter values were not applied to schedules.
Report Viewer
Fixed the issue of an extra blank row appearing in Excel exports.
Addressed a vulnerability caused by the SSH.NET package.
Resolved the “Index was out of range” exception that occurred during print-mode export with visualization items.
Version 14.1.17
Weekly release
2Improvements
Improvements
Report Viewer
Fixed the stripline rendering issue when StripWidthType is set to Number.
Resolved the page break issue when a disabled expression is set for detail rows.
Version 14.1.16
Weekly release
9Improvements
Improvements
Report Viewer
Fixed an issue where the Tablix context menu would close when opened near the edge of the viewport.
Resolved the issue where the StackedColumn100 chart showed incorrect data labels and tooltips.
Resolved the issue where parameters were disabled after entering invalid values.
Resolved a punctuation error in the parameter error messages.
Improved the performance of the CountDistinct functionality.
Fixed object null reference exception with dateformat values in CSV export.
Fixed the issue where the value axis label format was not applied properly unless set as an expression.
Improved the smart label feature to support labelIntersectAction as horizontal and vertical.
Resolved the object reference issue while placing an SVG image in the header and footer.
Version 14.1.15
Weekly release
8Improvements
Improvements
Report Viewer
Provided a custom position option for the chart title.
Improved the InStr() function to accept optional parameters in the expression.
Added support for the DateOnly object in raw data export.
Resolved the SVG image not rendering in export when height and width attributes are not set.
Resolved the console error when the HideDropdownSelectAll property is configured.
Resolved the page layout miscalculation when container report items contain dynamic hidden items.
Fixed the max value not updating when the chart contains label format and max value.
Resolved the blank cell issue in Excel export when IgnoreCellMerge is enabled.
Version 14.1.14
Weekly release
1Improvements
Improvements
Report Viewer
Resolved an issue with the NOT operator when used between expressions.
Version 14.1.13
Weekly release
3Improvements
Improvements
Report Viewer
Improved French localization content in the Report Viewer.
Fixed the chart axis maximum and minimum date issue in the Report Viewer.
Fixed an expression parsing error when the Lookup function was used within the IsNothing function.
Version 14.1.12
Main release
22New features
31Improvements
30Bug fixed
2Known issue
What’s New
Report Designer
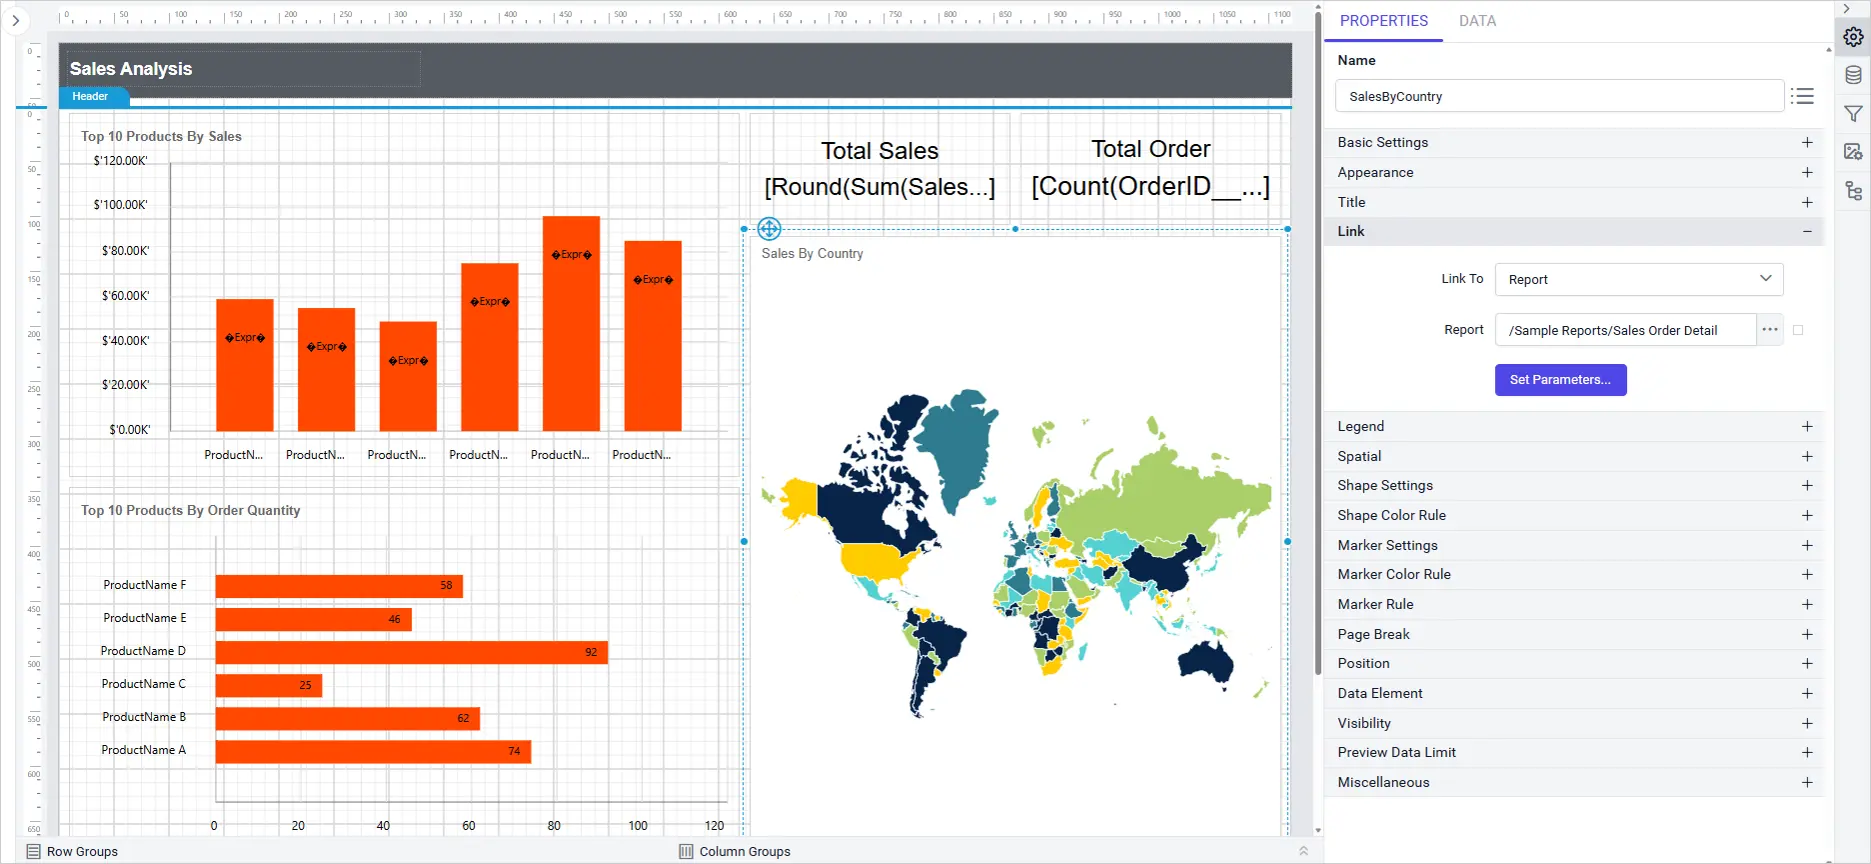
Map Report Item Link Property
Link Property support introduces interactive navigation for map report item, enabling users to add clickable actions such as URLs, reports, and bookmarks directly from the property panel. This enhancement streamlines report interactivity and user experience.
Key Benefits
Flexible navigation: Easily link map item to external URLs, other reports, and specific bookmarks.
Intuitive configuration: All link options are accessible and configurable from a single dropdown in the property panel.
Smart feedback: Bookmark dropdown displays available bookmarks or “Data not found” when none exist.
Enhanced interactivity: Clicking a map item in report preview navigates to the configured destination.
StripLines support introduces advanced visual customization charts, allowing you to highlight specific ranges or values directly on both category and value axes. This enhancement improves data interpretation and presentation within your reports.
Key Benefits
Enhanced data clarity: Users can easily emphasize important ranges or thresholds on charts.
Improved customization: Flexible configuration options for both primary and secondary axis.
Intuitive interaction: Add, edit, show/hide, and delete striplines directly from the chart axis properties panel for a seamless design experience.
Consistent experience: StripLines settings are saved with the report and work across all supported themes and cultures.
Report Parts, the shared, reusable components embedded across multiple reports, now maintain a full version history.
When a shared component is updated, administrators can compare revisions and restore an earlier version if the change causes unintended effects across the reports that depend on it.
Administrators can create custom email templates and assign them to specific notification categories, such as scheduled export delivery or access request confirmations.
Each template’s subject line, body content, tone, and visual design can be tailored so every email Bold Reports sends reflects the organization’s brand and communication standards.
Scheduled exports delivered to Amazon S3 can now apply AWS KMS encryption at the destination, configured directly in the export settings.
Regulated industries like healthcare, finance, and government can meet at-rest encryption requirements without post-export scripts or third-party encryption tools.
Administrators can now set a specific, fixed password for exported files in scheduled jobs, in addition to the existing dynamic password options.
This is especially useful for exports going to external recipients or compliance archives, where a predictable password needs to be communicated through a separate channel.
Report Security policies can now restrict access to specific reports based on configured IP addresses and domains, blocking any access attempt from outside those boundaries.
This adds a granular, report-level access layer for sensitive financial, HR, or proprietary data that should stay within the corporate network or trusted partner domains.
Select PDF, Excel, Word, and CSV simultaneously from the report explorer’s context menu, or configure a scheduled job to deliver every format in one run.
This removes the need for separate scheduled jobs or manual re-exports when different stakeholders require different file formats.
New APIs let administrators copy multiple reports to multiple external tenants in a single call, replacing the previous one-by-one approach.
ISV and SaaS platforms managing large tenant portfolios can now push report updates programmatically, keeping every tenant consistent with far less manual effort.
New APIs expose schedule run data, including successful deliveries, failures, last and next run time, and delivery location, retrievable by Schedule ID.
Operations teams can pull this data into existing monitoring dashboards and alerting systems without logging into the Report Server UI.
Report Server now supports OpenTelemetry instrumentation for its backend workflow, complementing existing Log4Net logging and optional Sentry integration.
Teams standardized on Datadog, Grafana, Jaeger, or Azure Monitor can fold Bold Reports into their existing tracing pipeline and correlate its traces with the rest of their cloud-native architecture.
OCI Object Storage and Azure x64 Support
Report Server can now use Oracle Cloud Infrastructure Object Storage as a storage backend with native OCI credentials, and adds x64 architecture support for Azure deployments.
Organizations running on Oracle Cloud can store report files and exports directly in OCI rather than relying on third-party storage adapters.
Default Group Auto-Assignment for Authenticated Users
Users authenticating via Windows AD, OpenID, or OAuth can now be automatically added to a designated Default Group on first sign-in.
This removes a manual onboarding step and ensures every new user immediately inherits the correct base-level permissions in large-scale deployments.
Report Viewer
List Styles in PDF and PPT Exports
Provided support for exporting bulleted and numbered list styles in text boxes to PDF and PowerPoint formats. Exported documents now keep the same bullets, numbering and indentation shown in the Report Viewer.
Constant Evaluation Mode in Report Viewer
Previously, any expression added to a text box was always evaluated in the report and its result displayed. Now, setting EvaluationMode=”Constant” on a text box value skips evaluation and shows the raw expression as plain text in the Report Viewer.
Display ReportID Using a Global Expression
Provided support for the Globals!ReportID global expression in the Report Viewer, which you can use in any report expression. Use it to display, reference or build logic around the report’s unique identifier, which makes reports easier to identify and track.
Bold Data Hub
Presto and Trino Data Sources in Bold Data Hub
Bold Data Hub now connects natively to Presto and Trino, the distributed SQL engines that power query layers across object storage, Hive, Iceberg, Delta Lake, and other data-lake formats.
Teams running analytics on these engines can bring that data into Bold Reports directly, without building custom connectors or intermediate ETL steps.
IDP
Email Settings Inheritance from UMS to Tenant Sites
Email configuration set at the UMS level now automatically inherits down to every tenant site, so administrators no longer need to configure email settings on each site individually after deployment.
This keeps notification delivery consistent across the entire tenant portfolio and removes a recurring source of misconfiguration.
Login Activity Audit Logs
A new Login Activity tab in Audit Logs gives administrators a searchable, time-stamped record of user login events with IP address details.
Security and compliance teams can pull this information directly from the Bold Reports admin interface for reviews, incident response, and audits, without aggregating logs from external systems.
Improvements
Report Designer
Enhanced Tablix Wizard Field Picker
The Tablix Wizard field picker now supports search, multi-selection, and a one-click reset, making it faster to build tables and matrices from wide datasets.
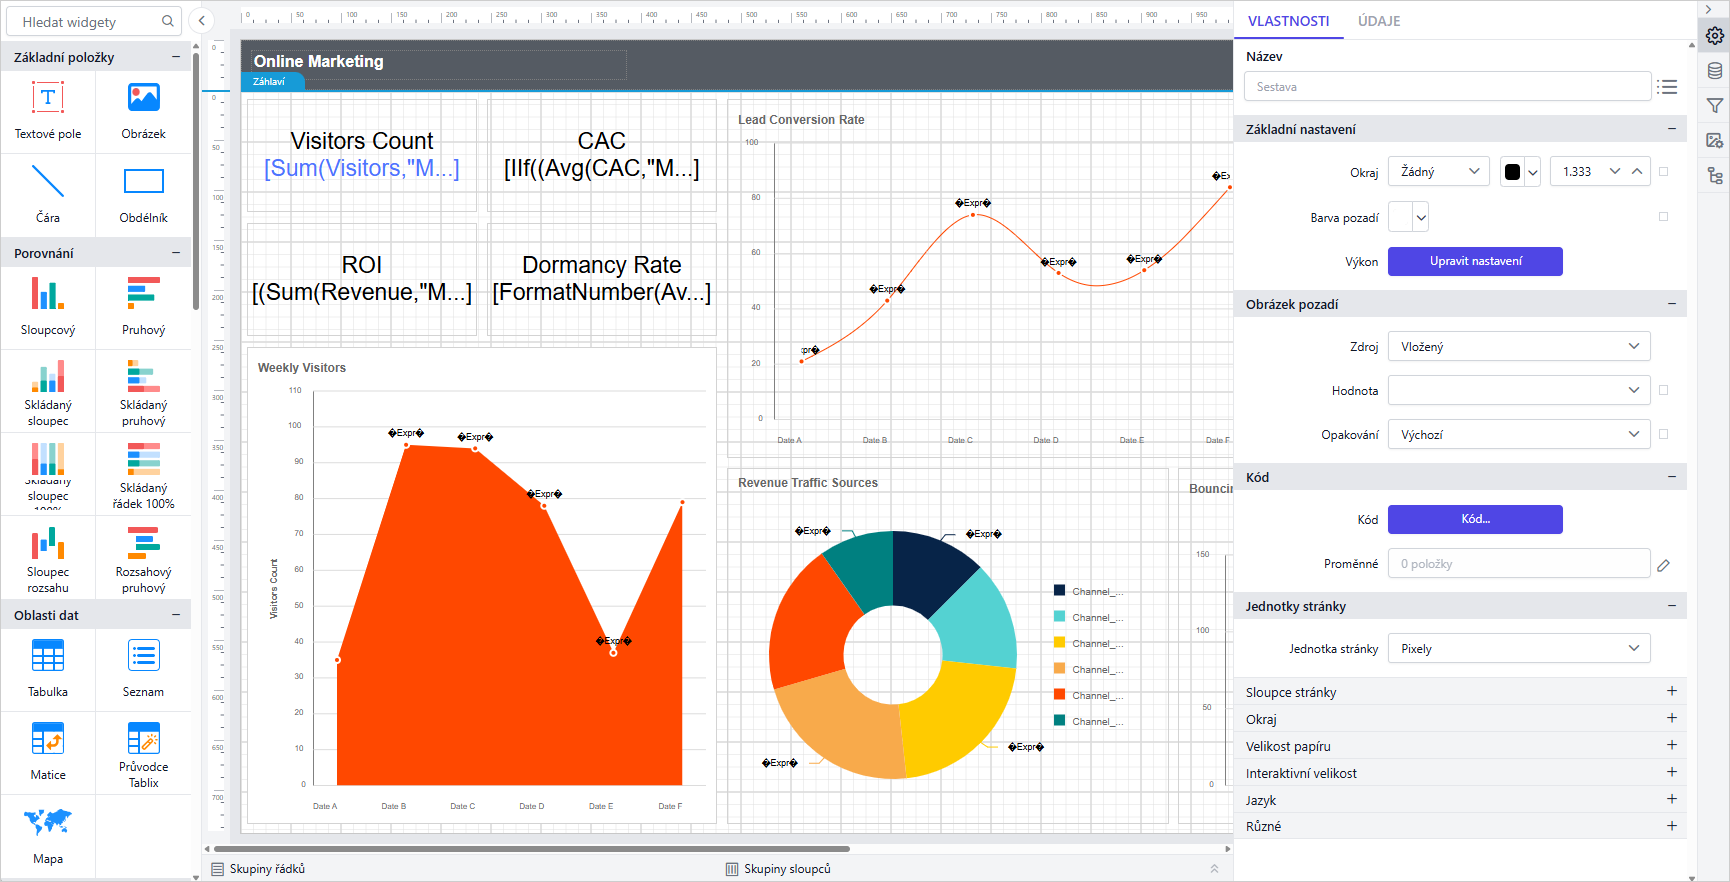
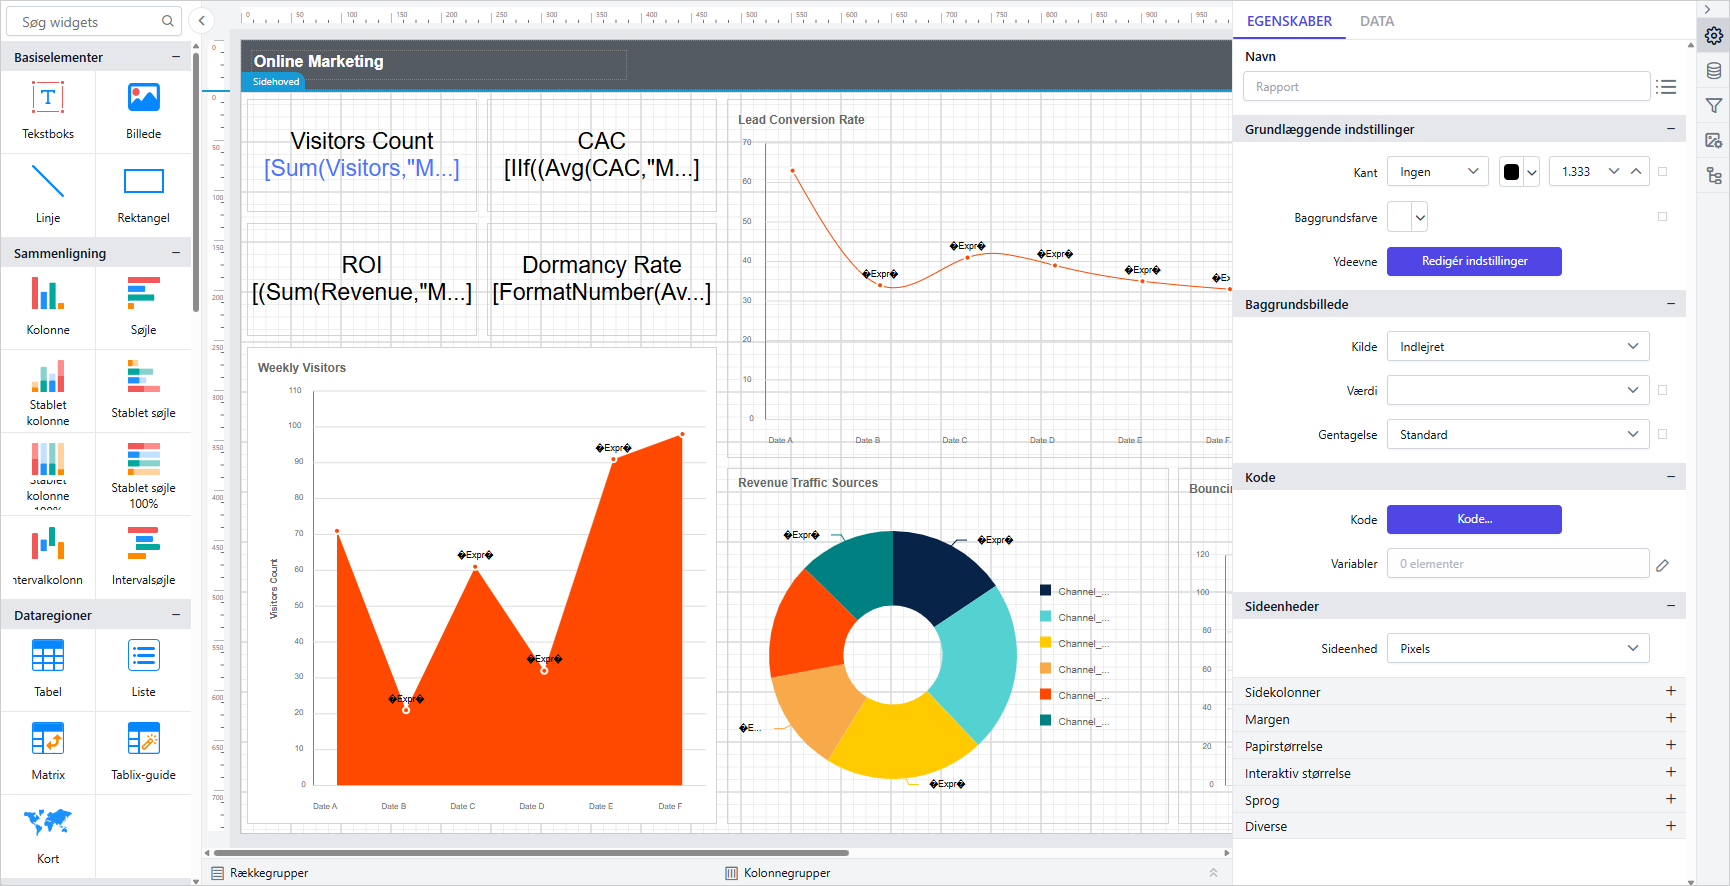
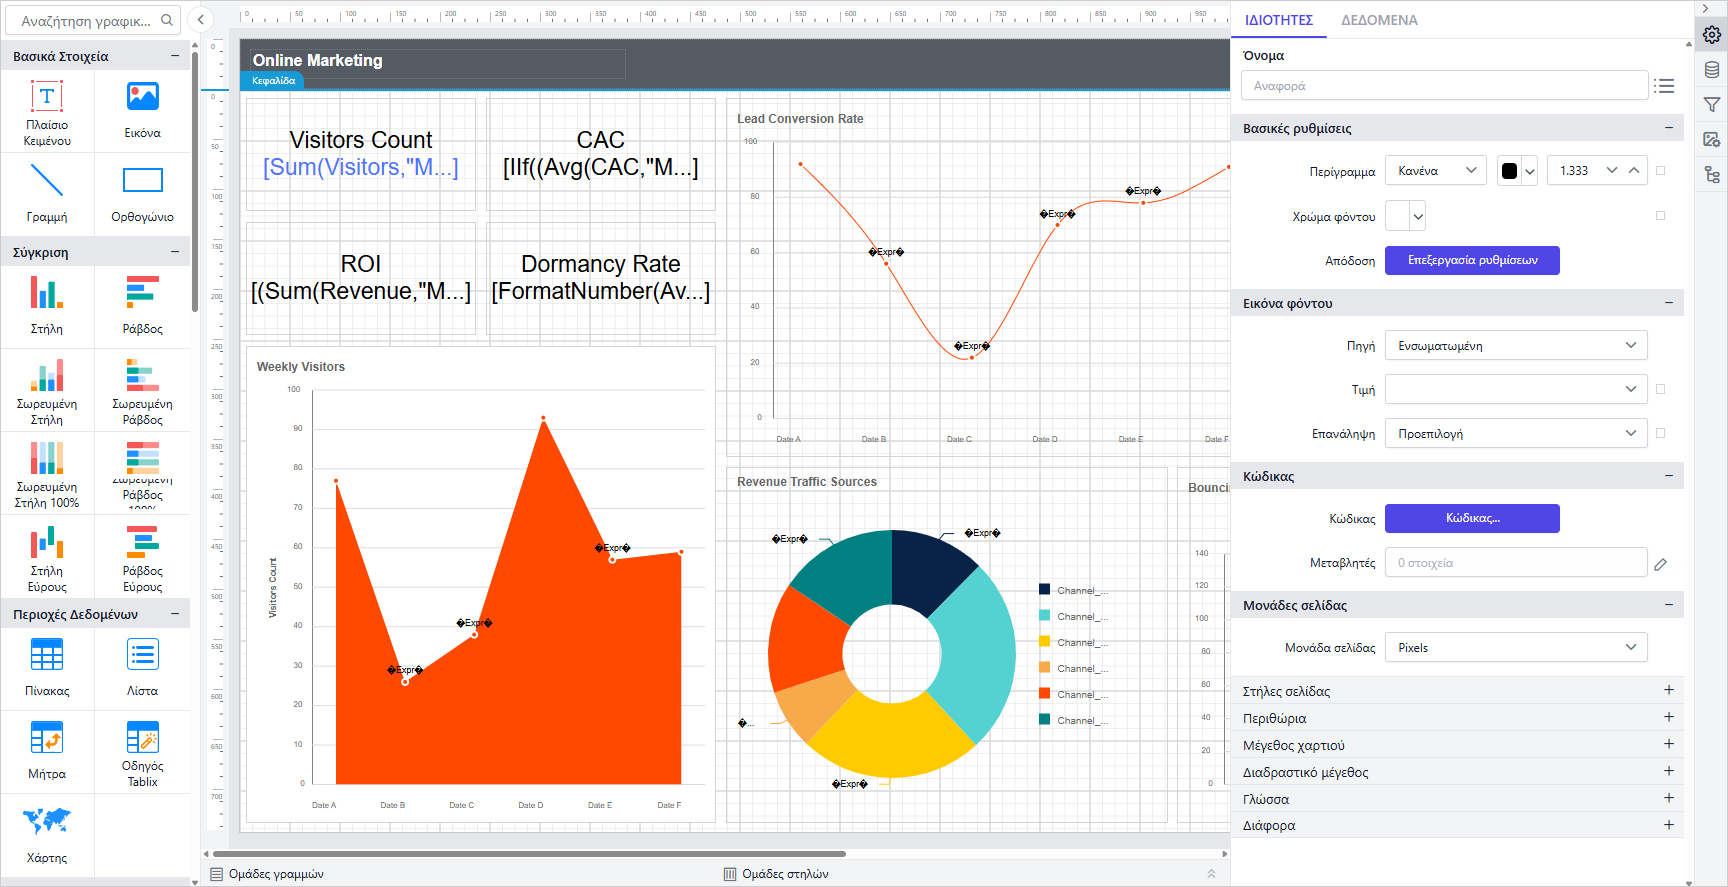
The Report Designer now supports eight additional locales: el-GR, en-GB, nl-NL, da-DK, fi-FI, cs-CZ, et-EE, and th-TH, extending native-language design to more regional teams.
Security Hardening
Fixed multiple security vulnerabilities identified in the Report Designer, reducing exposure to potential exploits and strengthening the application’s overall security posture.
New Shape Types in Shape CRI
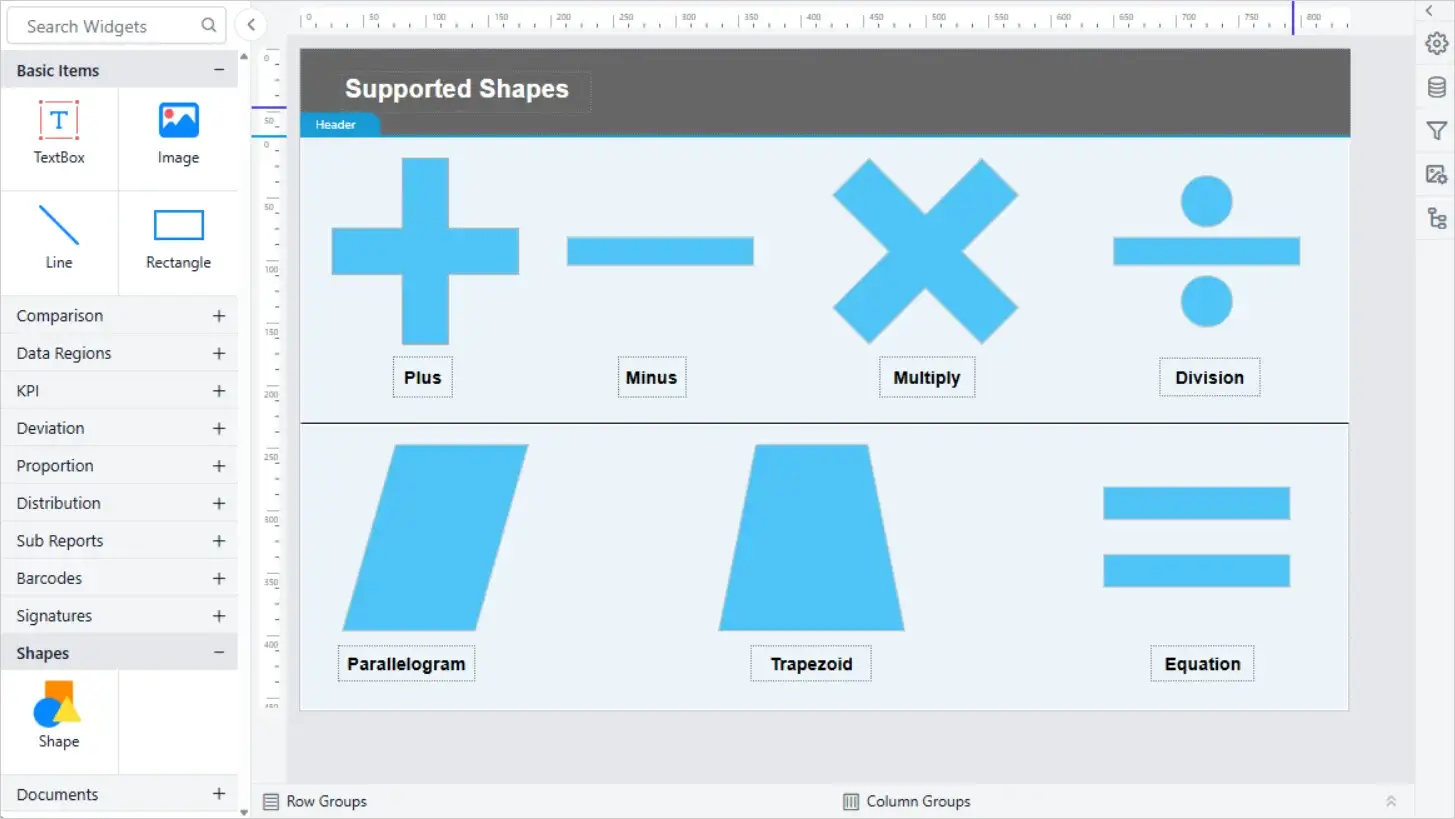
The Shape custom report item supports additional shape types, including operator and flow shapes used in process and calculation diagrams. Operator shapes such as Plus, Minus, Multiplication, Division, and Equation represent calculations, while arrows, Trapezoid, and Parallelogram help depict process flows.
Added support for the Bootstrap 5.3 theme in the Report Designer, enabling reports to align with the latest Bootstrap styling standards.
Report Server
Overwrite Reports Across Tenants
Added support for overwriting reports across tenants, automatically replacing the target report and synchronizing its associated file with the source report definition.
CC Support for Scheduling Recipients
Added CC support for scheduling recipients, allowing users to include additional recipients in scheduled email notifications.
Get Multiple User Permission API
Introduced the Get Multiple User Permission API, enabling retrieval of permission details for multiple users in a single request.
Also added support for publishing a specific report version through the API.
Granular User Management Controls
Added HideAddUser and RestrictManageProfile configuration nodes to customize user management visibility and restrict profile management actions.
Also introduced a User Account Creation toggle in OAuth/OpenID settings to control automatic user provisioning during authentication.
Password-Protected Exports via API
Added support for password-protected report exports through the Export API.
Enhanced Schedule Information Retrieval
Enhanced schedule information retrieval by including Last Run Time, Next Scheduled Run, Schedule Status, File Location, and Schedule Parameters.
Also added support for configuring schedule parameter values as expressions during schedule creation and updates.
Bulk Copy Reports Across Tenants
Added support for bulk copying reports across multiple internal and external tenants, simplifying cross-tenant report migration and distribution.
Report Viewer
Syncfusion Package Upgrade
Upgraded the underlying Syncfusion package to version 33.1.44 across the Report Viewer and Report Writer. The update brings in the latest upstream bug fixes and performance improvements from Syncfusion’s chart and export engines.
Improved Chart Data Label Rendering
Improved data label rendering for the 100% stacked column chart in the Report Viewer, fixing overlapping and misplaced labels across stacked series. Labels now stay legible even with several stacked segments in one column.
Chart Maximum Value Support
Improved support for maximum values in charts, aligning axis and scale behavior with SSRS standards. This keeps chart scaling predictable when migrating reports from SSRS.
Multi-Stripline Support in Charts
Improved multi-stripline support in chart items in the EJ2 Viewer, so multiple striplines now render correctly on the same chart. Reports using several threshold lines on one axis now render them all accurately.
HTML Entity Rendering
Improved HTML entity rendering in the Report Viewer, so encoded characters in report text now display correctly instead of showing raw entity codes. Reports display clean, readable text without manual unescaping.
Custom Query Execution Error Messages
Added support to display an error message along with a custom message during query execution. Report authors and end users now see additional context when a data source query fails.
TextBox Writing Mode Support
Improved support for the TextBox WritingMode property, including Vertical and Rotate270 modes, in the Report Viewer. Reports relying on these writing modes now render consistently between the designer and the viewer.
HIDEDROPDOWNSELECTALL Custom Property
Added support for the HIDEDROPDOWNSELECTALL custom property to hide the Select All option based on the parameter name. This gives report authors per-parameter control over dropdown behavior.
Export Naming by Report ID
Provided support to export server reports with the report name when the report ID is specified in the report path. Exported files now carry a readable report name instead of an opaque identifier.
Bold Data Hub
StarRocks Connectivity via MySQL Protocol
Migrated StarRocks destination connectivity to use the MySQL protocol instead of the previous native driver. This gives pipelines a more stable, widely supported connection path to StarRocks. Existing StarRocks destinations continue to work without reconfiguration.
Primary Key Support for Redshift
Added support for primary keys in the Redshift destination, so pipelines can now define primary key columns when writing to Redshift tables. This enables upsert-style writes that update existing rows instead of only appending new ones. It also helps enforce row-level uniqueness on the destination side.
IDP
Automatic Default User Group Assignment
Introduced a new setting in OpenID, OAuth, and JWT authentication configurations that automatically adds authenticated users to the default user group during login, simplifying user onboarding and access management.
Expanded Custom UI Access Controls
Added the RestrictManageProfile and HideAddUser nodes to custom_ui_reports.json, providing enhanced access control by restricting profile management actions and hiding user creation options in the user interface.
GET and POST Support in JWT Embedding
Added support for handling both GET and POST requests in JWT authentication embedding scenarios.
Login Activity Tab in Audit Logs
Added a new Login Activity tab to the Audit Logs page, displaying user login events along with IP address details for improved security monitoring.
Bug Fixes
Report Designer
Fixed an issue with Data Matrix barcode rendering when the system language was set to Turkish.
Resolved Content Security Policy (CSP) header handling issues in the File Manager component.
Fixed an issue where the Internal visibility setting of report parameters was not retained after reopening a report.
Fixed an issue where empty value nodes were incorrectly serialized when report parameter values were configured as nullable.
Bold Data Hub
Resolved an issue that caused pipeline hangs and missing data in isolated environments.
Fixed an issue where multiple template queries were not working.
Fixed an issue where the Save as Draft option did not function properly in Transform.
Fixed an issue where daily schedules in the CET time zone were skipped without generating logs.
Fixed an issue where data extraction failed when the direct_target_import property was enabled.
Fixed an issue where Python script-based incremental refresh replaced existing data when IsDropTable was set to false.
Fixed an issue where removing columns during table transformation created duplicate columns in destination tables.
Fixed file path restriction issues during data processing and extraction.
Fixed data extraction failures in Doris and ClickHouse destinations.
Fixed an issue where datasource creation failed in Bold BI when MySQL was used as the datastore in Bold ETL.
Fixed an issue with incorrect maximum month-year selection for updated columns.
Fixed an issue where Apache Doris displayed MySQL host information incorrectly.
Fixed an issue where datastore settings could be saved without specifying a database name in Bold ETL.
Fixed an issue where incremental refresh did not update existing data in MSSQL.
Fixed a pagination display issue on the Transform page at 100% browser zoom.
Resolved an issue in Linux environments with Oracle IMDB where transformed tables were not moved to the destination correctly.
Resolved an issue that prevented dragging and dropping the Add Pipeline button.
Resolved an issue where the HubSpot connector was not working.
IDP
Resolved an issue that caused login failures during Site-Level JWT authentication.
Fixed an issue where a new PostgreSQL database could not be created due to a collation mismatch during application startup and site creation.
Fixed an issue in MS SQL (Shared DB) where saving JWT settings failed on the first attempt.
Fixed an issue where uploading an invalid license file did not display an appropriate error message.
Fixed an issue where updates to the Proxy FullPath URL did not synchronize DNS values in tenant configuration.
Resolved an issue with OpenID Provider SSO logout to ensure proper session termination and sign-out behavior.
Fixed an issue where non-administrative users were unable to navigate to tenant sites from the UMS Home page.
Known Issues
Report Server
Support for HTML Document and PDF Document Custom Report Items is not available in OCI Storage environments without persistent volumes.
Bold Data Hub
Bold Data Hub is currently not supported when using dedicated OCI Storage without persistent volumes and in Azure App Service deployments.
Important Notes
Common
Discontinued support for Theme Studio v1 for the Report Viewer and Report Designer. Users should migrate to v2 for continued theme customization support.
To maintain a consistent naming standard across all Bold Reports deployment modes and installation options, the installer packages and related GitHub repositories have been renamed. These changes are naming updates only and do not affect functionality, deployment procedures, or existing configurations.
These updates align the naming convention across installers, deployment packages, and repository resources, making it easier to identify and manage Bold Reports Server deployments across different environments.