
SAMPLE REPORT FOR DATA VISUALIZATION
Website Analysis Report
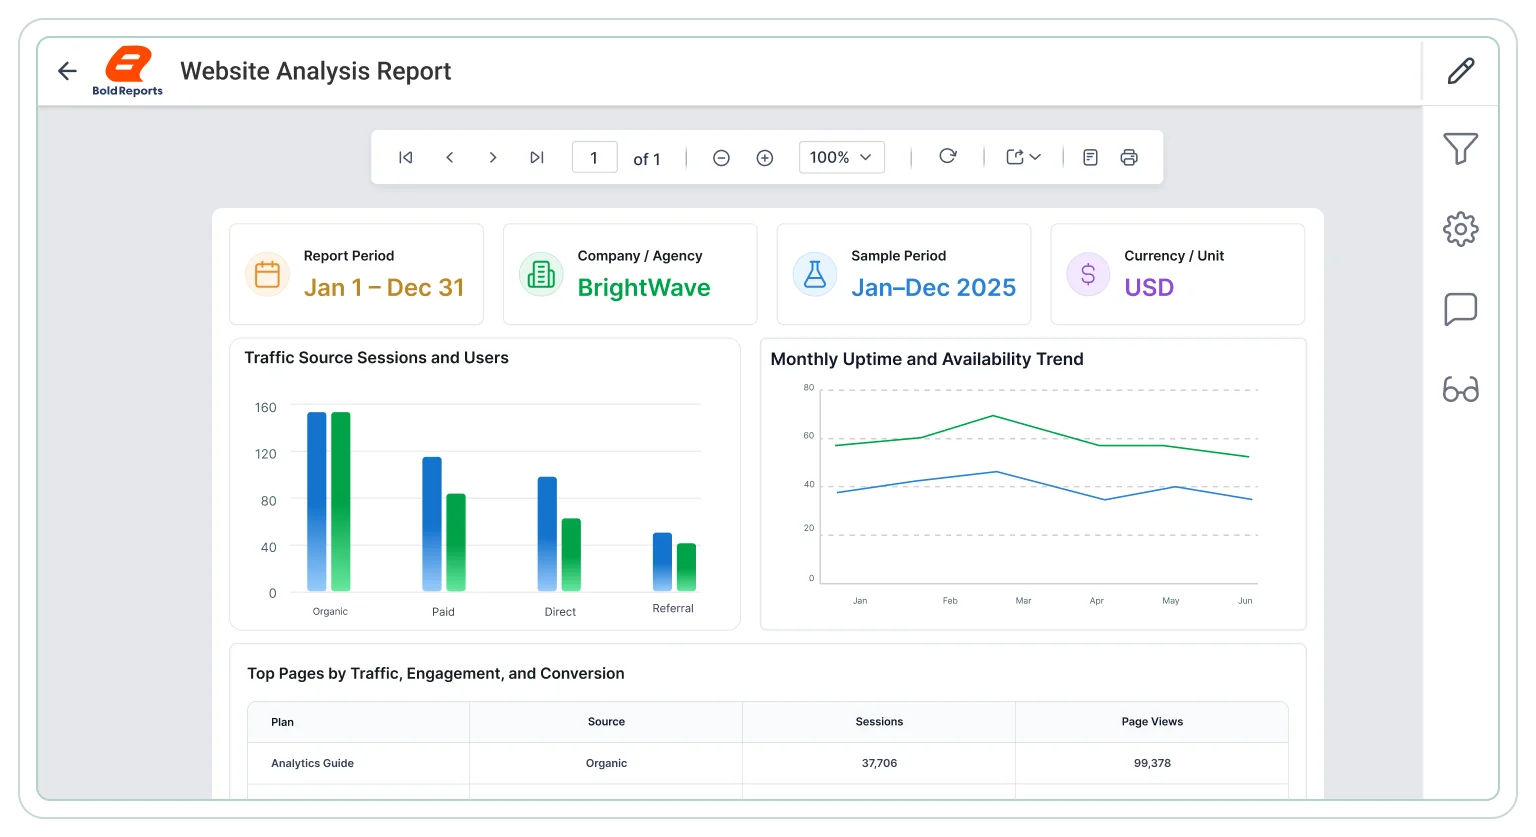
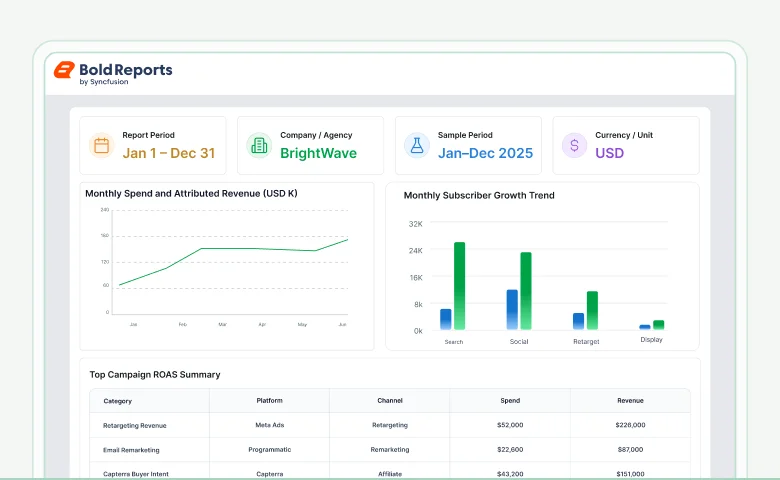
The Website Analysis Report is a sample paginated report for Bold Reports, built for digital marketing and growth teams and available as an editable RDL file. It evaluates website performance with funnel analysis, channel comparisons, trend tracking, and visibility across visitors, leads, customers, revenue, and conversions.
Trusted by companies including








Real-world business scenarios
Explore key use cases
The Bold Reports Website Analysis Report covers four use cases: visitor and lead funnel evaluation, revenue performance, customer value, and engagement and retention. Use it to assess how website interactions influence lead generation, customer acquisition, and revenue outcomes.
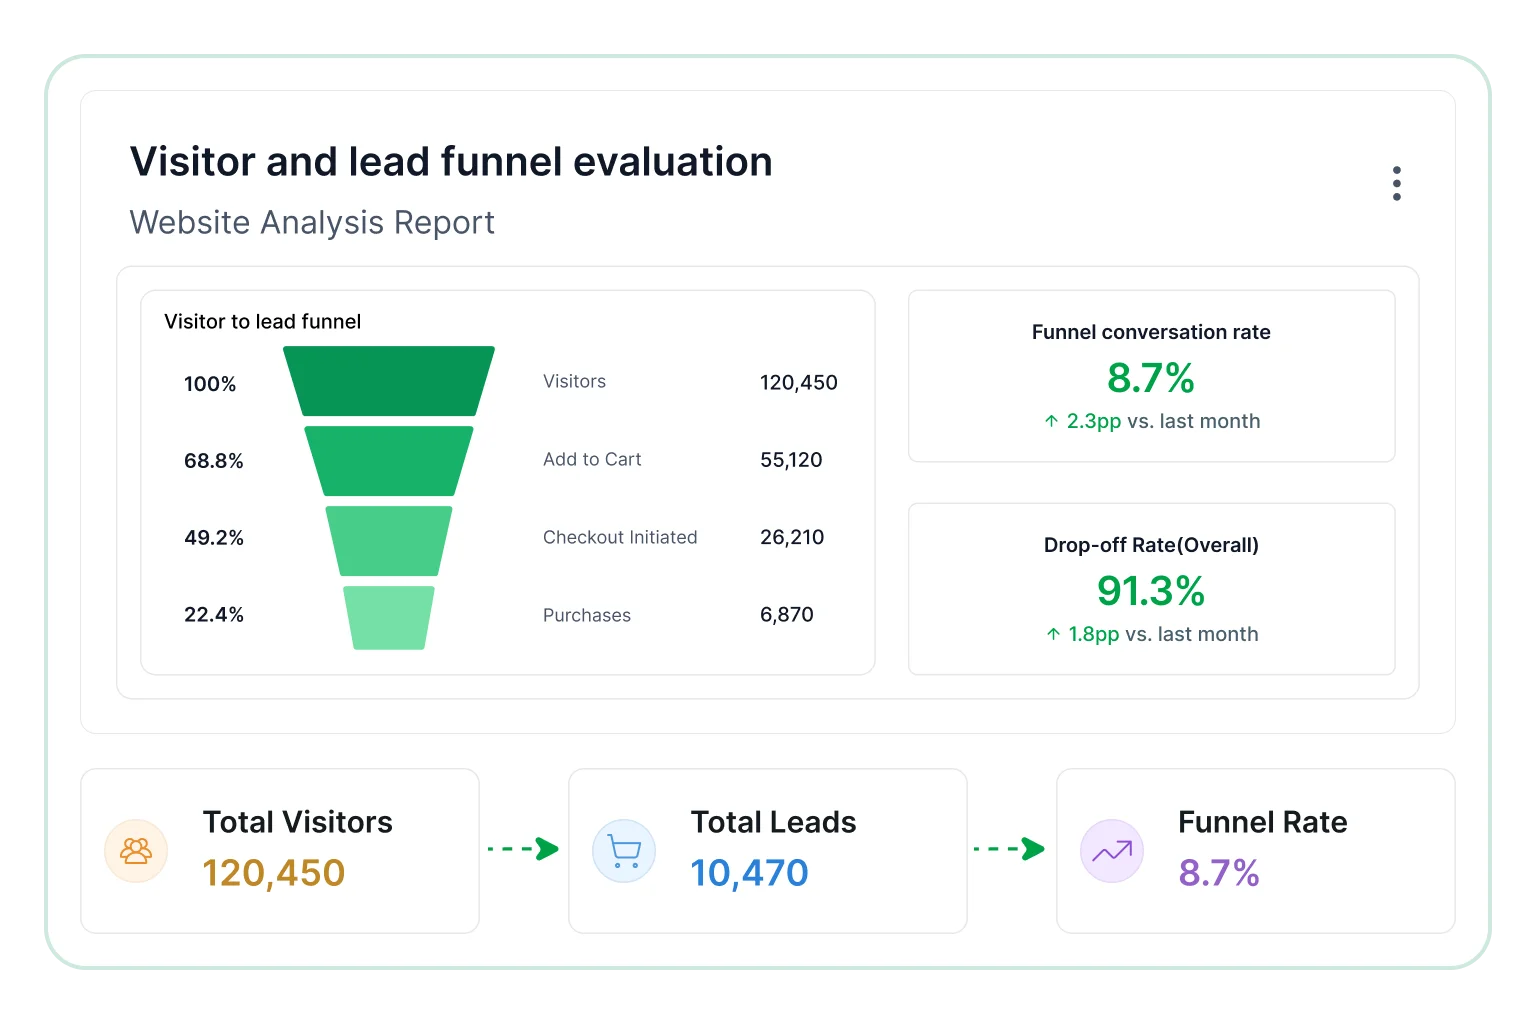
Visitor and lead funnel evaluation
A structured view of how website traffic converts into leads and customers across channels and campaigns.
- Track visitor count alongside generated leads and conversions.
- Evaluate progression from leads to qualified leads and sales.
- Compare conversion efficiency across funnel stages and paths.
- Identify drop-off points in the user journey and conversion flow.
- Analyze alignment between traffic and acquisition outcomes over time.
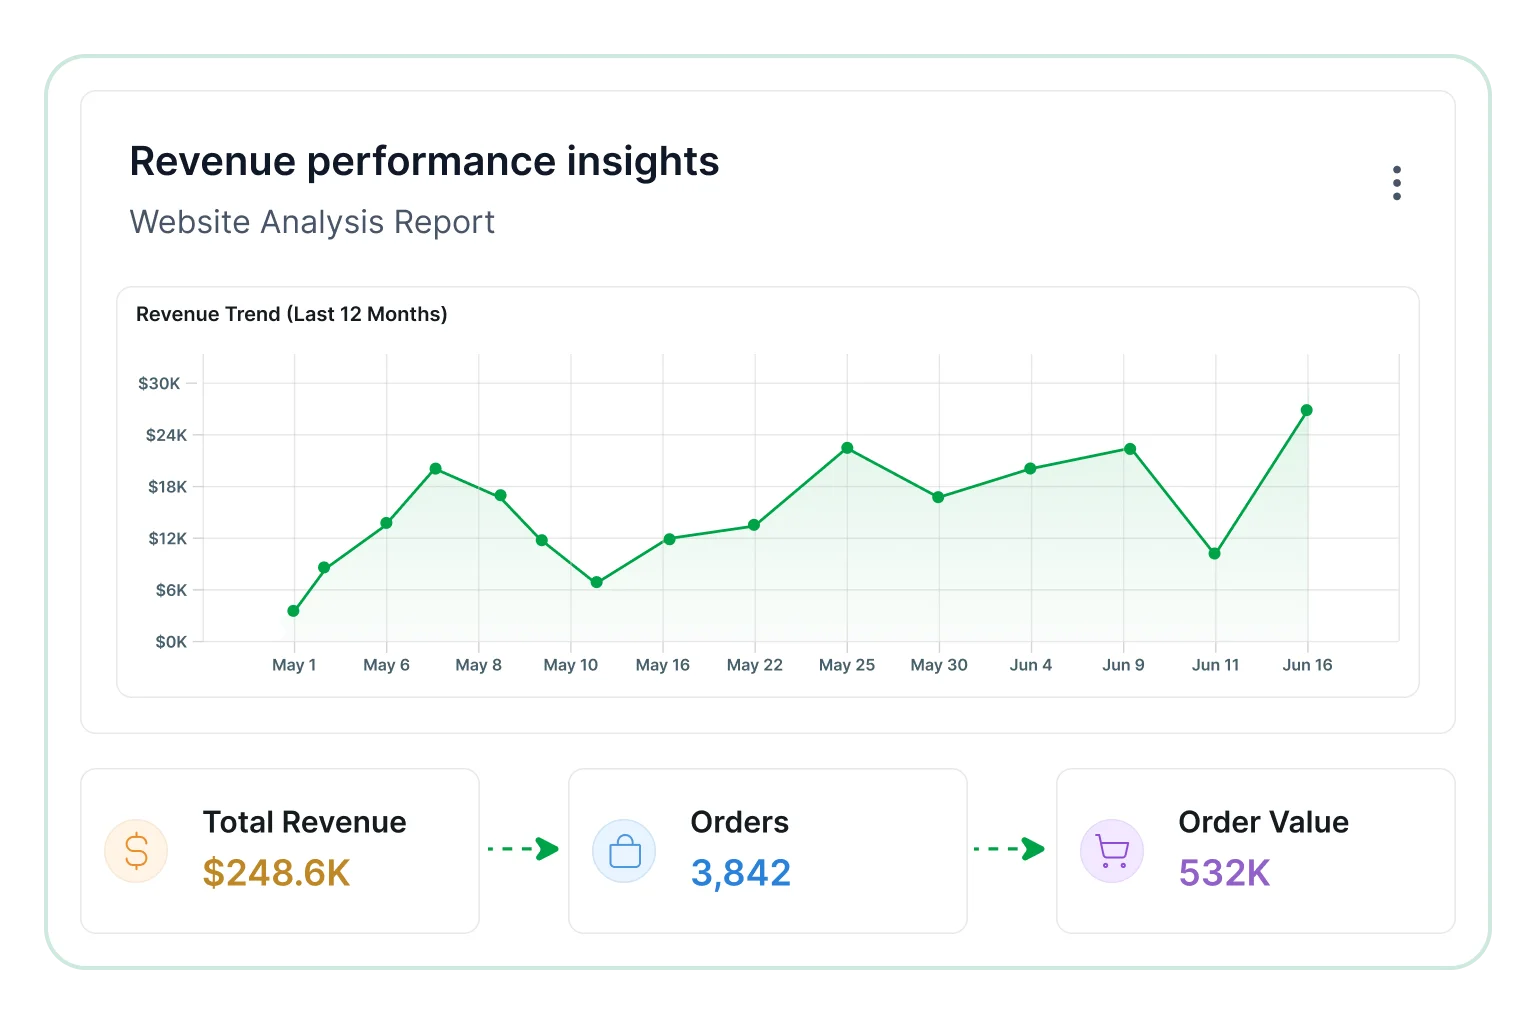
Revenue performance insights
Designed to interpret financial outcomes generated through the website and support better decisions.
- Track monthly recurring revenue trends and subscription growth.
- Evaluate annual recurring revenue contribution across segments.
- Compare gross transaction volume across periods and markets.
- Identify revenue growth or decline patterns in each channel.
- Analyze monetization effectiveness across products and plans.
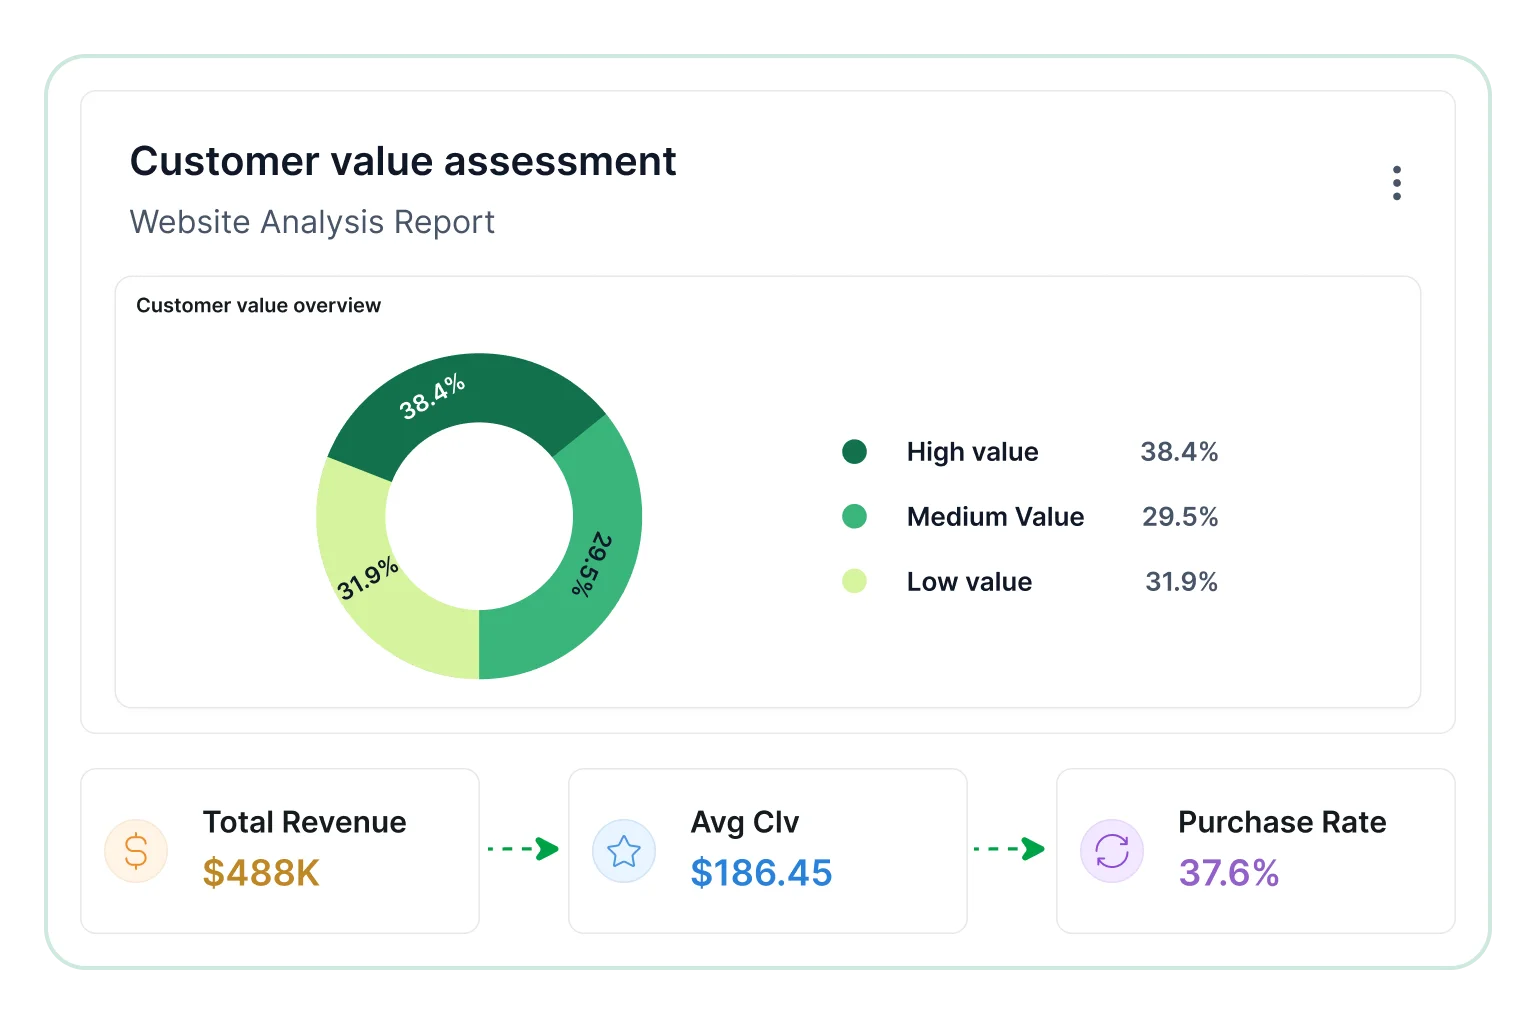
Customer value assessment
Useful for understanding long-term customer contribution across channels, campaigns, and periods.
- Evaluate customer lifetime value trends across segments and cohorts.
- Compare revenue per customer over time and customer cohorts.
- Identify patterns in customer value growth by cohort segments.
- Measure consistency in customer spending across periods and cohorts.
- Analyze contribution of high-value customers across time and segments.
Engagement and retention indicators
Supports evaluation of website interaction quality, user retention, and overall engagement tracking.
- Monitor bounce rate across reporting periods and pages and sessions.
- Track churn trends among users and cohorts over reporting periods.
- Compare engagement levels across sessions and channels over time.
- Identify patterns indicating user disengagement and churn over time.
- Evaluate retention effectiveness across reporting periods and cohorts.
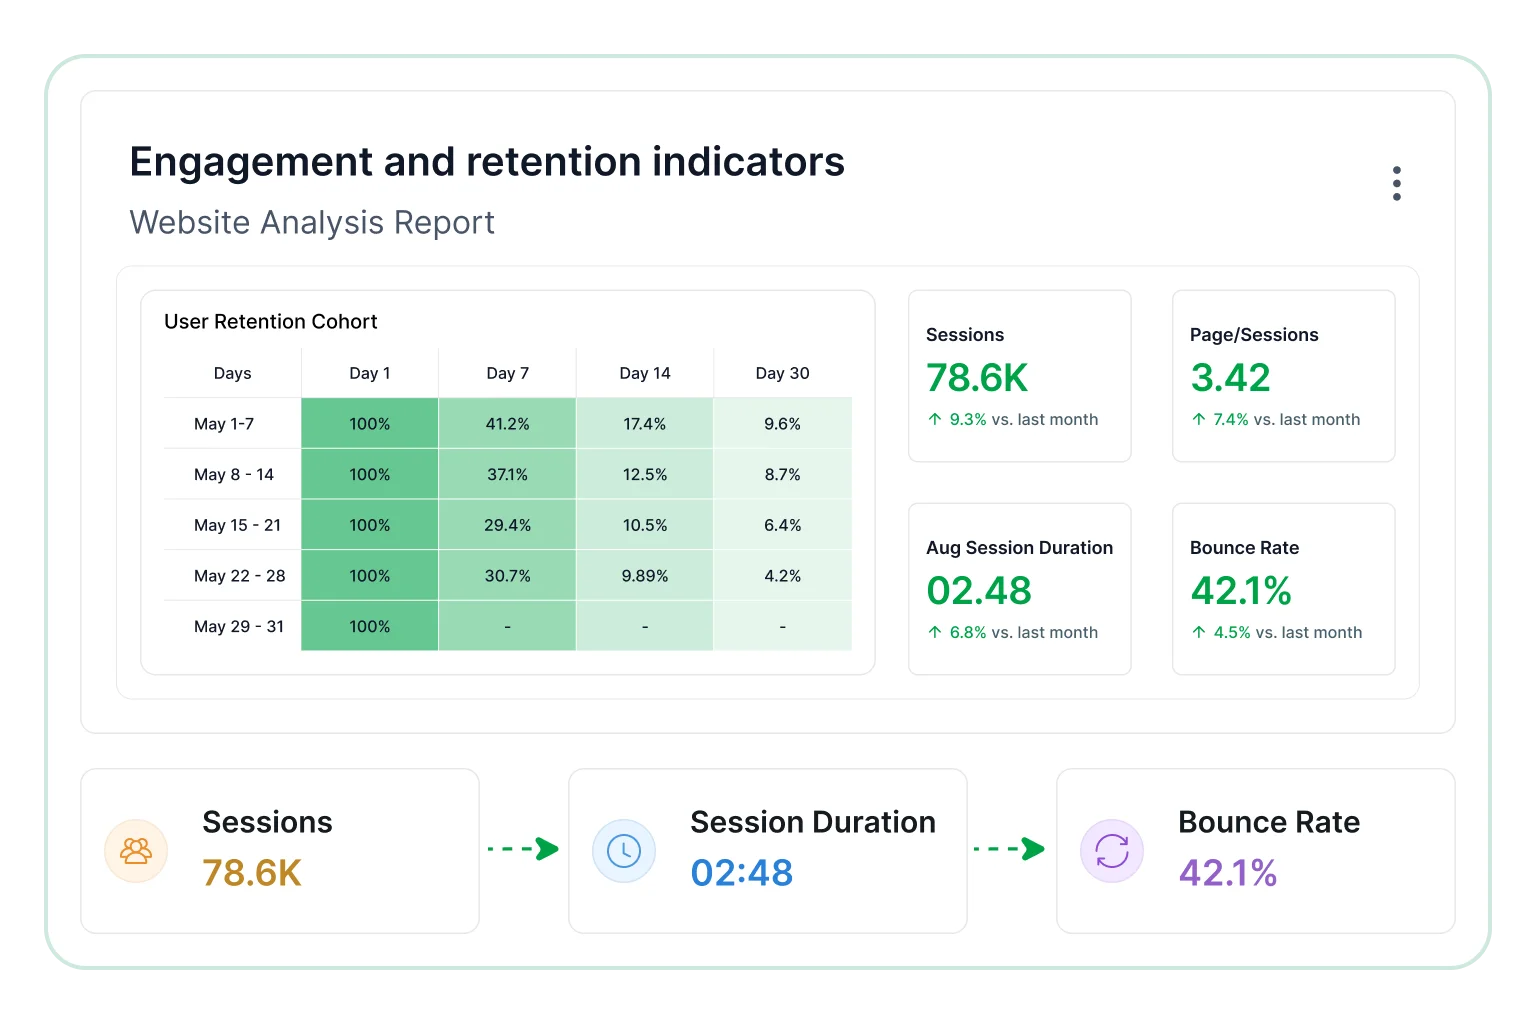
Monitor critical KPIs
Which key metrics does the Website Analysis Report track?
The Bold Reports Website Analysis Report tracks visitor count, leads, conversions, monthly recurring revenue, annual recurring revenue, gross transaction volume, customer lifetime value, bounce rate, and churn. These indicators cover website performance, engagement quality, and revenue outcomes across channels, campaigns, and devices.
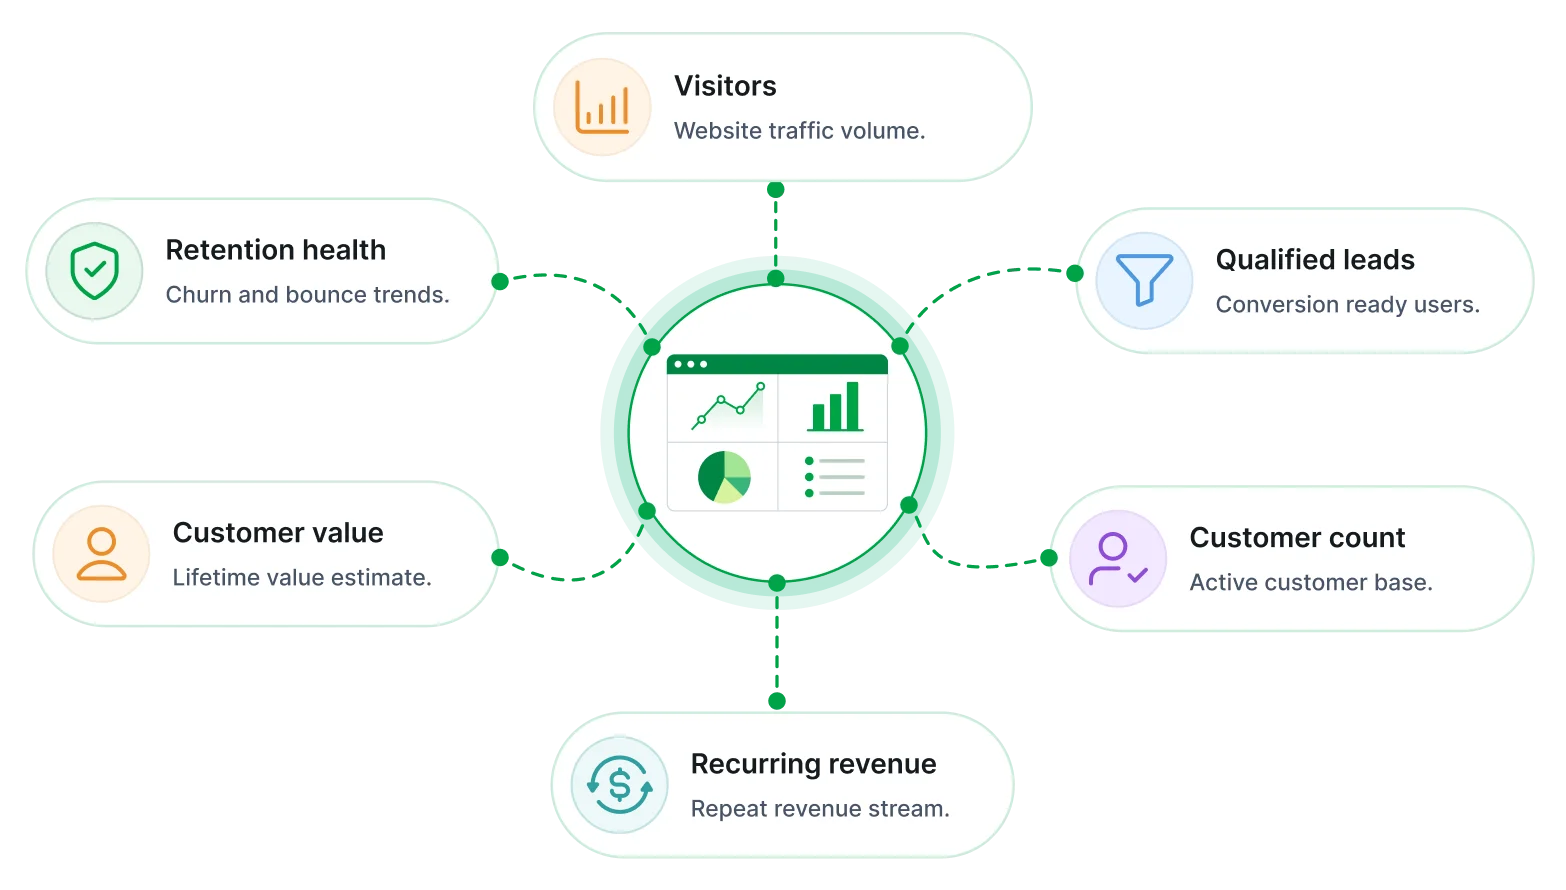
Overview of this report
What is a website analysis report?
The Website Analysis Report is a paginated sample report for Bold Reports that combines traffic, lead generation, engagement, conversion, and revenue data into one view. Organizations use it to understand visitor behavior and optimize growth.
No credit card required.
Website traffic visibility
Monitor visitor activity, acquisition sources, and traffic trends across reporting periods.
Customer behavior evaluation
Analyze engagement, retention, and customer value patterns across channels, campaigns, and periods.
Funnel performance analysis
Track how visitors progress through lead generation and customer acquisition stages.
Conversion optimization support
Identify friction points, drop-offs, and opportunities for improving website performance.
Revenue contribution insights
Understand how website interactions influence recurring revenue and business outcomes.
Consistent growth monitoring
Track website performance through structured reporting and recurring review cycles.
Built for your team
Designed for digital marketing and growth teams
Access structured insights into website traffic, engagement, conversion activity, and revenue performance through a unified reporting approach.
Centralized reporting
Combine website analytics, marketing, and revenue data into a single reporting view for deeper insights.
Funnel and conversion insights
Understand how visitors progress through acquisition and conversion journeys across channels and pages.
Secure and role-based access
Control visibility and securely share website performance information across teams and stakeholders.
Revenue performance monitoring
Track recurring revenue, customer value, and monetization effectiveness across channels and periods.
Automated report delivery
Schedule recurring reports for marketing reviews and growth analysis across channels and campaigns.
Cross-team visibility
Share website performance insights across marketing, product, sales, and leadership teams.
Tailor to your needs
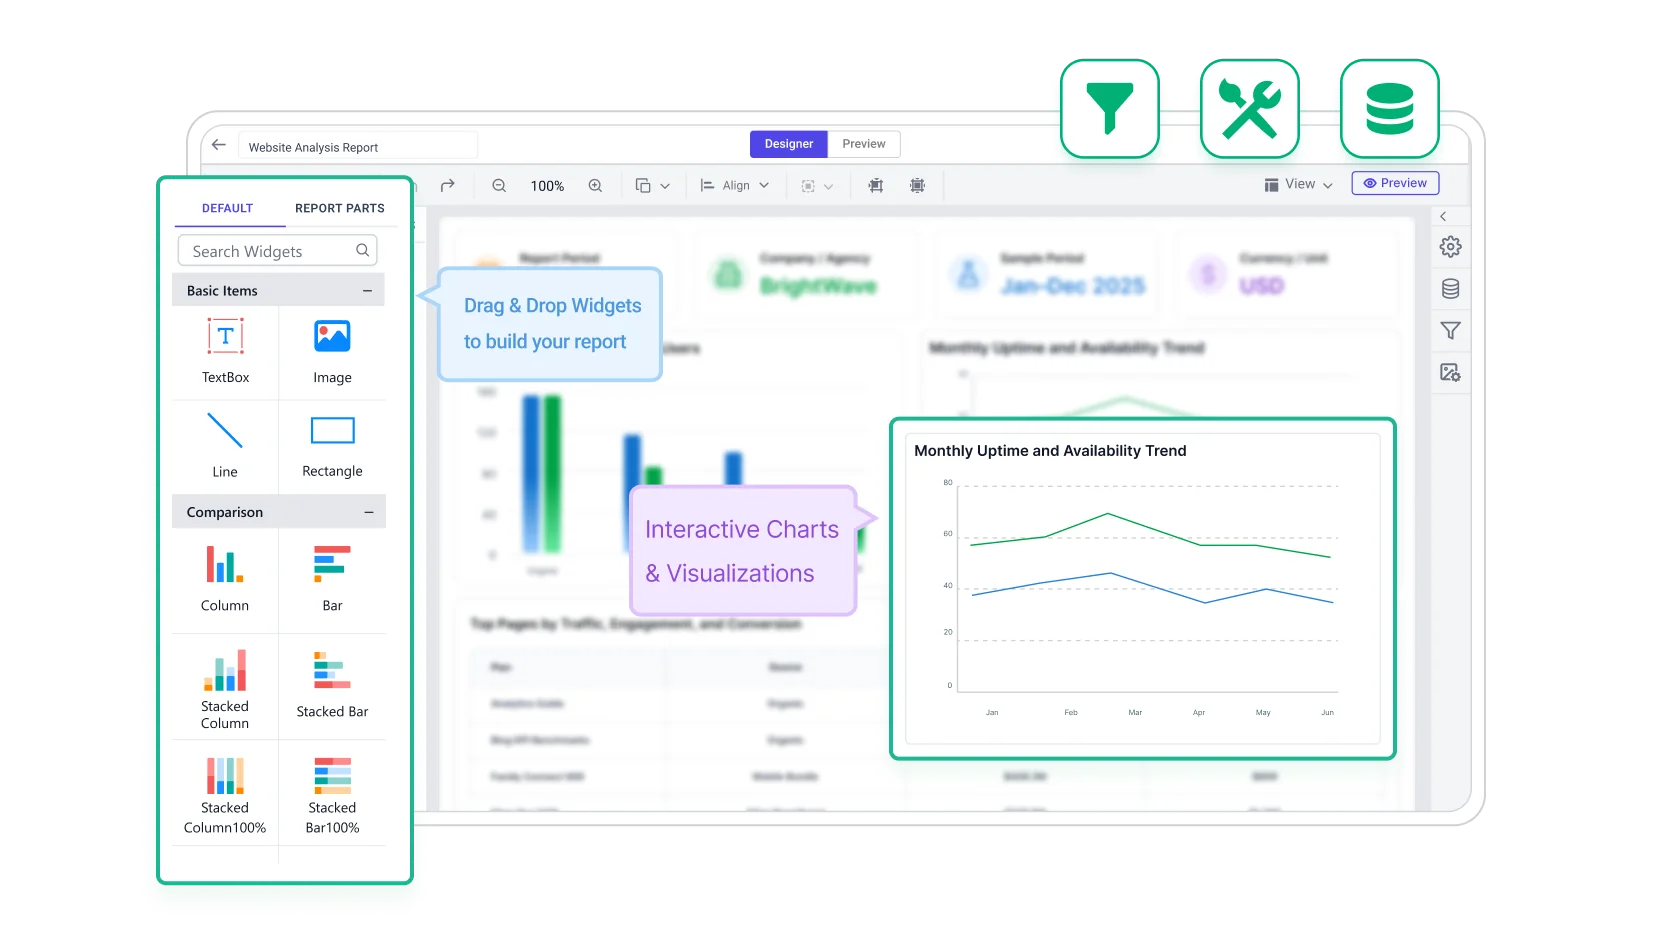
Build & customize
Website analysis reporting can be configured around KPIs, filters, and recurring delivery requirements. Bold Reports exports these layouts to 7 formats (PDF, Excel, Word, PowerPoint, CSV, XML, and HTML) and supports scheduled outputs for website optimization and growth analysis.
 Filter by source, page, device, and campaign.
 Track engagement and conversion KPIs.
 Drillinto page and funnel performance.
 Export reports in multiple formats.
 Schedule recurring report delivery.
No credit card required.
Templates
Website analysis report templates
Monitor website activity and user behavior across traffic, engagement and conversion performance to spot trends, optimize journeys, and boost results.
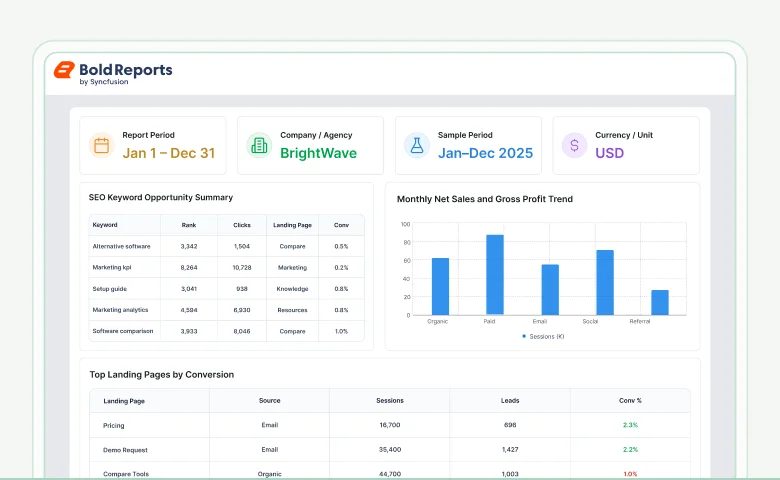
Connectors
Data integrations
Bold Reports lists 27 data connectors across six categories, from files and databases to web services, for integration, transformation, and storage ready for reporting.
Common questions answered
Frequently asked questions
Understand how users interact with digital platforms through reports on visitor activity, page performance, and engagement trends.
What data sources can be included in the report?
Bold Reports can connect website analytics platforms, marketing systems, CRM applications, and revenue data sources to track traffic, engagement, conversions, and business outcomes.
How often should website reports be generated?
Weekly reports help monitor operational performance, while monthly reviews support trend analysis and strategic planning. The downloadable .rdl file contains the report layout only, so connect your own data sources in Bold Reports before scheduling it.
How are conversion funnel metrics calculated?
Conversion metrics are based on user actions, goal completions, and progression through defined funnel stages.
Can website performance and behavior be analyzed?
Yes. Technical performance indicators, engagement metrics, and conversion activity can be combined to provide a complete view of website effectiveness.
Can reports be generated automatically?
Yes. Bold Reports can schedule reports to run automatically at defined intervals, ensuring consistent monitoring and reducing manual effort.
How is user data protected in reports?
Role-based access control (RBAC), authentication controls, and permission settings help ensure website analytics data remains secure.
Stop Exporting Data. Start Embedding Reports.
Turn your data into production-ready reports instantly
Create pixel-perfect, print-ready reports and export them to PDF, Excel, Word, and other formats.
No credit card required.