
Embedded Reporting in React: A Complete Developer Guide
TL;DR:
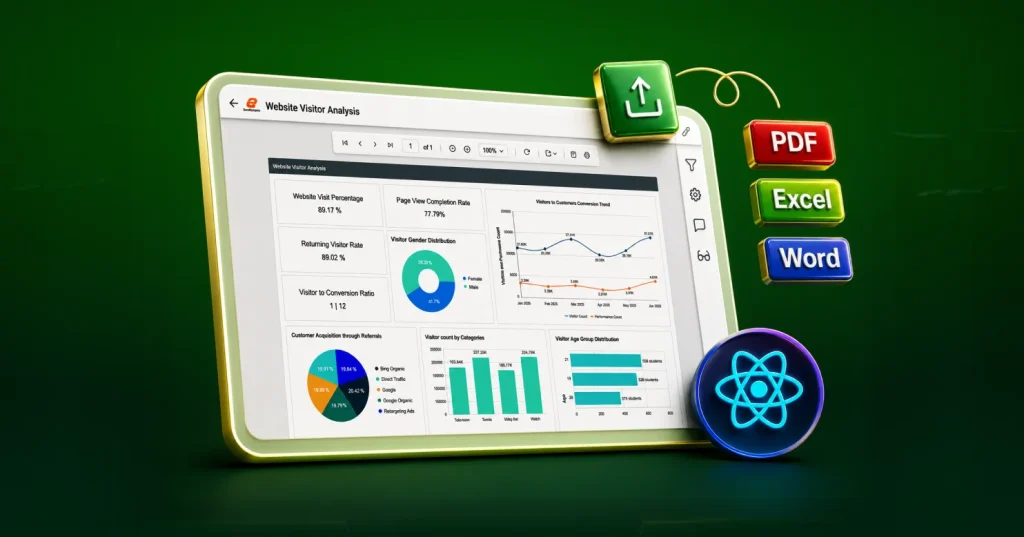
Embedded reporting in React enables applications to deliver paginated, export-ready reports using a server-side Reporting API. With Bold Reports, end users can view and export reports through the Report Viewer, while administrators create and manage reports using the Report Designer.
Introduction
Modern SaaS applications deliver structured, export-ready reports within their product. Whether it’s invoices, financial statements, audit summaries, or operational reports, users expect:
-
- Consistent formatting across devices.
- Reliable exporting to common formats (PDF, Excel, Word).
- Repeatable, production-ready outputs.
When users rely on raw data exports or manual workflows, it creates friction, increases support overhead, and reduces product value. To bypass these challenges, many SaaS organizations adopt embedded reporting, enabling applications to generate and deliver professionally formatted reports directly within their product.
Rather than handling complex reporting logic in the front end, applications integrate a server-side reporting engine for pagination, layout management, and export generation. The React application can remain focused on delivering a seamless user experience.
In this guide, you’ll learn how to:
-
- Implement the reporting architecture.
- Embed the Report Viewer and Designer in a React app.
By the end, you’ll be able to deliver scalable, paginated, export-ready reports inside your React application.
Why embedded reporting matters in React apps
A strong embedded approach keeps the React app focused on the UI while a reporting service handles rendering, pagination, and export of reports. Selecting the right embedded reporting tool is essential for delivering secure, scalable reporting experiences in modern React applications.
1. Keep reporting inside the workflow
Let users generate reports like invoices or statements without leaving your application. Embedded reporting enables self-service access, reducing dependency on support teams.
2. Ensure consistent pagination and layout
Paginated reports depend on precise formatting of:
-
- Headers and footers
- Page breaks
- Grouped totals
Server-side rendering ensures reports look identical in all devices and exports.
3. Deliver reliable exports like PDF and Excel
Exports are often the final output, not an optional feature. Embedding Bold Reports ensures users can download production-ready documents instantly.
4. Avoid heavy client-side rendering
Large datasets can degrade browser performance. Offloading rendering to a reporting server keeps your React app fast and responsive.
5. Enforce governance with a viewer and designer
Most SaaS apps need end users to be able to run and export reports, but only admins to create or edit them. Bold Reports keeps these capabilities separate in two different tools:
-
- React Report Viewer: For end users to view and export reports.
- React Report Designer: For admins to create and edit reports.
This separation prevents changes by unauthorized users.
6. Support multitenant architectures
Embedded reporting enables:
-
- Tenant isolation
- Role-based access control (RBAC)
- Parameter validation
This is critical for secure SaaS environments.
Choosing from the Report Viewer, Report Designer, and Dashboards in React Reporting
When embedding reporting in a React application, it’s important to distinguish among report consumption, report authoring, and interactive data views. Each component serves a specific role in delivering paginated reports or supporting related analytics use cases.
This table compares the Report Viewer, Report Designer, and dashboards to help you understand where each fits within a reporting-focused architecture.
| Capability | Report Viewer | Report Designer | Dashboards |
| Best for | Consuming reports | Authoring reports | Interactive analytics |
| Output | Paginated pages and exports | Report definitions and preview | Charts, cards, gauges, maps |
| Access | Most users | Admins/power users only | Varies |
| Governance | Medium | Highest | Medium |
In a reporting-focused setup:
-
- The React Report Viewer is the primary interface for delivering paginated, export-ready reports to end users.
- The React Report Designer enables the controlled creation and maintenance of report definitions.
- Dashboards are complementary and are not a replacement for reports.
For most React applications, combining the Viewer for report consumption and the Designer for report authoring ensures a scalable, secure, and fully managed reporting experience.
Architecture: How embedded reporting works
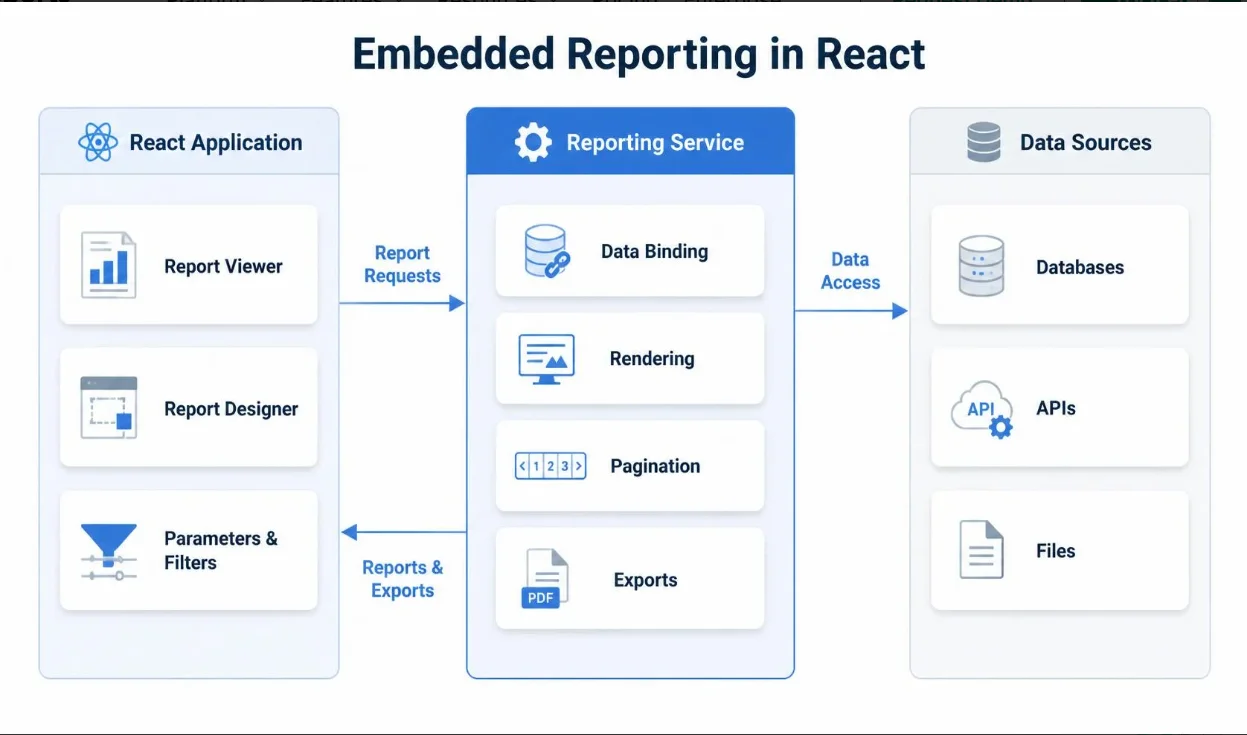
Request flow
- A user opens a report route in the React application.
- React renders an embedded React Report Viewer or an admin-only React Report Designer.
- The component sends requests to the configured Bold Reports Reporting API.
- The server processes the report, including data binding, layout, and pagination.
- The rendered output or export file is returned to the application.
- The React UI displays the report and enables actions such as pagination, parameter input, and export.
Key idea: Rendering and exports are handled on the server to ensure consistent formatting, centralized control, and scalable performance.
Step-by-step: Setting up embedded reporting in React
Prerequisites
-
- A running Bold Reports server: cloud, on-premises, or hybrid with a reachable Reporting API endpoint.
- Network access from your React app to the Bold Reports server.
- Node JS (version 8.x or 10.x)
- NPM (v3.x.x or higher)
Step 1: Install the Create React App package
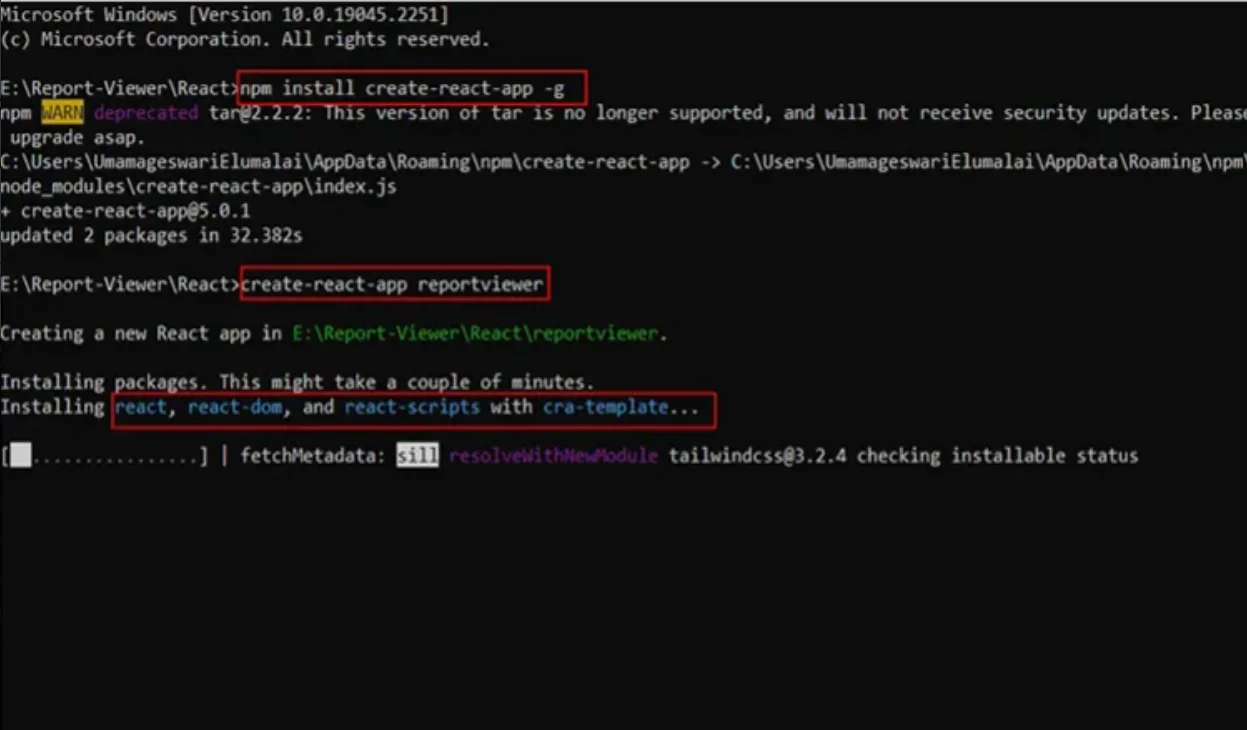
Create React App is a simple way to create a single-page React application that provides a build setup with no configuration. To install the Create React App globally in your machine, run the following command in the Command Prompt.
npm install create-react-app -g
Step 2: Install the Create React Class
To configure the Report Designer component, change the directory to your application’s root folder.
cd reports
To install the type definitions for create-react-class, run the following command in Command Prompt.
npm install create-react-class --save
Step 3: Install the Bold Reports React package
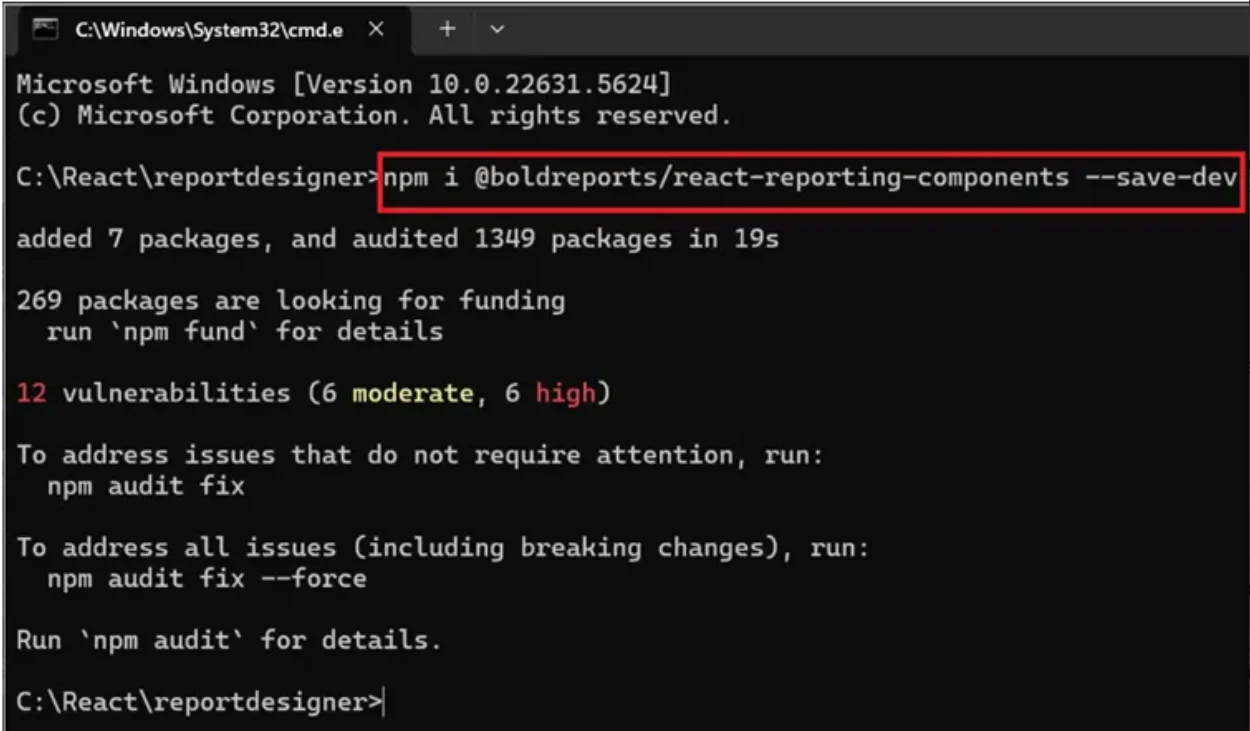
Run the following commands to install the Bold Reports React library.
| React version | NPM package installation |
| Newer than 16 | npm install @boldreports/react-reporting-components@latest —save-dev |
| 16 or earlier | npm install @boldreports/[email protected] —save-dev |
Warning: These versions may have compatibility limitations with newer React features.
Using the latest package with React 16 may cause compilation issues. Make sure to install the correct version to avoid problems.
npm install @boldreports/react-reporting-components --save
Step 4: Adding scripts reference
Bold Reports needs a window.jQuery object to render the React components. Create a file named globals.js and import jQuery in it, as in the following code snippet.
import jquery from 'jquery';

import React from 'react';

import createReactClass from 'create-react-class';

import ReactDOM from 'react-dom';

window.React = React;

window.createReactClass = createReactClass;

window.ReactDOM = ReactDOM;

window.$ = window.jQuery = jquery;
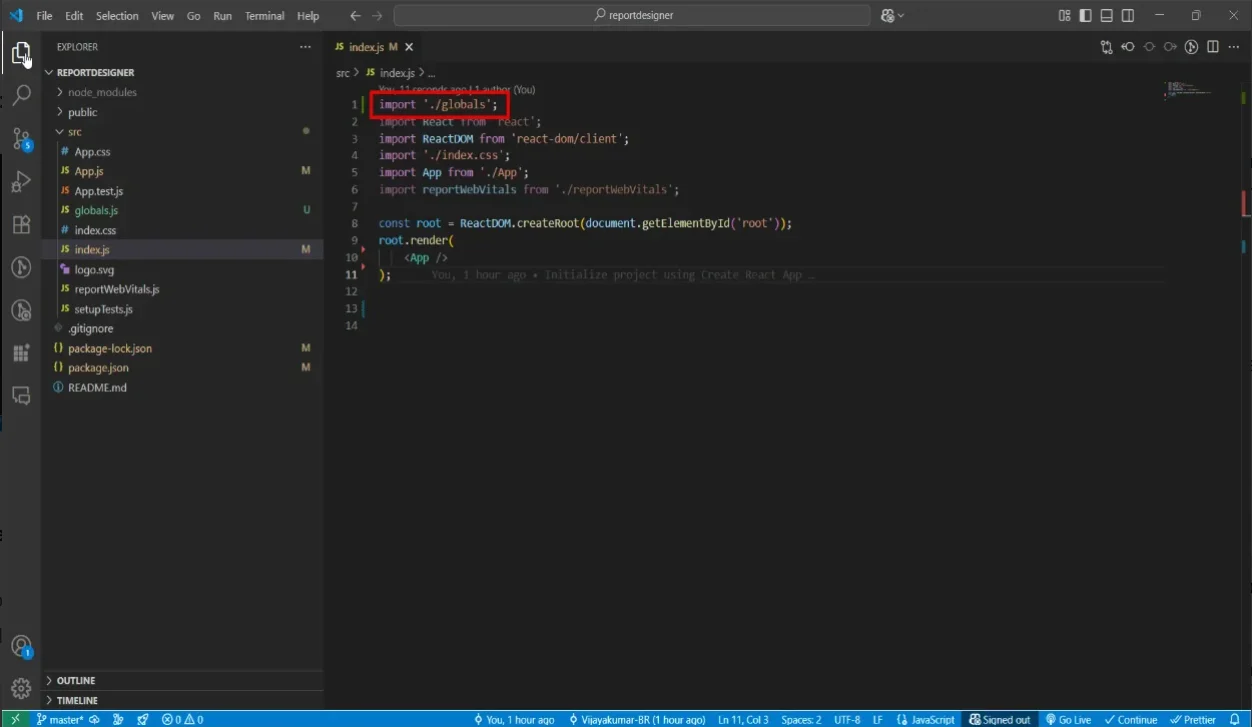
Reference the globals.js file in the index.js file, like in the following code snippet.
- React (version 17x or earlier)
- React (version 18x)
import './globals';

import React from 'react';

import ReactDOM from 'react-dom';

import './index.css';

import App from './App';

//serviceWorker will show warning "unused".

//import * as serviceWorker from './serviceWorker';

ReactDOM.render(<App />, document.getElementById('root'));
import './globals';

import React from 'react';

import { createRoot } from 'react-dom/client';

import './index.css';

import App from './App';

import reportWebVitals from './reportWebVitals';

const root = createRoot(document.getElementById('root'));

root.render(

<React.StrictMode>

<App />

</React.StrictMode>

);
Step 5: Embedding the Report Designer component
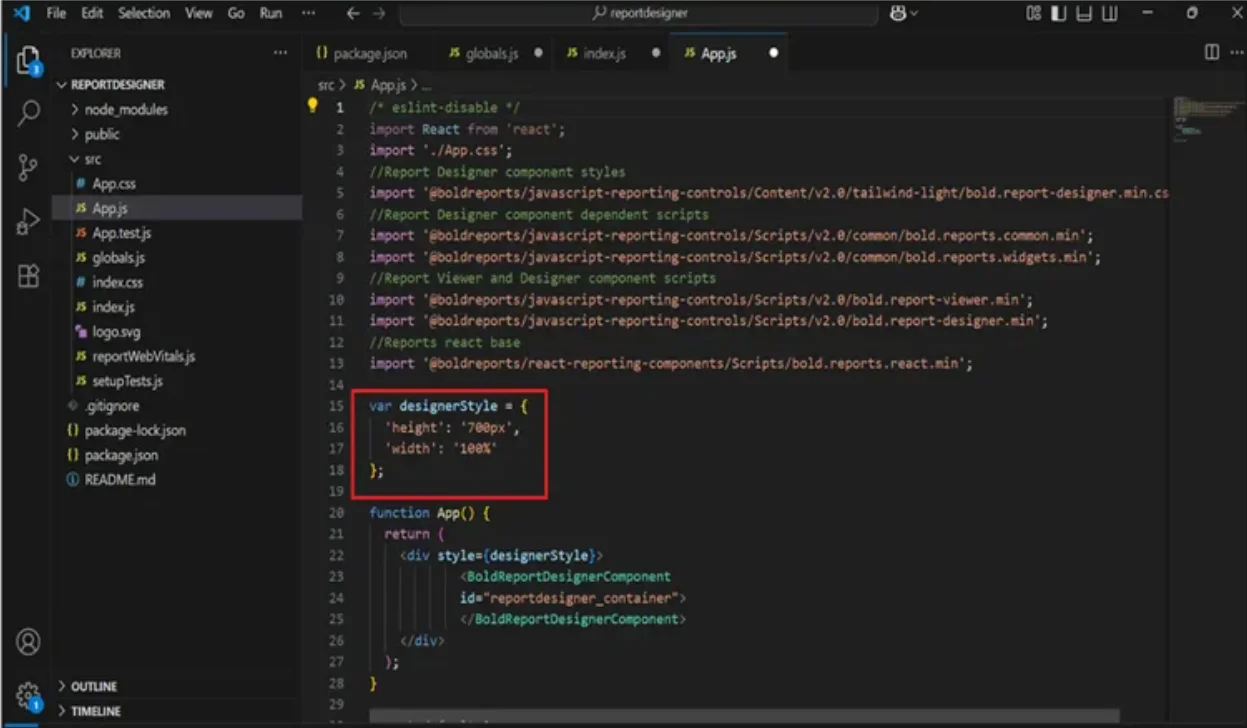
The Bold Report Designer script and style files need to be imported in order to run the Bold web designer. So, import the following files in the App.js file.
/* eslint-disable */
import React from 'react';
import './App.css';
//Report Designer component styles
import '@boldreports/javascript-reporting-controls/Content/v2.0/tailwind-light/bold.report-designer.min.css';
//Report Designer component dependent scripts
import '@boldreports/javascript-reporting-controls/Scripts/v2.0/common/bold.reports.common.min';
import '@boldreports/javascript-reporting-controls/Scripts/v2.0/common/bold.reports.widgets.min';
//Report Viewer and Designer component scripts
import '@boldreports/javascript-reporting-controls/Scripts/v2.0/bold.report-viewer.min';
import '@boldreports/javascript-reporting-controls/Scripts/v2.0/bold.report-designer.min';
//Reports react base
import '@boldreports/react-reporting-components/Scripts/bold.reports.react.min';var designerStyle = {
'height': '700px',
'width': '100%'
};function App() {
return (
<div style={designerStyle}>
<BoldReportDesignerComponent
id="reportdesigner_container">
</BoldReportDesignerComponent>
</div>
);
}export default App;
Step 6: Create a Web API service
The web Report Designer requires a Web API service to process the data and file actions. You can skip this step and use our online Web API service at https://demos.boldreports.com/services/api/ReportingAPI to create, edit, and browse reports. Or create one of the following Web API services:
Step 7: Set a Web API service URL
To set a Web API service, open the App.js file and replace the existing code with the following code snippet.
/* eslint-disable */
import React from 'react';
import './App.css';
//Report Designer component styles
import '@boldreports/javascript-reporting-controls/Content/v2.0/tailwind-light/bold.report-designer.min.css';
//Report Designer component dependent scripts
import '@boldreports/javascript-reporting-controls/Scripts/v2.0/common/bold.reports.common.min';
import '@boldreports/javascript-reporting-controls/Scripts/v2.0/common/bold.reports.widgets.min';
//Report Viewer and Designer component scripts
import '@boldreports/javascript-reporting-controls/Scripts/v2.0/bold.report-viewer.min';
import '@boldreports/javascript-reporting-controls/Scripts/v2.0/bold.report-designer.min';
//Reports react base
import '@boldreports/react-reporting-components/Scripts/bold.reports.react.min';var designerStyle = {
'height': '700px',
'width': '100%'
};function App() {
return (
<div style={designerStyle} className="App">
<BoldReportDesignerComponent
id="reportdesigner_container"
serviceUrl={'https://demos.boldreports.com/services/api/ReportingAPI'}>
</BoldReportDesignerComponent>
</div>
);
}export default App;
In the previous code, the serviceUrl used is from the online URL. You can host the Bold Reports service in any Azure or AWS URL, or your own domain URL, and use it in the Report Designer. View the already-created Web API service in the Reporting Service GitHub location.
Step 8: Run the application
To run the application, run the following command in Command Prompt.
npm run start
While running the command, if you are getting an error like “The BoldReportDesignerComponent is not defined,” then you need to disable the eslint by adding the line /* eslint-disable */ at the top of App.js.
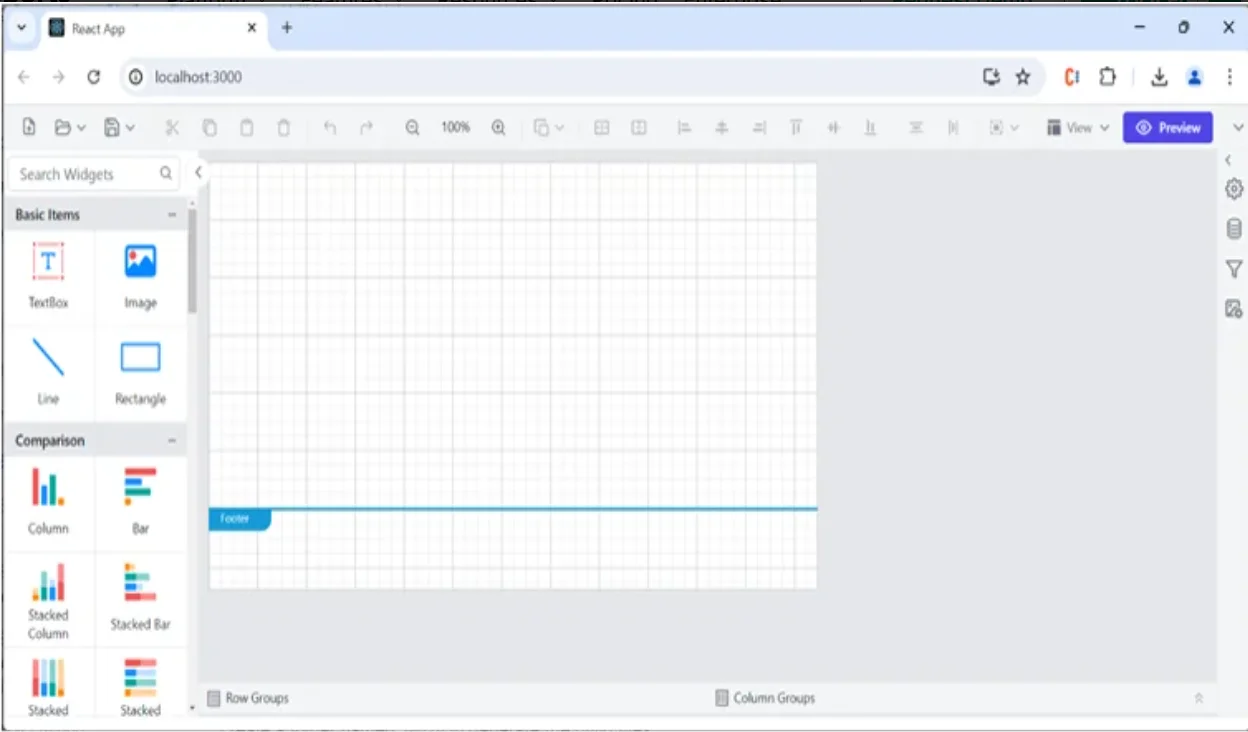
The npm run start command automatically opens your browser to http://localhost:3000/
Step 9: Deploying the application in production
To deploy the application in production, run the following command in Command Prompt. It will create a folder named build to generate the build files.
npm run build
Step 10: Saving reports
When users click Save in the embedded Report Designer, decide where the report definitions should live:
- Recommended (production): Save to the Bold Reports server repository for centralized governance, reuse, access control, and auditability.
- Alternative (development/demo): Save as a local definition (for example, RDL/RDLC), depending on configuration, and publish later to the server repository.
Best practice: Use a naming convention and permissions model (for example: /Tenant/<id>/Finance/Invoices) and restrict who can create, edit, and publish.
Common embedded reporting use cases
Operational reporting
Operational reporting supports application workflows where users need structured, print-ready documents generated on demand.
Examples:
-
- Invoices and receipts
- Order summaries
- Account statements
With Bold Reports, these documents are generated through the Reporting API and delivered in the React application through the Report Viewer. Server-side processing ensures consistent pagination, layout, and export-ready output for all user interactions.
Financial reporting
Financial reporting requires accuracy, consistent formatting, and dependable exports.
Examples:
-
- Profit and loss statements
- Revenue and expense reports
- Periodic financial summaries
Bold Reports handles calculations, grouping, and layout on the server, delivering uniform results in the Viewer and exported formats such as PDF, Excel, and Word. This consistency is essential for audit readiness and stakeholder reporting.
Compliance and audit reporting
Compliance reporting requires controlled access, traceability, and standardized output.
Examples:
-
- Audit trails
- Regulatory reports
- Access and activity logs
With Bold Reports, reports are processed securely on the server and governed through role-based access control. Access, parameters, and exports are restricted based on defined user roles and permissions.
Customer-facing reporting in SaaS applications
Customer-facing reporting enables users to access data scoped to their account within a multitenant environment.
Examples:
-
- Usage and subscription reports
- Billing and invoice history
- Performance summaries
Using tenant-aware parameters and secure reporting API endpoints, Bold Reports embeds these reports directly into React applications. Users can view and export reports through the React Report Viewer while maintaining strict data isolation.
Troubleshooting Bold Reports common issues and fixes
Even with a correctly configured setup, you may encounter issues related to authentication, API connectivity, report configuration, or exporting. This table outlines some of the most common embedded reporting issues in React applications and how to resolve them.
| Issue | Likely Cause | Fix |
| Blank Report Viewer or Report Designer | Missing or incompatible Bold Reports assets. | Verify CSS and JavaScript files match your installed package version. |
| CORS errors | Reporting API blocks requests from your React app. | Allow your application origin or use a back-end proxy. |
| 401/403 errors | Authentication or permissions issue. | Verify authentication and role-based access controls (RBAC). |
| Report not found | Incorrect report path or repository location. | Confirm the report exists and the user has access. |
| Incorrect report data | Invalid or missing report parameters. | Validate parameter names, values, and data types. |
| Slow report rendering | Large datasets or inefficient queries. | Optimize queries and reduce unnecessary data retrieval. |
| Export failures | Export permissions or server configuration issue. | Verify export settings and server-side permissions. |
Conclusion
Embedded reporting in React is more than a technical enhancement. It is a strategic capability that helps organizations deliver greater value within their applications. By providing users with access to paginated, export-ready reports directly within existing workflows, apps can reduce manual processes, improve operational efficiency, support compliance requirements, and enable faster decision-making.
With Bold Reports, organizations can deliver secure, scalable reporting experiences through the React Report Viewer and React Report Designer while maintaining centralized control over report creation, access, and distribution. This combination of governed authoring, reliable exports, and multitenant support makes it easier to meet growing reporting demands without increasing development complexity.
Whether you’re building customer-facing SaaS applications, internal business systems, or enterprise reporting solutions, Bold Reports helps transform reporting from a standalone function into a core product capability that improves user adoption, increases productivity, and supports data-driven decision-making. Start a free trial to explore these capabilities with your own data or request a personalized demo to see how Bold Reports can support your reporting requirements.
Frequently asked questions
- 1.
How do I embed paginated reports in a React app?
Embed the Bold Reports Report Viewer in a React route and configure the Reporting API service URL, report path, and optional parameters.
- 2.
Can I export to PDF or Excel format from embedded reports?
Yes, Bold Reports generates exports (PDF/Excel/Word) on the server through the Reporting API.
- 3.
How do I secure embedded reporting for SaaS and multitenant apps?
Use authentication and RBAC to control access to reports and restrict use of the Designer to admins. Enforce tenant scoping using tenant-specific report paths and/or validated tenant parameters on the server.
- 4.
What’s the difference between a report viewer and a report designer?
A report viewer lets end users to view, paginate, and export reports. A report designer is for creating and editing report definitions and should be limited to admin roles.
- 5.
When should I use dashboards instead?
Use dashboards for interactive exploration (filters, drill-down, and ad-hoc analysis). Use embedded reporting for paginated, print-ready documents that must remain consistent when exported.
- 6.
Do I need to build a custom reporting back end to embed reporting in React?
No Bold Reports provides server-side rendering and export services via the Reporting API plus embeddable viewer and designer components. You don’t need to build your own pagination, layout, or export infrastructure.






