
SSRS Expressions Cheat Sheet: 50+ Formulas for 2026
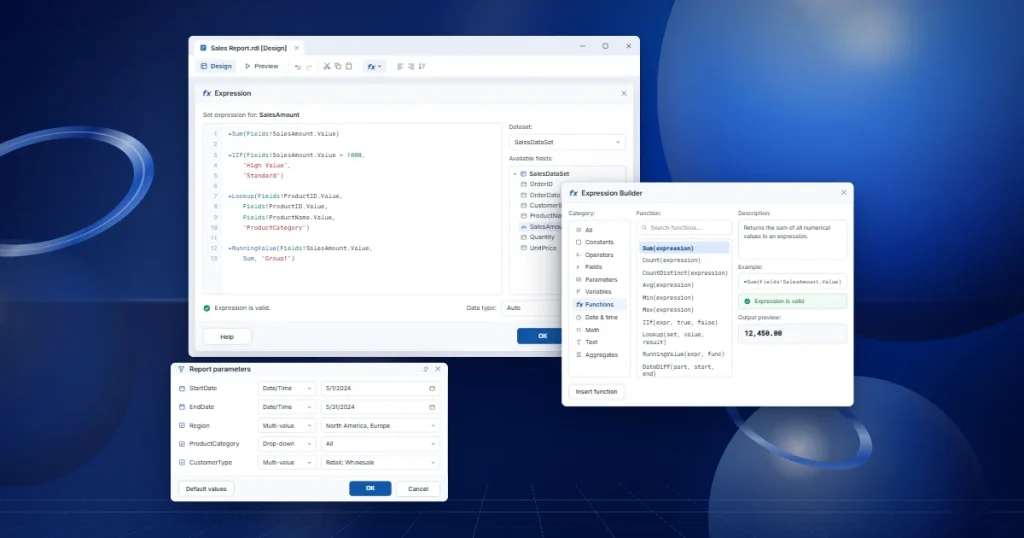
TL;DR:
SSRS expressions are the Visual Basic–based formulas that power calculations, conditional formatting, data visibility, and dynamic text inside SQL Server Reporting Services and RDL-based reports.
Introduction
Every dynamic report, from a simple invoice total to a multipage financial statement with conditional highlighting, depends on SSRS expressions. They are the logic layer that sits between raw data and the polished report a business user actually sees. Total a column, format a currency value, hide a row based on a parameter, flag an overdue invoice in red; all of it runs through expressions.
That’s exactly why SSRS expressions is still one of the most frequently searched topics in enterprise reporting in 2026. SQL Server Reporting Services remains deeply embedded in finance, healthcare, insurance, government, and manufacturing environments. SSRS still powers enterprise reporting for organizations that depend on pixel-perfect, paginated, and scheduled reports, even as they evaluate modern BI and embedded reporting alternatives. Report designers, business analysts, and developers working inside those environments need fast, accurate answers to practical questions:
How do I calculate a percentage of group total? How do I avoid a divide-by-zero error? What’s the correct syntax for a nested IIf? How do I reference a variable defined at the group level?
Three trends are keeping SSRS expressions, SSRS formulas, and SSRS functions at the center of report development in 2026:
-
- RDL reports remain a durable, portable format: RDL-based reporting is shared across SSRS, Report Builder, and RDL-compatible platforms like Bold Reports®, which means expression skills transfer directly across tools rather than becoming obsolete.
- Report logic keeps growing in complexity: As reports absorb more business rules, including tiered pricing, multicondition visibility, and cross-dataset lookups, designers need a reliable SSRS expression builder reference rather than re-deriving syntax from scratch each time.
- Modernization and migration projects put expressions under the microscope: Teams auditing, refactoring, or migrating RDL expressions as part of a broader reporting strategy need a clear map of what each expression does, where it’s evaluated, and how to reproduce it safely in a new environment.
This guide is built to serve all three needs: a SSRS expressions cheat sheet for day-to-day report building, a fundamentals section for anyone ramping up on SQL Server Reporting Services expressions, and a troubleshooting reference for the errors that slow report development down the most.
SSRS expressions fundamentals: Syntax, scope, and evaluation logic
Before jumping into the cheat sheet, it’s worth looking at how SSRS expressions actually work. This context makes every formula easier to adapt and debug.
Basic syntax structure: Every SSRS expression is written in Visual Basic (VB) syntax and, with rare exceptions (like custom code blocks), must start with an equals sign (=). A basic expression looks like:
=Fields!SalesAmount.Value |
More complex expressions combine collections, functions, and operators:
=IIf(Fields!SalesAmount.Value > 1000, "High Value", "Standard") |
Key built-in collections: Almost every expression references one of these collections.
| Collection | Purpose | Example |
| Fields! | Access a field from the current dataset row. | Fields!ProductName.Value |
| Parameters! | Access a report parameter value. | Parameters!StartDate.Value |
| Variables! | Access a report- or group-scoped variable. | Variables!GroupTotal.Value |
| Globals! | Access report-wide system values (page number, report name, execution time). | Globals!PageNumber |
| User! | Access the current user context. | User!UserID |
| ReportItems! | Reference another text box’s rendered value on the same page. | ReportItems!TextBox1.Value |
Expression scope: Scope determines what data an expression can see when it runs. SSRS evaluates expressions at different levels:
-
- Report level: Global values, report parameters, report-level variables.
- Group level: Aggregates and variables scoped to a specific group (e.g., Sum() within a “Region” group).
- Dataset or row level: Field values for the current row being rendered.
- Data region level: Aggregates scoped to a table, matrix, chart, or list (e.g., RowNumber(Nothing) vs. RowNumber(“DataSetName”)).
Getting the scope wrong is the single most common source of SSRS expression errors. For example, calling Sum(Fields!Amount.Value) inside a text box that sits outside a data region will fail because there’s no implicit dataset context to aggregate over.
Evaluation logic and order: SSRS evaluates expressions in a defined order during report processing: parameters first, then queries and datasets, then report variables, then group and data-region aggregates, and finally item-level expressions during rendering. This matters because an expression can’t reliably reference something that hasn’t been evaluated, yet a report variable can’t depend on a group variable that’s scoped to a group processed later in the pipeline.
Report variables: Variables (defined at the report or group level via the Report > Report Properties > Variables dialog, or group properties) let you calculate a value once and reuse it across multiple expressions. This is useful for values like a grand total, a formatted date range, or a running flag. Reference them with Variables!VariableName.Value.
Commonly used function families: Most SSRS functions fall into a handful of families you’ll use repeatedly: aggregate functions (Sum, Avg, Count), conditional functions (IIf, Switch, Choose), string functions (UCase, Trim, Replace, InStr), date functions (Format, DateAdd, DateDiff, Now), and navigation functions (RowNumber, RunningValue, Lookup, Rank). The following cheat sheet is organized around these families.
Comparison table: Core SSRS expression capabilities
| Expression Family | Primary Purpose | Typical Scope | Complexity | Performance Impact | Best Suited For |
| Aggregate functions
(Sum, Avg, Count, Max, Min) |
Summarize field values across a dataset, group, or region. | Group/data region | Low | Low–moderate (grows with dataset size) | Tables, matrices, charts, gauges |
| Conditional functions
(IIf, Switch, Choose) |
Branch logic and conditional formatting. | Row/item level | Low–Moderate | Low | Text boxes, formatting, visibility rules |
| String functions
(UCase, Replace, InStr, Trim) |
Manipulate and validate text values. | Row/item level | Low | Low | Labels, concatenated fields, search logic |
| Date/time functions
(Format, DateAdd, DateDiff, Now) |
Format, calculate, and compare dates. | Row/report level | Low–Moderate | Low | Headers, date filters, period comparisons |
| Navigation and ranking
(RowNumber, RunningValue, Rank, Lookup) |
Reference position, running totals, or cross-dataset values. | Data region/cross-dataset | Moderate–High | Moderate (Lookup scans can be costly on large datasets) | Alternating rows, running totals, drill lookups |
| Custom code
(Code.FunctionName) |
Reusable logic beyond built-in functions. | Report level | High | Depends on implementation | Complex business rules, shared logic across reports |
| Report/group variables
(Variables!) |
Cache a calculated value for reuse. | Report/group level | Moderate | Low (calculated once) | Grand totals, flags, precomputed values |
The SSRS expressions cheat sheet: 2026 edition
Following is a categorized, example-driven reference covering the most frequently used SSRS expressions, SSRS formulas, and SSRS functions, each with a business scenario, expected output, and practical tips.
1. Aggregate expressions
Aggregate expressions summarize data across rows, groups, or datasets, the backbone of nearly every summary report, KPI card, and financial statement.
| Expression | Example | Business Scenario | Expected Output | Tip/Troubleshooting |
| Sum | =Sum(Fields!SalesAmount.Value) | Total sales per region group in a tablix. | [10, 20, 20] → 50 | Use the dataset-name overload,
=Sum(Fields!SalesAmount.Value, “Sales”) in text boxes and images outside a data region, since they do not inherit dataset context. |
| Average | =Avg(Fields!UnitPrice.Value) | Average order value per customer. | [10, 20, 20, 30] → 20 | Combine with Format() for display:
=Format(Avg(Fields!UnitPrice.Value), “N2”). |
| Max/Min | =Max(Fields!SalesAmount.Value) / =Min(Fields!Quantity.Value) | Highest and lowest sales in a period. | [10, 20, 20, 30] → Max: 30, Min: 10 | Pair with conditional formatting to flag outliers automatically. |
| First/Last | =First(Fields!ProductName.Value) / =Last(Fields!ProductName.Value) | Show the first and last product in a sorted list without a separate query. | [Bike, Cloth, Accessories, Component] → First: Bike, Last: Component | Sort order in the dataset or tablix directly affects the result. Verify sorting before relying on these. |
| Count/CountDistinct | =Count(Fields!ProductName.Value) / =CountDistinct(Fields!ProductName.Value) | Count total line items versus unique products sold. | [Bike, Cloth, Accessories, Component, Bike] → Count: 5, CountDistinct: 4 | Count includes duplicates; use CountDistinct for unique-value KPIs like active customers. |
| StDev/Variance (new) | =StDev(Fields!SalesAmount.Value) | Measure sales volatility for a region. | [10, 30, 20] → Result: 10 | Useful for statistical/QA reports; combine with Avg() to build simple variance dashboards. |
| RunningValue (aggregate) (new) | =RunningValue(Fields!SalesAmount.Value, Sum, “SalesDataSet”) | Running total column next to each row in a sales table. | Row-by-row cumulative sum | The third parameter (scope) is required. Omitting it or using the wrong scope is a common cause of incorrect running totals. |
| CountRows | =CountRows(“SalesDataSet”) | Display total records returned by a dataset. | Dataset contains 125 rows → 125 | Useful for summary cards and row-count validation. |
| Sum with Scope | =Sum(Fields!SalesAmount.Value, “RegionGroup”) | Calculate totals within a specific group. | Region total revenue | Specify the correct group name or results may be misleading. |
| Conditional Sum | =Sum(IIf(Fields!Status.Value = “Closed”, 1, 0)) | Count closed transactions without changing the query. | Closed orders count | Useful for conditional aggregation directly within the report layer. |
| Aggregate by Scope | =Avg(Fields!SalesAmount.Value, “RegionGroup”) | Calculate average sales within a region. | Region average sales | Explicit scope helps avoid incorrect aggregate results in nested groups. |
| Count Non-Null Values | =Count(Fields!CustomerID.Value) | Count populated customer records. | Total customer records | Null values are excluded from
Count(). |
2. Formatting and date-time expressions
Formatting expressions control how values are displayed. They are critical for compliance documents, invoices, and any report where presentation consistency matters.
| Expression | Example | Business Scenario | Expected Output | Tip/Troubleshooting |
| IIf (conditional) | =IIf(Fields!Quantity.Value > 10, “High”, “Low”) | Flag high-volume orders in a fulfillment report. | Condition true → “High”; false → “Low” | IIf always evaluates both branches. Avoid expensive function calls (like Lookup) inside either branch, since both run regardless of the result. |
| Switch | =Switch(Fields!CategoryID.Value = 1, “Electronics”, Fields!CategoryID.Value = 2, “Clothing”) | Map numeric category codes to readable labels. | CategoryID = 1 → “Electronics” | Switch returns the first true match. Always add a final catch-all condition (e.g., True, “Other”) to avoid #Error on unmatched values. |
| Date formatting | =Format(Fields!OrderDate.Value, “dd/MM/yyyy”) | Standardize date display across a multinational report. | 6/13/2026 12:00:00 AM → 13/06/2026 | Use format strings consistent with your audience’s locale; consider FormatDateTime() for culture-aware formatting. |
| Now/Today | =Now() | Print report generation time stamp in the footer. | Current date and time | Use Today() (via =Format(Now(), “d”)) when you only need the date to avoid unnecessary time precision in printed reports. |
| Currency formatting | =”Total Revenue: $” & Format(Fields!Revenue.Value, “N2”) | Display formatted currency totals in an executive summary. | 5000.5 → “Total Revenue: $5,000.50” | Use FormatCurrency() for locale-aware currency symbols instead of hardcoding “$” in multinational reports. |
| DateDiff (new) | =DateDiff(DateInterval.Day, Fields!OrderDate.Value, Fields!ShipDate.Value) | Calculate fulfillment lead time per order. | OrderDate: 6/1, ShipDate: 6/4 → 3 | Watch for null ShipDate values on unshipped orders, wrap with IIf(IsNothing(…), “Pending”, DateDiff(…)). |
| DateAdd (new) | =DateAdd(DateInterval.Month, 3, Fields!InvoiceDate.Value) | Calculate a quarterly follow-up date from an invoice date. | InvoiceDate: 1/15/2026 → 4/15/2026 | Combine with parameters for dynamic reporting windows: =DateAdd(DateInterval.Day, -Parameters!LookbackDays.Value, Today()). |
| Year
|
=Year(Fields!OrderDate.Value) | Extract reporting year. | 2026 | Commonly used for yearly grouping and filtering. |
| Month | =Month(Fields!OrderDate.Value) | Extract numeric month. | 6 | Useful for month-based analysis. |
| MonthName | =MonthName(Month(Fields!OrderDate.Value)) | Display month names in reports. | June | Improves readability compared to numeric months. |
| FormatDateTime | =FormatDateTime(Fields!OrderDate.Value, DateFormat.ShortDate) | Standardize date presentation. | 6/15/2026 | Uses regional formatting settings automatically. |
3. String and text expressions
String expressions clean, combine, and transform text values. They are commonly used for labels, search filters, and standardized output.
| Expression | Example | Business Scenario | Expected Output | Tip/Troubleshooting |
| Uppercase/Lowercase | =UCase(Fields!ProductName.Value) / =Lower(Fields!ProductName.Value) | Standardize product codes for a compliance export | “example” → “EXAMPLE” | Apply consistently at the dataset level (via a calculated field) if the same transformation is needed across multiple reports. |
| Concatenation | =Fields!FirstName.Value & ” ” & Fields!LastName.Value | Build a full-name display column | “John”, “Doe” → “John Doe” | Guard against nulls in either field:
=IIf(IsNothing(Fields!FirstName.Value), “”, Fields!FirstName.Value) & ” ” & … |
| Replace | =Replace(Fields!FirstName.Value, “James”, “John”) | Normalize legacy data values during report display | “Change old name.” → “Change new name.” | Replace is case-sensitive by default. Use Replace(LCase(…), LCase(“old”), “new”) for case-insensitive matching. |
| InStr | =InStr(Fields!Description.Value, “keyword”) > 0 | Highlight rows containing a flagged keyword | Returns True/False | Combine with IIf for conditional formatting:
=IIf(InStr(Fields!Description.Value, “urgent”) > 0, “Red”, “Black”). |
| Trim / Left / Right (new) | =Trim(Fields!CustomerCode.Value) / =Left(Fields!SKU.Value, 3) | Clean whitespace from imported data; extract SKU prefixes for grouping | ” ABC123 ” → “ABC123”; “ABC-1001” → “ABC” | Run Trim() on any field sourced from flat-file or Excel imports. Trailing spaces are a frequent cause of failed grouping. |
| Len | =Len(Fields!ProductCode.Value) | Validate product-code length | “ABC123” → 6 | Useful for data-quality validation. |
| Mid | =Mid(Fields!SKU.Value,4,3)
|
Extract part of a SKU
|
“ABC1001” → “100” | Character positions begin at 1.
|
| Split | =Split(Fields!Email.Value,”@”)(0) | Extract username from an email address | john.doe | Useful when values contain delimiters. |
4. Null handling, logic & data-type expressions
These expressions protect reports from the most common runtime errors such as nulls, type mismatches, and invalid numeric operations.
| Expression | Example | Business Scenario | Expected Output | Tip and Troubleshooting |
| IsNothing | =IIf(IsNothing(Fields!ProductName.Value), “N/A”, Fields!ProductName.Value) | Display a fallback value for missing product data. | Null → “N/A”; otherwise, actual value. | Always check IsNothing before calling other functions on the same field to prevent cascading #Error values. |
| Handling divide-by-zero | =IIf(Fields!Denominator.Value = 0, 0, Fields!Numerator.Value / Fields!Denominator.Value) | Calculate a ratio (e.g., conversion rate) safely. | Denominator 0 → 0; otherwise, the division result. | IIf evaluates both branches, so a true divide-by-zero can still throw before the condition saves you. Use nested IIf with IsNothing first or move the guard into a calculated field/SQL CASE for guaranteed safety. |
| Data type conversion (new) | =CDbl(Fields!AmountText.Value) | Convert a text-formatted numeric field for calculation. | “1500.50” (String) → 1500.5 (Double) | Wrap conversions with IsNumeric() first:
=IIf(IsNumeric(Fields!AmountText.Value), CDbl(Fields!AmountText.Value), 0) to avoid #Error on malformed source data. |
| ISNumeric validation (new) | =IIf(IsNumeric(Fields!InputValue.Value), “Valid”, “Invalid”) | Validate imported data quality before calculation. | Numeric input → “Valid” | Use in a data-quality/exception report to flag rows that will fail downstream calculations. |
| Nested IIf | =IIf(Fields!Value.Value > 10, “High”, IIf(Fields!Value.Value > 5, “Medium”, “Low”)) | Tier a value into High/Medium/Low bands. | Value = 7 → “Medium” | Beyond two or three levels, Switch is more readable and easier to debug than deeply nested IIf statements. |
| Choose | =Choose(Fields!Priority.Value,”Low”,”Medium”,”High”) | Convert priority codes to labels. | 2 → Medium | Simpler than nested IIf for ordered mappings. |
| CBool | =CBool(Fields!IsActive.Value) | Convert values into Boolean format. | True | Common in visibility expressions. |
| CDate | =CDate(Fields!DateText.Value) | Convert text into dates. | Date value | Validate using IsDate() before conversion. |
| CInt | =CInt(Fields!QuantityText.Value) | Convert text into integers. | 10 | Invalid values generate #Error. |
5. Navigation, ranking, and lookup expressions
These expressions reference position, cross-dataset values, and computed rank. They are essential for layout logic and for cross-referencing data without redundant queries.
| Expression | Example | Business Scenario | Expected Output | Tip / Troubleshooting |
| Row Number/alternating rows | =IIf(RowNumber(Nothing) Mod 2 = 0, “LightGrey”, “White”) | Improve readability of a dense data table. | Every second row → light grey background | Use RowNumber(“DataSetName”) instead of Nothing when the expression lives outside the data region it should count within. |
| Page Number / Total Pages | =Globals!PageNumber & ” of ” & Globals!TotalPages | Standard footer pagination for print/export. | e.g., “3 of 12” | TotalPages requires SSRS to fully render the report first. It can behave unexpectedly with certain interactive/streaming rendering modes. |
| Ranking | =Rank(Fields!SalesAmount.Value) | Rank sales reps within a leaderboard report. | [15, 20, 10, 25, 15] → [2, 3, 1, 4, 2] (default ascending logic varies by ties) | Sort the tablix by the same field used in Rank() so the visual order matches the computed rank. |
| Lookup | =Lookup(Fields!ID.Value, Fields!ID.Value, Fields!Name.Value, “Dataset2”) | Pull a customer name from a lookup dataset without a JOIN in the main query. | Matches ID across datasets and returns Name | Lookup returns only the first match. Use LookupSet() when multiple matches are possible and you need all of them. |
| CEILING (quarter calculation) | =CEILING(Month(Fields!Date.Value) / 3) | Group transactions into fiscal quarters. | June 15, 2026 → 2 (Q2) | Adjust for non-calendar fiscal years by offsetting the month value before dividing, e.g., shifting a July-start fiscal year. |
| Previous | =Previous(Fields!SalesAmount.Value) | Compare against the previous row. | Previous row value | Ensure the dataset is sorted correctly. |
| LookupSet | =LookupSet(Fields!CustomerID.Value, Fields!CustomerID.Value, Fields!OrderID.Value, “Orders”) | Return multiple matching values from another dataset. | Array of order IDs | Unlike Lookup(), all matches are returned. |
| RowNumber (Group) | =RowNumber(“RegionGroup”) | Number rows within a group. | 1, 2, 3… | Resets automatically when the group changes. |
6. Custom code and parameter-handling expressions
Custom code and parameter expressions extend SSRS beyond built-in functions. They are useful when the same logic needs to be reused across a report or when handling multivalue parameters.
| Expression | Example | Business Scenario | Expected Output | Tip / Troubleshooting |
| Custom Code | =Code.MyFunction(Fields!Value.Value) | Apply a shared validation or calculation rule to many text boxes. | Executes MyFunction from the report’s Code tab | Keep custom code functions small and pure (no external I/O). SSRS custom code runs in a restricted sandbox and does not support arbitrary external calls. |
| Group Variables | =Variables!GroupTotal.Value | Reuse a calculated group total in a header and a footer without recalculating. | e.g., 10,000 | Report-level variables cannot reference group-level variables that have not been evaluated yet. Check the evaluation order if you get unexpected #Error results. |
| String Manipulation (VbStrConv) | =StrConv(Fields!Text.Value, VbStrConv.UpperCase) | Normalize casing when source systems mix formats. | “example” → “EXAMPLE” | Prefer VbStrConv over chained string functions when applying multiple case rules (title case, uppercase) for readability. |
| Multivalue parameter handling | =Join(Parameters!SelectedValues.Value, “, “) | Display all selected filter values in a report subtitle. | [“Value1”, “Value2”, “Value3”] → “Value1, Value2, Value3” | Use Join for display. Use Parameters!X.Value directly (without Join) inside a query filter, since the query engine expects the array, not a string. |
| Dynamic image path | =”~/Images/” & Fields!ProductCode.Value & “.jpg” | Render product images dynamically by code. | “ABC123” → “~/Images/ABC123.jpg” | Confirm the image resource/embedded path resolves correctly in both preview and deployed/exported (PDF) output. Path resolution can differ between environments. |
| Parameter Label | =Parameters!Region.Label | Display selected parameter labels. | East Region | More readable than displaying parameter values. |
| Parameter Count | =Parameters!Region.Count | Count selected parameter values. | 3 | Useful with multivalue parameters. |
| Globals!ExecutionTime | =Globals!ExecutionTime | Show report execution time stamp. | Current date and time | Useful in audit and compliance reports. |
7. Business-scenario expressions
These composite expressions combine multiple of the previous techniques to solve recurring, real-world report requirements.
| Expression | Example | Business Scenario | Expected Output | Tip / Troubleshooting |
| Conditional title by parameter | =IIf(Parameters!SalesType.Value = “Revenue”, “Revenue Report”, “Quantity Report”) | Reuse one report definition for two report modes. | SalesType = “Revenue” → “Revenue Report” | Great for reducing report sprawl. One RDL, multiple presentation modes driven by a single parameter. |
| Percentage of group total | =(Sum(Fields!Total.Value) / Sum(Fields!Total.Value, “GroupName”)) * 100 | Show each product’s contribution to category revenue. | 500/(500+750+1000) = 22.22% | Confirm the second sum argument matches the correct dataset/group name. A mismatch can return an incorrect percentage rather than an error. |
| Dynamic column visibility | =IIf(Parameters!ShowColumn.Value = “True”, False, True) | Let users toggle optional columns on/off. | Parameter True → column visible | Bind the Hidden property of the column, not a text box inside it, or the layout will leave an empty gap. |
| Custom sorting via Switch | =Switch(Fields!Category.Value = “A”, 1, Fields!Category.Value = “B”, 2, Fields!Category.Value = “C”, 3) | Sort categories in business-defined (not alphabetical) order. | “B” → 2 | Add this as a hidden sort-key column/expression on the tablix sort, not as a visible field. |
| Conditional drill-through | =IIf(Fields!Category.Value = “Sales”, “SalesReport”, “InventoryReport”) | Route users to different detailed reports from one summary row. | “Sales” → navigates to SalesReport | Verify the target report path matches your deployment folder structure exactly. Drillthrough failures are often caused by a path mismatch. |
| Period-over-period change | =Sum(Fields!Value.Value) / Previous(Sum(Fields!Value.Value)) – 1 | Compare current vs. prior time period sales in a trend report. | Current $10,000, prior $8,000 → 0.25 (25%) | Previous() requires the report to be grouped/sorted by the period field. Without it, the previous row may not be what you expect. |
| Traffic-light KPI | =IIf(Fields!Score.Value>=90,”Green”,IIf(Fields!Score.Value>=70,”Yellow”,”Red”)) | KPI logic. | Green/Yellow/Red | Common in dashboards and scorecards. |
| Dynamic report header | =”Sales Report – ” & Parameters!Region.Label | Build parameter-driven headers. | Sales Report – East Region | Adds context to exported reports. |
| SLA breach indicator | =IIf(DateDiff(DateInterval.Day,Fields!CreatedDate.Value,Today())>7,”Overdue”,”On Time”) | Monitor service-level compliance. | Overdue | Valuable in support and operations reporting. |
| No records message | =IIf(CountRows(“SalesDataSet”)=0,”No records found”,””) | Display a message when no data exists. | No records found | Improves report usability for filtered datasets. |
How to choose the right SSRS expression approach
Not every calculation belongs in an inline expression. Choosing the right layer for your logic, whether an expression, query, calculated field, parameter, custom code, or dataset-level aggregation, has a direct impact on report performance, maintainability, and how easy the report is to debug later.
| Approach | Best When | Pros | Cons | Example |
| Inline expression | Logic is display-only or specific to one report item. | Fast to write; no query changes needed; visible directly in the report designer. | Can be duplicated across text boxes; harder to reuse across reports. | =IIf(Fields!Qty.Value > 10, “High”, “Low”) |
| SQL query logic | Logic should run once, at the source, for performance and consistency. | Executes efficiently in the database; consistent across every report using the query; easier to index and optimize. | Requires query or stored procedure access; less visible to report designers. | CASE WHEN Qty > 10 THEN ‘High’ ELSE ‘Low’ END |
| Calculated field (dataset) | Logic is reused across many text boxes/expressions within one report. | Defined once, referenced like any other field; keeps expressions clean. | Scoped to a single dataset; still evaluated at report-processing time, not in the database. | Add QtyTier as a calculated field referencing the same IIf logic. |
| Parameter | The value should be user-selectable or environment-specific. | Enables self-service filtering without editing the report; reusable across sessions. | Requires parameter UI design and validation. | Parameters!Threshold.Value
used inside a comparison expression. |
| Custom code (VB) | The same complex logic is needed in many places within one report, or it exceeds what built-in functions support. | Centralizes logic; easier to test in isolation; supports more complex branching and loops. | Runs in a sandboxed environment; harder for nondevelopers to maintain. | Code.ClassifyRevenue(Fields!Revenue.Value) |
| Dataset-level calculation/aggregation | Data needs grouping, joining, or aggregating before it reaches the report layer. | Reduces report-layer complexity; leverages the query engine’s performance; supports complex joins/aggregation SQL/expressions cannot easily replicate. | Requires more upfront data modeling; changes require touching the dataset, not just the report canvas. | A pre-aggregated MonthlySalesSummary dataset instead of aggregating raw transactions in-report. |
Decision framework:
-
- Is the logic purely presentational, such as color, formatting, or label text? Use an inline expression.
- Does the same calculation need to be used across multiple reports or queries? Implement it in SQL or a stored procedure.
- Is the same logic repeated throughout a report? Move it to a calculated field.
- Should users be able to control the value or behavior? Use a parameter.
- Does the logic go beyond what built-in functions can handle, such as multibranch conditions or logic reused across several expressions? Use custom code.
- Does the data need to be joined, grouped, or aggregated before the report is rendered? Handle it at the dataset level.
.png)
Common SSRS expression issues and troubleshooting
Even well-written SSRS expressions fail in predictable ways. Here’s how to diagnose and resolve the most common issues.
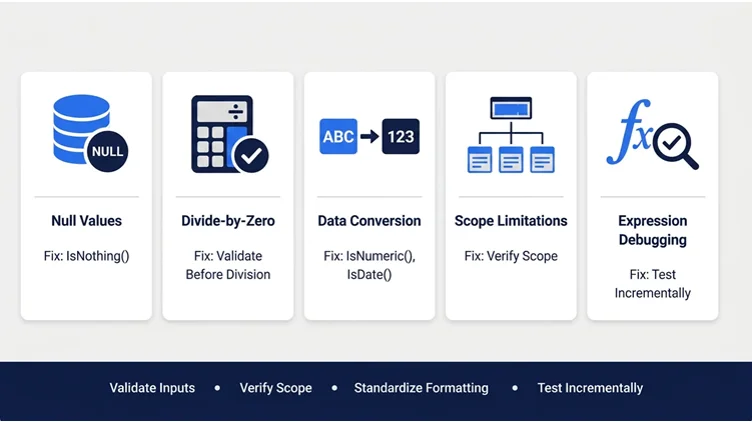
Null handling errors: A field or parameter with no value (Nothing in VB terms) will break string concatenation, math operations, and function calls that don’t expect it. Always check with IsNothing() before operating on a field that can be null and decide on a consistent fallback (“N/A”, 0, blank) for the report.
Divide-by-zero errors: SSRS returns #Error (or +Infinity/NaN in some rendering contexts) when a denominator is zero. The safest pattern checks the denominator first:
=IIf(Fields!Denominator.Value = 0, 0, Fields!Numerator.Value / Fields!Denominator.Value) |
Remember that IIf evaluates both branches in some engines and edge cases. For guaranteed safety on production-critical calculations, move the guard into the dataset query (
CASE WHEN Denominator = 0 THEN 0 ELSE Numerator/Denominator END |
) instead of relying solely on the report-level expression.
Formatting challenges. Mismatched locale settings, inconsistent number or date formats, and hardcoded currency symbols are common formatting issues, especially in multinational deployments. Standardize with the Format(), FormatCurrency(), and FormatDateTime() functions rather than manual string concatenation. Confirm the report’s Language property matches the intended output locale.
Data type conversion issues. Fields sourced from flat files, Excel imports, or loosely typed columns often arrive as strings when a number or date is expected. Validate before converting: IsNumeric() before CDbl()/CInt() and IsDate() before CDate(). Skipping validation is the most common cause of #Error in otherwise-correct expressions.
Scope limitations. Aggregate functions and variables are scoped to a specific level (dataset, group, or data region). The error “The Value expression for the text box … refers to the field … which is not contained in the referenced dataset” almost always means an expression is trying to use a field or aggregate that its current scope can’t see. Fix it by adding the correct dataset-name parameter (e.g., =Sum(Fields!Amount.Value, “Sales”)) or moving the expression into the correct data region.
Debugging best practices
-
- Test complex expressions incrementally. Build nested logic one condition at a time instead of writing the entire nested IIf/Switch expression at once.
- Use a temporary text box to display intermediate values, such as the raw field value or a partial calculation, while troubleshooting.
- Check the Report Data pane to confirm that you are referencing the correct dataset name. A small typo in a dataset-scoped aggregate can be difficult to spot and may lead to incorrect results.
- When expression logic becomes complex, start with a validated expression pattern and test it against representative sample data before deploying it to production.
- Maintain a personal or team library of validated expression patterns, such as this cheat sheet, to avoid repeatedly solving the same formatting, calculation, or null-handling scenarios.
Beyond the cheat sheet: SSRS expressions in your 2026 reporting strategy
Mastering SSRS expressions solves the day-to-day report-building problem, but expressions live inside a bigger picture: the health, scalability, and future direction of your overall SSRS environment.
If your organization is running SQL Server 2025 or planning an upgrade, it’s worth understanding what that means for your reporting roadmap. Microsoft’s reporting investment has increasingly shifted toward Power BI and Fabric, and while SSRS remains supported, teams with large RDL expression libraries should start thinking proactively. The SSRS migration guide for SQL Server 2025 walks through how to audit your report inventory, identify migration risks, and preserve existing expressions and business logic during a transition.
For teams evaluating whether to modernize in place or move to a different platform entirely, it also helps to see how the broader SSRS alternatives landscape has evolved. The best SSRS alternatives for modern reporting in 2026 compares embedding, deployment flexibility, and data-handling capabilities across the leading options, providing useful context before deciding whether your expression logic needs to be rebuilt, rehosted, or simply carried forward.
And if you’re not ready to migrate anything, that’s a valid and common position. SSRS continues to reliably power thousands of production reports, and SSRS still powers enterprise reporting precisely because of its stability, deep Microsoft ecosystem integration, and the sheer volume of embedded business logic, including expressions, already validated inside existing RDL files. The right move for most organizations is understanding your options so the decision, whenever you make it, is a deliberate one.
Conclusion
SSRS expressions remain one of the most practical, high-leverage skills in enterprise report development. A small set of syntax patterns unlocks an enormous range of calculation, formatting, and business-logic scenarios. The fundamentals, cheat sheet, decision framework, and troubleshooting guidance in this blog are designed to be your go-to reference in 2026 and beyond.
Want to build and test SSRS expressions faster? Try the free, AI-powered SSRS expression builder from Bold Reports or explore Bold Reports RDL-based reporting to see these same expression patterns running inside a modern, embeddable reporting platform. Have questions about a specific expression? Contact our team. We’re happy to help.
Frequently asked questions
-
- 1.
What is an SSRS expression?
An SSRS expression is a Visual Basic (VB)-based formula used inside SQL Server Reporting Services and RDL-based reports to calculate, format, or conditionally control how data is displayed. Expressions always begin with an equals sign (=) and typically reference the Fields!, Parameters!, Variables!, or Globals! collections.
- 2.
What is the correct SSRS expression syntax?
SSRS expressions use VB.NET syntax. A basic expression follows the pattern =Collection!Name.Property, such as =Fields!SalesAmount.Value, and can be combined with operators and functions. For example, =IIf(Fields!Quantity.Value > 10, “High”, “Low”) evaluates a condition and returns different values based on the result.
- 3.
What are the most commonly used SSRS functions?
The most frequently used SSRS functions include aggregate functions (Sum, Avg, Count, Max, Min), conditional functions (IIf, Switch), string functions (UCase, Replace, InStr), date functions (Format, DateDiff, DateAdd, Now), and navigation functions (RowNumber, RunningValue, Lookup, Rank).
- 4.
How do I write a conditional expression in SSRS?
Use IIf(condition, valueIfTrue, valueIfFalse) for a simple two-way condition, or Switch(condition1, value1, condition2, value2, …) when you have more than two possible outcomes. For deeply nested logic, Switch is usually more readable than stacking multiple IIf statements.
- 5.
How do I calculate a percentage of total in SSRS?
Divide a group-level or row-level sum by the total sum and multiply by 100 using =(Sum(Fields!Total.Value)/Sum(Fields!Total.Value, “GroupName”)) * 100. Make sure the dataset name in the denominator matches your intended scope.
- 6.
How do I handle null values in SSRS expressions?
Wrap the field with IsNothing() and provide a fallback value using =IIf(IsNothing(Fields!ProductName.Value), “N/A”, Fields!ProductName.Value). Always perform the null check before passing the field into another function to avoid cascading #Error results.
- 7.
What is the difference between an SSRS expression and a calculated field?
An expression is written directly on a report item, such as a text box, cell, or visibility property, and is evaluated at render time for that item. A calculated field is defined once at the dataset level and can be referenced like any other field across the entire report. This approach is useful when the same logic is needed in multiple places.
- 8.
Is there a tool that builds SSRS expressions automatically?
Yes. The free, AI-powered SSRS expression builder converts a plain-language description of your logic into a ready-to-use SSRS expression, with built-in testing against sample data, reducing manual syntax debugging.
- 1.






