
TL;DR:
Neither DevExpress nor Bold Reports® ships a .repx-to-RDL converter, so a DevExpress report migration is a rebuild. Inventory and tier reports, translate expressions with a mapping table, decide where scripts and event handlers go, validate against reference PDFs, and cut over in waves. Keep desktop-bound reports on DevExpress until there is a reason to move them.
Introduction
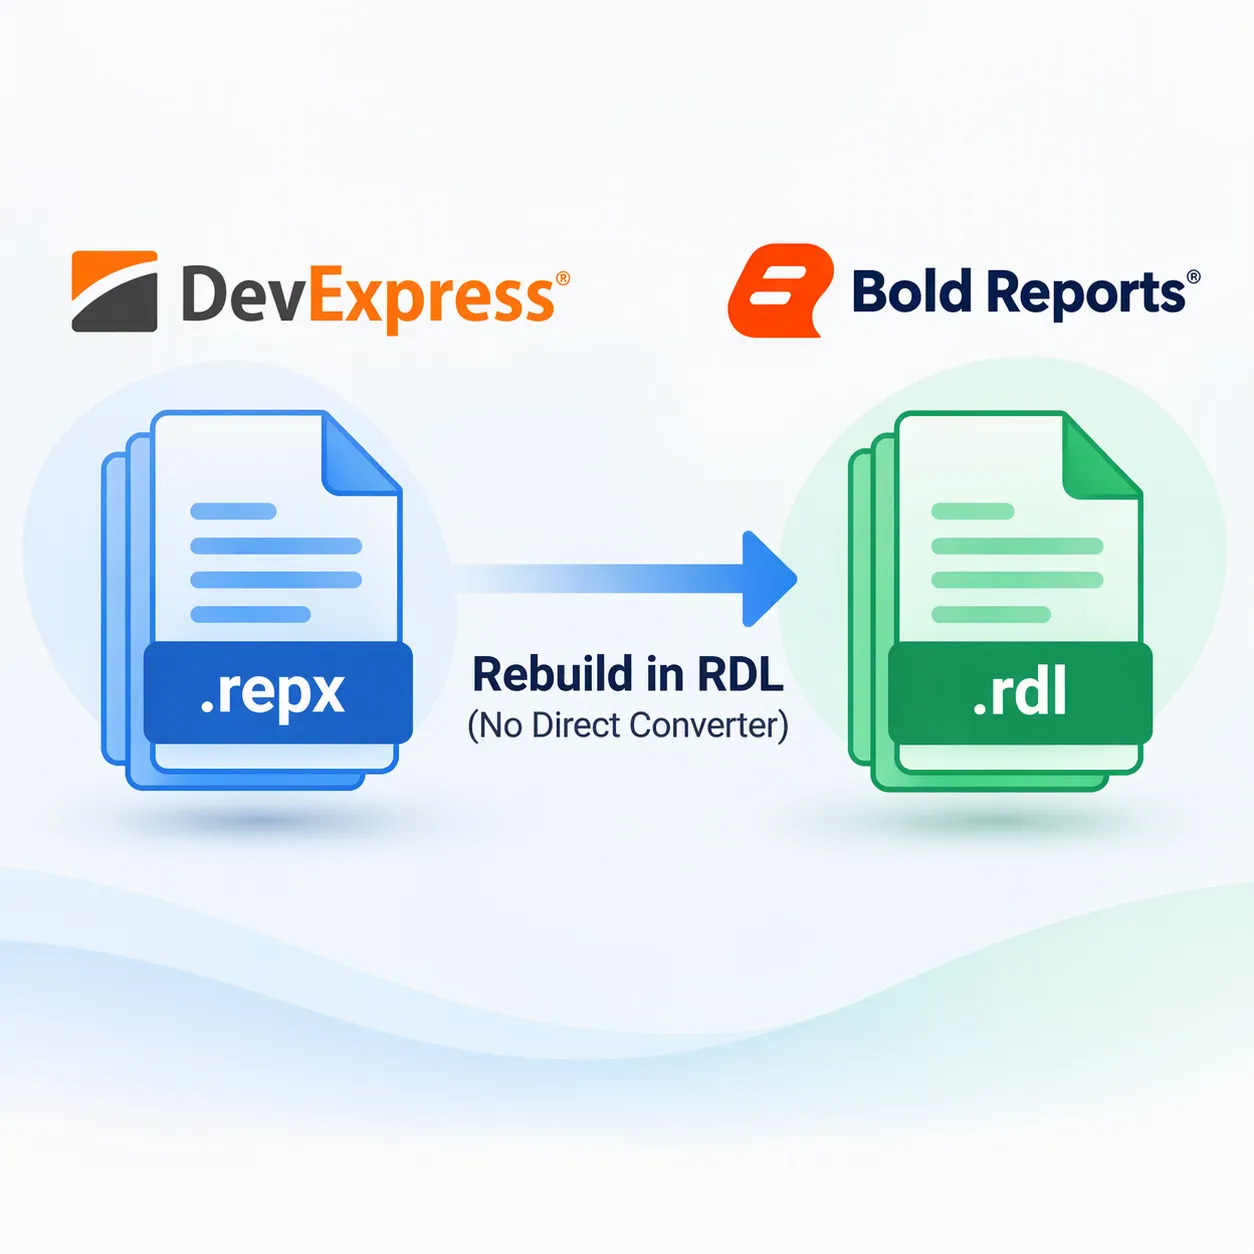
If you plan to migrate from DevExpress Reports to an RDL platform, expect to rebuild each report. DevExpress stores layouts as .repx files, and its import tooling works in the other direction: It reads RDL into .repx. Moving .repx to RDL therefore means recreating each layout, expression, and data binding in an RDL designer, then checking the output against the original.
This guide covers the execution: seven stages from inventory to cutover, verified mapping tables for controls, expressions, and data sources, decision paths for scripts and event handlers, and an effort model you fill in with your own pilot numbers. The examples use Bold Reports as the target. It is an embedded, pixel-perfect, paginated reporting platform built on RDL and RDLC.
Two other pages may be a better fit. If you are still deciding whether to switch, the licensing, platform, and deployment comparison is on the DevExpress Reports alternative page. If you only need to move DevExpress reports to a newer .NET version, follow DevExpress’s .NET migration guides.
When does a DevExpress report migration make sense?
A DevExpress report migration makes sense when your reports are delivered through web or SaaS applications, need central scheduling and permissions, or should live in RDL, the SSRS schema that other tools also read. It makes less sense when reports render mainly in WinForms, WPF, or .NET MAUI desktop and mobile apps.
Common drivers:
- Web and SaaS delivery. Reports are embedded in browser applications, often for many customers, and need white-labeled viewers.
- Central scheduling and governance. One server stores, secures, and schedules reports for several applications and teams.
- RDL as the report format. Definitions follow the published SSRS schema rather than a vendor-specific one.
- Licensing model. DevExpress Reports is licensed per developer with no floating licenses, while Bold Reports is not licensed per named user, viewer, or developer. The DevExpress Reports alternative page holds the full comparison, and the Bold Reports pricing page states the terms.
When DevExpress still fits
Some estates should stay where they are, in full or in part:
- Reports render mainly in WinForms, WPF, or .NET MAUI applications.
- Your existing DevExpress licensing and development workflow already fits the team.
- Developers prefer to build and maintain reports in Visual Studio, JetBrains Rider, or VS Code next to the application source.
For mixed estates, migrate web, embedded, and SaaS reports first, and leave desktop-bound reports on DevExpress until there is a reason to move them.
How do DevExpress Reports and RDL differ for a migration?
Four differences drive the rebuild effort: the report definition (.repx versus RDL), the layout model (bands versus data regions in a report body), the expression syntax (criteria language versus VB.NET-based RDL expressions), and where custom logic runs. Licensing and deployment shape the decision to move, but they do not change the work per report.
| Area | DevExpress Reports | Bold Reports (RDL) |
|---|---|---|
| Report definition | .repx (XML serialization) or a report class in C# or VB.NET; .NET applications accept only XML-serialized .repx | RDL (server) and RDLC (local) in the SSRS XML schema |
| Layout model | Bands (Report Header, Page Header, Group Header, Detail, Group Footer, Page Footer, Report Footer) holding controls | A report body of data regions (table, matrix, list, chart) with a page header and footer |
| Expression language | Criteria language: [Field], ?Param, Iif, summary functions such as sumSum |
VB.NET-based: =Fields!Field.Value, Parameters!Param.Value, IIf, Sum, RunningValue |
| Page variables | [Arguments.PageIndex] (zero-based) and [Arguments.PageCount], evaluated in the PrintOnPage event |
Globals!PageNumber (one-based) and Globals!TotalPages, usable only in the page header or footer |
| Custom logic | Expression bindings, report scripts (disabled by default), event handlers in code-behind, custom controls | Expressions, Code Module with VB custom code, custom assemblies where the server allows them, the data layer, or the host app |
| Data binding | Data source components (SqlDataSource, ObjectDataSource, and others) serialized into the .repx | Data sources and datasets defined in the report or shared on Report Server |
| Web hosting | ReportStorageWebExtension service plus the DevExpress.AspNetCore.Reporting package | ReportViewerController implementing IReportController, BoldReports.Net.Core package |
| Server product | Report and Dashboard Server, licensed separately by Client Access License (one per account, 15 included) | Report Server in Cloud, Managed Private Cloud, and On-Premises editions |
What carries over and what you rebuild
| Item | Carries over | Rebuilt or recreated |
|---|---|---|
| Databases, tables, views, stored procedures | Yes, unchanged | Nothing to rebuild |
| SQL query text | Yes, pasted into RDL datasets | Query parameters re-bound |
| Report layout | Nothing | Rebuilt as data regions |
| Expressions and calculated fields | The business rules | Syntax rewritten |
| Parameters | Names, defaults, and prompts as a specification | Re-created in RDL |
| Scripts and event handlers | The intent of the logic | Re-implemented (see stage 5) |
| Viewer and designer integration | Nothing | Replaced in the host app |
| Schedules, subscriptions, permissions | Nothing | Recreated in Report Server |
| Reference PDFs from DevExpress | Yes, as the validation baseline | Nothing to rebuild |
How do you migrate from DevExpress Reports to RDL?
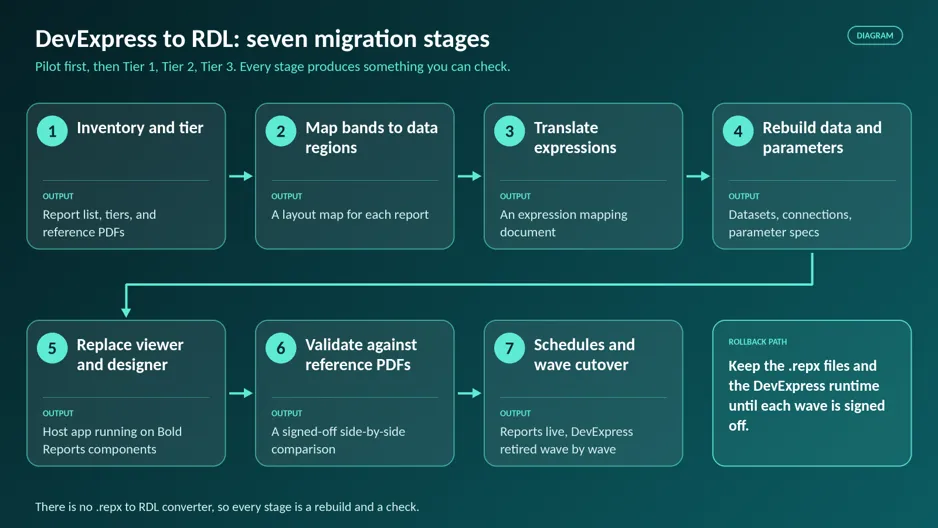
There is no converter from .repx to RDL, so you rebuild each report in seven stages: Inventory and tier the estate, map bands to data regions, translate expressions, rebuild data sources and parameters, replace the viewer and designer in your host application, validate output against reference PDFs, then recreate schedules and cut over in waves.
1. Inventory and tier your .repx reports
Record, for each report:
- Its source: .repx file, report class in code, database-stored layout, or a document on DevExpress Report and Dashboard Server.
- Its owner, business use, and run frequency. Mark reports nobody opens as retirement candidates.
- Dependencies: subreports, shared styles, scheduled jobs, export routines, and the application screens that call it.
- Data sources: the DevExpress component type, connection, queries, stored procedures, and any code-generated data.
- Parameters, defaults, calculated fields, filters, and formatting rules.
- Scripts, event handlers, custom controls, and third-party assemblies.
- Items to check against the Bold Reports supported-items list: Check Box, Table of Contents, Shape controls, and the 3-D, Sunburst, Tree Map, Bullet Graph, Heat Map, and Gantt chart types.
Check how each .repx was saved. DevExpress states that .NET applications only support REPX saved with XML serialization, and files saved in the legacy CodeDOM format must be converted to XML first. Any script you write to scan the inventory should expect XML.
Before changing anything, export a reference PDF of each report from DevExpress with fixed parameter values. These files are the baseline for stage 6.
| Tier | Typical characteristics | Approach |
|---|---|---|
| Tier 1 | One dataset, simple table, basic parameters | Direct rebuild |
| Tier 2 | Grouping, conditional formatting, subreports, cross tabs | Rebuild with expression translation |
| Tier 3 | Scripts, event handlers, several data sources, custom controls | Rebuild and redesign the logic |
Decide early whether reports will be served by embedded components, by Report Server, or by both, because that choice shapes stage 5. Build shared templates, styles, and shared data sources before the first rebuild.
Reports stored in DevExpress Report and Dashboard Server
Reports kept on DevExpress Report and Dashboard Server need to be extracted as .repx files before they join the inventory; check your server version’s documentation for the export option in its web designer. Scheduled tasks and user accounts are server objects rather than layout content, so list them separately for stage 7. DevExpress licenses the server by Client Access License, one per account, so your account list doubles as a map of the users to recreate in Bold Reports Report Server.
2. Map DevExpress bands to RDL data regions
DevExpress places controls inside bands. RDL places data regions in a report body, with a page header and footer around it. Most elements have a direct counterpart. For tablix structure, explore the SSRS tablix data region guide; for banded rows, see alternating row colors in an SSRS tablix.
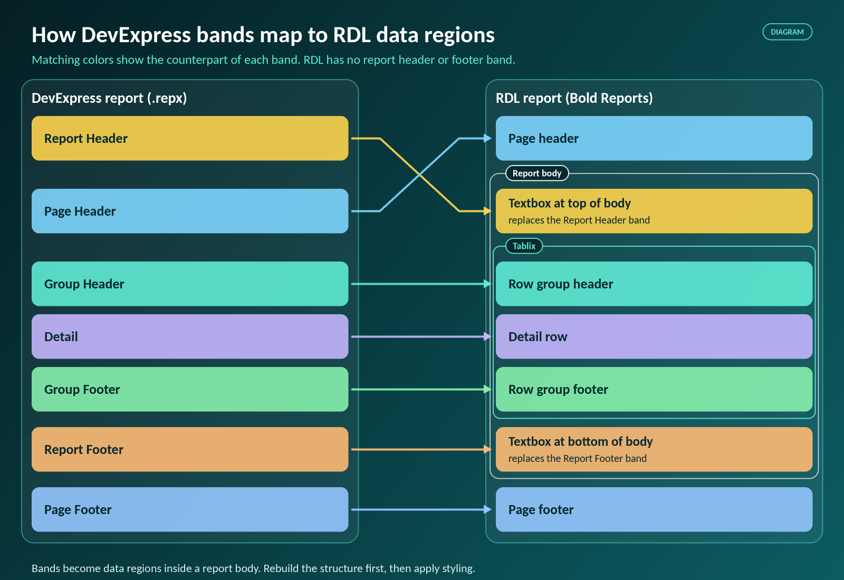
| DevExpress element | Bold Reports (RDL) equivalent |
|---|---|
| Detail band with a table | Table (tablix) detail row |
| Group Header and Group Footer bands | Row group header and footer rows |
| Report Header and Report Footer bands | Items at the top and bottom of the report body; RDL has no report-level band |
| Page Header and Page Footer bands | Page header and page footer |
| Detail Report band or subreport control | Nested data region or Subreport item |
| Cross Tab | Matrix |
| Calculated field | Dataset calculated field or expression |
| Chart | Chart item (check the chart type below) |
| Sparkline | Sparkline item |
| Gauge | Gauge item |
| Barcode | Barcode item |
| Picture Box | Image item |
| Shape | Shape custom report item (added in v9.1.7) |
| Check Box | No direct item |
| Table of Contents | No designer item |
Which DevExpress controls have no direct RDL equivalent?
In the current Web Report Designer and Standalone Report Designer documentation, Check Box, Table of Contents, and six chart types (3-D, Sunburst, Tree Map, Bullet Graph, Heat Map, Gantt) are listed as not supported. Shapes are available through the Shape custom report item added in v9.1.7. Record each one during inventory and choose a redesign before rebuilding.
| DevExpress item | Status in Bold Reports documentation | Options |
|---|---|---|
| Check Box | Listed “No” in the supported-items table | A textbox showing a glyph or text chosen by an IIf expression, an image switched by an expression, or an Indicator item |
| Table of Contents | Listed “No” as a designer item; PDF export can build a table of contents from the document map (release notes v6.3 and v7.1) | Set document map labels on groups and use the PDF table of contents export, or keep the report on DevExpress |
| Shape | Listed “No” as a native item; available as the Shape custom report item since v9.1.7, with more shape types in v14.1.12 | Use the Shape custom report item, or a Line or Rectangle for simple frames |
| 3-D, Sunburst, Tree Map, Bullet Graph, Heat Map, and Gantt charts | Listed “No” | Pick a supported chart type, redesign the visual, or keep the report on DevExpress |
3. How do DevExpress expressions translate to RDL?
Rewrite each one by hand. DevExpress uses a criteria language with bracketed fields, ?ParamName parameters, and summary functions prefixed with sum, such as sumSum. RDL expressions are VB.NET-based, start with an equals sign, and read fields as Fields!Name.Value. Page variables need extra care because RDL limits them to page headers and footers.
A note on naming: sumSum, sumRunningSum, and the other sum-prefixed names are real DevExpress summary functions, not typos.
| Task | DevExpress expression | RDL expression |
|---|---|---|
| Compare a field | [Country] == 'France' |
=Fields!Country.Value = "France" |
| Read a parameter | ?ParamName |
=Parameters!ParamName.Value |
| Conditional value | Iif([Qty] > 10, 'Bulk', 'Single') |
=IIf(Fields!Qty.Value > 10, "Bulk", "Single") |
| Join text | [FirstName] + ' ' + [LastName] |
=Fields!FirstName.Value & " " & Fields!LastName.Value |
| Test for null | IsNull([Region]) |
=IsNothing(Fields!Region.Value) |
| Group or report sum | sumSum([UnitPrice]) |
=Sum(Fields!UnitPrice.Value) |
| Average | sumAvg([UnitPrice]) |
=Avg(Fields!UnitPrice.Value) |
| Count | sumCount([OrderID]) |
=Count(Fields!OrderID.Value) |
| Distinct count | sumDCount([CustomerID]) |
=CountDistinct(Fields!CustomerID.Value) |
| Maximum and minimum | sumMax([Price]), sumMin([Price]) |
=Max(Fields!Price.Value), =Min(Fields!Price.Value) |
| Running total | sumRunningSum([Amount]) |
=RunningValue(Fields!Amount.Value, Sum, Nothing) |
| Record number in a group | sumRecordNumber([OrderID]) |
=RowNumber("GroupName"), or =RowNumber(Nothing) for the whole report |
| Conditional aggregate | [][[CategoryID] > 5].Sum([UnitPrice]*[Quantity]) |
=Sum(IIf(Fields!CategoryID.Value > 5, Fields!UnitPrice.Value * Fields!Quantity.Value, 0)) |
| Hide when there is no data | [DataSource.RowCount] != 0 on the Visible property |
=CountRows() = 0 on the Hidden property, or the data region’s NoRowsMessage |
| Alternate row colors | Iif([DataSource.CurrentRowIndex] % 2 == 0, 'White', 'LightGray') |
=IIf(RowNumber(Nothing) Mod 2 = 0, "White", "LightGray") |
| Currency format | TextFormatString property: {0:c2} |
Format property C2, or =Format(Fields!Amount.Value, "C2") |
| Last-page message | Iif([Arguments.PageIndex] == [Arguments.PageCount] - 1, 'The last page!', '') |
In the page footer: =IIf(Globals!PageNumber = Globals!TotalPages, "The last page!", "") |
Four rules from the source documentation decide how page-level logic moves:
- Index base.
[Arguments.PageIndex]is zero-based, so DevExpress tests the first page withPageIndex == 0.Globals!PageNumberis one-based, so the RDL test isPageNumber = 1. - Where page variables live. Microsoft’s documentation limits
PageNumberandTotalPagesto expressions in a page header or page footer. A DevExpress label in a Detail band that reads page variables has to move to the page header or footer in RDL. - Event timing. DevExpress evaluates page-variable expressions in the PrintOnPage event, where data fields are not available, and only report parameters can be used.
- Known DevExpress limits. DevExpress says not to use
Arguments.PageIndexandArguments.PageCountwhen the report is merged with another report or includes a table of contents, because the values are not set correctly.PageCountcan also be wrong with the CachedReportSource component. Check those reports against their printed output, not only their expressions.
Validate after translating. Once you rebuild each expression, test it with the same data and parameter values as the original report, paying extra attention to null handling, formatting under the same locale, running totals, and page-level expressions. Keep every proven pair in one mapping document so later waves reuse it. The SSRS expressions cheat sheet and the knowledge base answer on SSRS expression support in Bold Reports cover more RDL syntax.
Worked example: a first-page rule from DevExpress documentation
DevExpress’s own documentation shows an expression binding that makes a label bold on the first page. The binding runs in the PrintOnPage event:
DevExpress (C#, from DevExpress documentation)
label.ExpressionBindings.Add(new ExpressionBinding("PrintOnPage", "Font.Bold", "Iif([Arguments.PageIndex] == 0, true, false)"));
Excerpt: DevExpress, How to Construct Expressions, v26.1, © Developer Express Inc., quoted for commentary.
The RDL translation changes three things: the target property, the index base, and the location. Put the textbox in the page header, select it, and set its FontWeight property to:
Bold Reports (RDL expression on FontWeight)
=IIf(Globals!PageNumber = 1, "Bold", "Normal")
This pair is built only from documented syntax and has not been run as a pilot. Test it against your own reference PDF before reusing it.
Sizing your estate? Bring one representative .repx file, ideally a Tier 2 or Tier 3 report, to a Bold Reports demo session. The team can walk through the rebuild path for that report and the items it would need to redesign.
4. Rebuild data sources and parameters
DevExpress serializes its data source components into the .repx. In RDL, each report defines datasets fed by a data source connection, either embedded in the report or shared on Report Server. Your databases don't change; the binding does.
| DevExpress data source | Bold Reports option |
|---|---|
| SqlDataSource | SQL data source (SQL Server, Oracle, PostgreSQL, MySQL, MariaDB, and others on the supported list) with the query or stored procedure as a dataset |
| JsonDataSource | JSON or Web API data source |
| ExcelDataSource | Excel or CSV data source |
| MongoDBDataSource | MongoDB data source, listed as supported in the Standalone Report Designer; confirm it for the Web Report Designer you deploy |
| ObjectDataSource | No direct equivalent: move the query to a view or stored procedure, expose it as a Web API, or pass data from the host app in an RDLC report |
| EFDataSource | No direct equivalent: query the underlying database directly or expose a Web API |
| FederationDataSource | No direct equivalent: join in a SQL view, or use separate datasets in separate data regions |
Sources: DevExpress Bind Reports to Data and the Bold Reports supported-items pages. The full connector list is on the data connectors page. The supported-items pages list SQLite and MS Access, among others, as not supported, so check those sources first.
- For SQL-backed reports, recreate the connection, paste the query into a dataset, and move heavy filtering and aggregation into views or stored procedures.
- For object-bound data, the RDLC reports in ASP.NET Core guide shows the host application supplying data at runtime.
- Rebuild parameters with the same names, defaults, and prompts, then test multi-value and cascading parameters with the stage 1 values.
5. Replace the viewer and designer in your host app
For ISVs, the reports are only half the job; the application also loads, shows, and edits them. DevExpress web controls send open and save requests to a report storage service: a ReportStorageWebExtension descendant that your app registers, delivered with the DevExpress.AspNetCore.Reporting package in ASP.NET Core. Bold Reports splits the work differently.
| Concern | DevExpress Reports | Bold Reports |
|---|---|---|
| Server package | DevExpress.AspNetCore.Reporting |
BoldReports.Net.Core |
| Resolving a report | A ReportStorageWebExtension descendant maps a name to a layout |
A ReportViewerController implementing IReportController loads the RDL or RDLC |
| Showing a report | Web Document Viewer bound to a report name | Report Viewer with reportPath and reportServiceUrl |
| Designer | Web Report Designer component | Web Report Designer component, or the designer built into Report Server |
Reports can sit in a folder the controller reads, or be published to Report Server and loaded from there. Setup guides: ASP.NET Core Report Viewer, ASP.NET Core Web API reporting service, and Report Designer in Angular. Viewer components are available for JavaScript, Angular, React, ASP.NET Core, ASP.NET MVC, ASP.NET Web Forms, Blazor, WPF, and UWP.
Scripts and event handlers: where custom logic goes
DevExpress’s documentation describes report scripts as insecure, disables them by default, and recommends expression bindings instead (Handle Script Events at Runtime). Check your inventory for any scripts that remain, and for each kind of logic choose a target from this table:
| DevExpress logic | First choice | Fallback |
|---|---|---|
| Expression binding | RDL expression (table in stage 3) | Code Module function for long expressions |
| Report script (BeforePrint, PrintOnPage) changing values or formatting | RDL expression on the property | Code Module VB function |
| Script or code-behind that fetches or reshapes data | View or stored procedure | Host app supplies data (RDLC) |
| Event handler in a report class (C#) | Rewrite as expressions plus SQL | Custom assembly where the server allows it |
| Custom control | Supported RDL item or custom report item | Keep the report on DevExpress |
| Logic that depends on the user or application state | Report parameters set by the host app | User! globals in expressions |
Code Module scope depends on where the report is designed and rendered:
| Where the report is designed or rendered | VB custom code (Code Module) | Custom assemblies (References) |
|---|---|---|
| Report Server Web Report Designer, On-Premises | Supported | Supported; the DLL must be in the GAC or the reporting service bin folder |
| Report Server Web Report Designer, Cloud | Supported | Not documented for Cloud; confirm with Bold Reports before relying on it |
| Standalone Report Designer | Supported | Supported; same GAC or bin requirement |
| Embedded Web Report Designer | Supported unless the host sets disableCodeModule: true |
Depends on the host’s reporting service |
| Embedded Report Viewer (ASP.NET Core) | VB code in the report renders from v3.x onward | Register assemblies in reportOption.ReportModel.Assemblies in OnInitReportOptions; otherwise expect errors RE0027 or RE0029 |
For Managed Private Cloud, confirm Code Module and assembly deployment with Bold Reports before you rely on either. Review the supported items and Code Module pages, custom code with Report Viewer, and the error codes page.
6. Validate output against the original
Compare each rebuilt report with its stage 1 reference PDF, using the same inputs:
- Page count and page break positions.
- Fonts, spacing, and alignment.
- Totals, group subtotals, and the first and last row of each group.
- PDF, Excel, and browser output.
- Render time and memory on the largest realistic dataset.
- Parameters: defaults, multi-value selections, cascading prompts, and nulls return the same rows.
- Formats: dates, currency, and numbers display the same way under the same locale.
- Sign-off: the report owner approves the side-by-side comparison in writing before the original is retired.
7. Move schedules and cut over in waves
Schedules, subscriptions, and permissions do not migrate. Recreate them in Report Server. Report scheduling runs on schedules from hourly to yearly with time-zone-aware start times, and delivers by email, file location, FTP or SFTP, or Amazon S3.
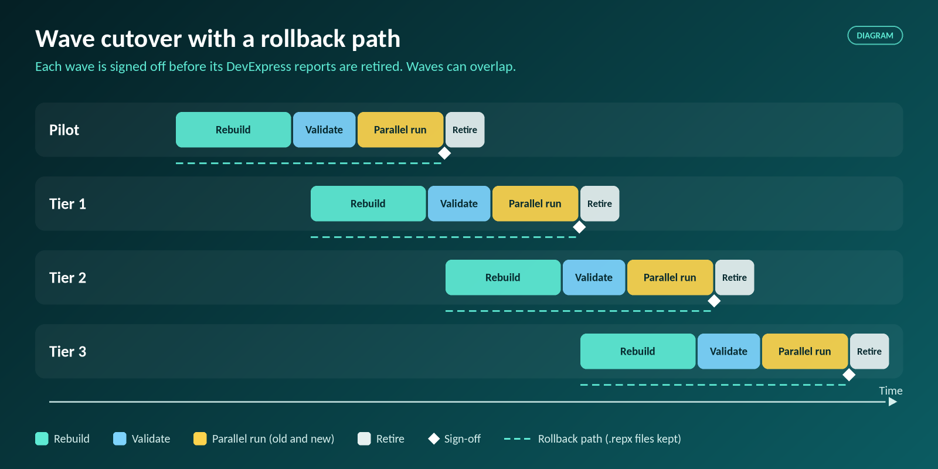
Cut over in waves: the pilot first, then Tier 1, Tier 2, and Tier 3. Run old and new schedules in parallel for a few cycles and compare the delivered files before switching recipients. Retire a DevExpress report only after a clean cycle on the new platform. Give report authors the mapping document and shared templates so new reports follow the same patterns.
Coexistence and rollback
Keep the original .repx files and the DevExpress runtime until each wave is signed off; that is your rollback path. Don't plan to convert reports back. DevExpress’s importer can read RDL and names SyncFusion BoldReports among its RDLC sources, but its documentation says the Chart, Subreport, List, and Table controls are not supported, that functions it cannot convert are replaced with a NOT_SUPPORTED marker, and that it rejects RDL from before SQL Server 2005.
What goes wrong in a DevExpress report migration?
Most problems come from six areas: band-versus-data-region layout, expression syntax, parameter behavior, portfolio size, custom business logic, and performance. Choose pilot reports so that each area is exercised at least once, and record every failure in the mapping document so later waves start from known cases instead of rediscovering them.
| Risk area | Early warning sign | Mitigation | Stage |
|---|---|---|---|
| Layout | Page breaks or group headers land differently from the reference PDF | Rebuild structure before styling; compare page by page | 2, 6 |
| Expression syntax | Totals or page text differ; page variables used outside a header or footer | Mapping document; move page logic to the header or footer | 3 |
| Parameters | Different row counts for multi-value or cascading inputs | Re-create names and defaults exactly; test the stage 1 values | 4 |
| Portfolio size | Rebuild rate per week falls behind plan | Retire unused reports; tier; shared templates; waves | 1, 7 |
| Custom business logic | Scripts or code-behind with no expression equivalent | Use the decision table above; push data logic to SQL | 5 |
| Performance | Slow render on the largest dataset | Tune queries; move heavy calculations to the data layer | 4, 6 |
How much effort does a DevExpress migration take?
Effort depends on report count and complexity, so estimate it from your own pilot rather than a generic figure. Rebuild one report per tier, record design, expression, and validation hours separately, then multiply by the report count in each tier and add fixed costs for host-app integration, schedules, and permissions. Re-estimate after wave one.
Fill this model with your pilot numbers:
- N1, N2, N3: reports to migrate in each tier, after retirements (from your stage 1 inventory).
- H1, H2, H3: measured hours per pilot report in each tier, covering layout, expressions, and validation (from your pilot).
- Nr and R: the count of reports with redesign items (from your inventory) and the extra hours per such report (from your pilot).
- F: fixed work for viewer and designer integration, shared templates, data sources, schedules, and permissions (from stages 5 and 7).
- C: a contingency factor, for example 1.2, reduced once wave one data is in.
Total hours = C × (N1 × H1 + N2 × H2 + N3 × H3 + Nr × R + F)
Recalculate after the first wave with actual hours. Rates measured on three pilot reports are a starting point, not a forecast.
What does Bold Reports offer as a migration target?
Bold Reports provides a complete RDL-based reporting platform to rebuild, view, manage, and distribute reports in a single solution. It includes web and desktop report designers for report creation, embeddable report viewers for applications, and Report Server deployment options (Cloud, Managed Private Cloud, and On-Premises) for secure report management and scheduling.
- Rebuild reports: Use the Web Report Designer in a browser or embedded application, or the Standalone Report Designer for Windows to recreate report layouts. If you're getting started, see how to create your first RDLC report.
- Display reports: Integrate reports into your applications using the Report Viewer components available across major web and desktop platforms.
- Manage and deliver reports: Use Report Server to centrally store, secure, organize, and schedule report delivery through Cloud, Managed Private Cloud, or On-Premises deployments.
If your reporting environment also includes SSRS, you can use those RDL files natively in Bold Reports, significantly reducing migration effort. Learn more in the SSRS Migration guide and the Bold Reports vs. SSRS Guide.
Start with one report
Choose one Tier 2 report, rebuild it in RDL, and compare it with its reference PDF before you plan the rest. That single comparison will tell you more about your estate than any estimate.
To try it, start a free 30-day Bold Reports trial, or request a demo and bring a sample .repx so the Bold Reports team can walk you through the rebuild.
Frequently asked questions
- 1.
Can DevExpress reports be converted to Bold Reports automatically?
[object Object]
- 2.
Do DevExpress expressions work in Bold Reports?
[object Object]
- 3.
Which DevExpress controls have no RDL equivalent?
[object Object]
- 4.
Can I keep using DevExpress for some reports while migrating others?
[object Object]
- 5.
What happens to scheduled reports and subscriptions?
[object Object]
- 6.
How do I move reports stored in DevExpress Report and Dashboard Server?
[object Object]
- 7.
Which teams should move DevExpress reports to Bold Reports?
[object Object]