Skip to content

Product

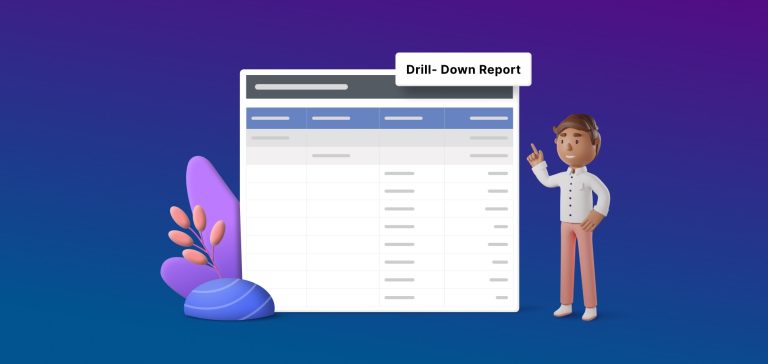
How to Create a Drill-Down Report: Step-by-Step Tutorial

Learn how to create a drill-down report in Bold Reports with this step-by-step tutorial.

How to Create a Drill-Down Report Using the Report Designer

Drilling down is an interactive feature in reports that allows users to explore data in greater detail. It enables users to navigate hierarchical relationships among data, making it possible to identify the root causes of findings.

We have created a tutorial video to show you how to create a drill-down report in Bold Reports®. Feel free to watch it here or on our YouTube channel, where you’ll find similar feature guides.

Agenda

  • How to create a drill-down report in Bold Reports.
  • How to display sales by person and country in a drill-down report.

Who should watch?

  • Data analysts who want to learn how to create a drill-down report in Bold Reports.
  • Anyone who wants to learn how to display report data in a hierarchical manner.

To learn more about creating drill-down reports, read the Bold Reports® blog: How to Create a Drill-Down Report Using the Report Designer.

To experience the capabilities of Bold Reports® firsthand, we offer a 30-day free trial  with no credit card required. We invite you to start the trial and discover the potential of Bold Reports. We value your feedback, so please don’t hesitate to let us know your thoughts.

Meet the author

Barbra is a content producer at Syncfusion. She is dedicated to creating content in various formats for Bold Reports products. She collaborates with subject matters experts, writing instructional content and working with graphics designers to produce engaging content.

Newsletter

Reporting insights, in your inbox

New posts on embedded reporting, SSRS and Crystal Reports migration, and product updates. No spam.

Keep reading

8 min read

MIS Reports: Benefits, Types, Key Components, and Preparation Steps

This blog will walk you through MIS reports, what are they, their benefits, types, key components, and steps for preparing them using the Bold Reports® reporting tool. What are MIS reports? A management information system (MIS) report is a document that provides information to support decision-making and management activities within an organization.

Arulraj A
6 min read

How to Apply Alternating Row Colors in an SSRS Tablix

Many organizations use SSRS to work with large amounts of data. But as reports get bigger, they can become harder to read. One simple way to improve clarity is by applying alternating row colors. This technique helps users quickly scan through rows and spot patterns more easily.

Eunice Damaris Akinyi

All blog posts

Ready to Get Started?

Ready to Modernize Reporting the Modern Way?

From migrating legacy reports to embedding reporting in applications, Bold Reports helps you move forward with confidence.

No credit card required.