
Report Designer: Types, Uses, and Best Tools in 2026
TL; DR
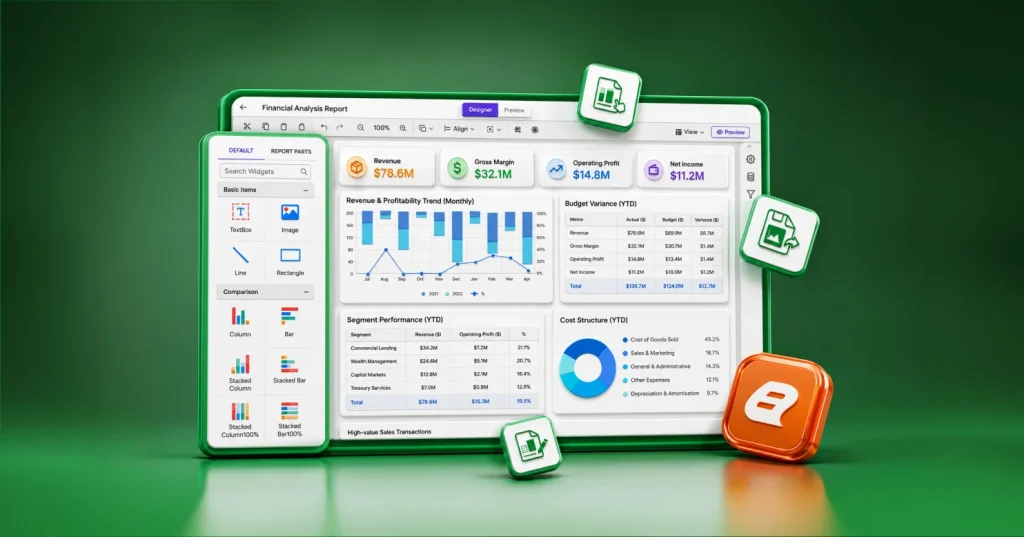
A report designer is a visual reporting tool that enables users to connect to business data and create customized reports without coding. Unlike spreadsheets, it is designed for building formatted, professional reports with automated data retrieval, consistent layouts, and easier report management.
Introduction
Every business generates data, but turning it into actionable insights is often challenging. Many teams still spend most of their time creating reports manually, leaving less time for analysis and strategic planning.
As reporting requirements grow, manual processes become difficult to scale, prone to errors, and harder to maintain. Organizations need a way to transform data from databases, applications, and business systems into clear, professional reports that can be easily printed and distributed.
This is where a report designer becomes essential. It enables users to create pixel-perfect reports that present information in a consistent, visually appealing format, making it easier for stakeholders to understand insights and make informed decisions.
In this guide, you’ll learn what a report designer is, its key components, and best practices for creating reports that deliver real business value.
What is a report designer?
A report designer is a web-based reporting tool that enables users to create, customize, and edit professional reports. Using a visual interface, users can design reports with tables, charts, parameters, and other reporting elements without manually coding layouts.
Report designer vs. dashboard vs. spreadsheets vs. report builder
Report designers, report builders, dashboards, and spreadsheets serve different reporting needs. Understanding their differences helps organizations choose the right reporting solution.
| Feature | Report designer | Dashboard | Spreadsheet | Report builder |
| Primary purpose | Create detailed, pixel-perfect reports from business data. | Monitor KPIs and business performance in real time. | Organize, analyze, and manipulate data.
|
Create reports from existing datasets using predefined layouts. |
| Report design | Structured layouts with precise formatting and pagination. | Interactive visualizations with flexible layouts. | Editable grid-based interface. | Template-based layouts with basic customization.
|
| Interactivity | Parameters, filters, and drill-through reporting. | Interactive charts, filters, and drill-down analysis. | Basic formulas, filters, and sorting.
|
Filters, parameters, and basic customization.
|
| Automation | Scheduled report generation and delivery. | Data refreshes and alerts. | Mostly manual. | Basic scheduling and distribution. |
| Formatting control | Precise layout, pagination, and branding. | Flexible visual layouts. | Limited print formatting. | Moderate layout customization. |
Benefits of using a report designer
A report designer helps organizations:
1. Save report development time
Modern report creation tools provide drag-and-drop tools, reusable templates, and prebuilt report elements that speed up report creation. This allows users to design and deploy reports without manually building layouts from scratch.
2. Reduce manual work
Manual reporting often requires repeatedly collecting data, updating spreadsheets, and formatting reports. Modern reporting platforms automate these tasks, reducing repetitive work and improving team productivity.
3. Improve reporting accuracy
By connecting directly to business data sources and using reusable datasets, calculations, and templates, it minimizes manual errors and helps ensure reports remain accurate and consistent.
4. Enable faster decision-making
Timely access to accurate reports helps stakeholders monitor performance, identify trends, and make informed decisions more quickly. Automated reporting also ensures critical information is available when needed.
5. Improve team collaboration
Many reporting solutions include centralized report management, shared workspaces, and role-based access controls. These features make it easier for teams to create, review, and manage reports collaboratively.
Challenges of using a report designer
While report designers offer significant advantages, organizations may encounter a few challenges during implementation and adoption:
-
- Learning curve: Advanced report designers often include features such as expressions, parameters, data modeling, and report layouts. New users may require training before they can build complex reports effectively.
- Managing multiple data sources: Connecting and combining data from different databases, applications, and APIs can be complex, especially when data structures are inconsistent.
- Performance with large datasets: Reports that process large volumes of data or use complex queries may experience slower loading and rendering times if not properly optimized.
- Data quality issues: Inaccurate, incomplete, duplicate, or outdated data can reduce report accuracy and reliability, leading to misleading conclusions and poor business decision-making.
5 types of report designer
Report designers are available in several forms to meet different reporting needs:
1. Web report designer
A web report designer runs entirely in a browser, eliminating the need for software installation. Report definitions are stored centrally, making it easy for teams to collaborate and access the latest version of a report from anywhere without relying on desktop tools.
Trade-off: It may provide slightly less offline flexibility than desktop-based alternatives.
2. Desktop report designer
A desktop report designer is installed locally and provides advanced control over report layouts, formatting, and customization. It is commonly used for complex reporting requirements and offline report development.
Trade-off: Reports typically need to be published or deployed before others can access them, making collaboration less seamless than web-based solutions.
3. Embedded report designer
An embedded report designer integrates directly into web applications, customer portals, and SaaS platforms, enabling users to create, edit, and view reports without leaving their workflow.
Trade-off: Implementing embedded reporting may require additional development and integration effort.
4. AI report designer
An AI report designer uses artificial intelligence to speed up report creation with features such as layout recommendations, automated summaries, and natural language queries. It helps organizations create reports faster and makes reporting more accessible to nontechnical users.
Trade-off: Complex reporting requirements may still require manual customization and validation.
5. Mobile report designer
A mobile report designer allows users to create, access, and share reports from smartphones and tablets, enabling access to business data from anywhere.
Trade-off: Smaller screens can limit complex report design and formatting capabilities.
Features of a report designer
While capabilities vary by platform, reporting platforms often combine data connectivity, design tools, and reporting features to create professional, actionable reports.
1. Data source connectivity
This feature enables users to connect reports to multiple data sources, ensuring access to accurate and up-to-date information in a central place.
2. Drag-and-drop design surface
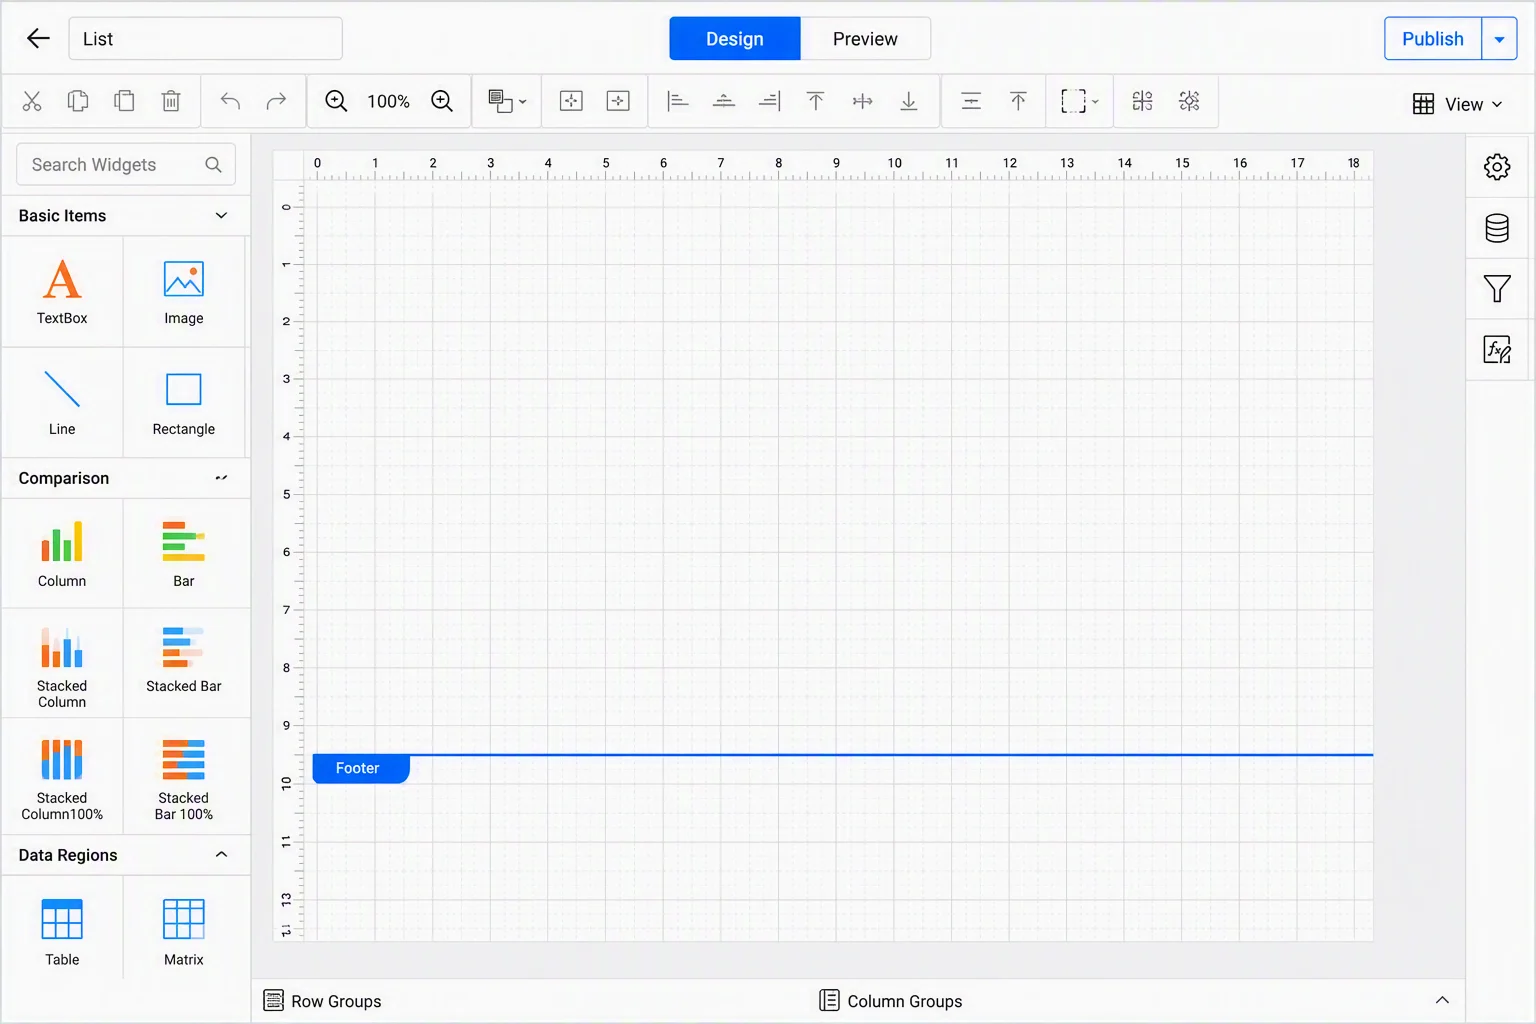
A drag-and-drop design interface allows users to create and customize reports visually by placing and arranging report elements such as tables, charts, images, and text boxes without coding.
3. Parameters and filters
Parameters and filters enable users to customize report output based on specific criteria, such as date ranges, regions, or product categories, making reports more relevant.
4. Expressions and calculations
Expressions add business logic through calculations, running totals, conditional formatting, and dynamic labels.
5. Charts and visualizations
Charts, tables, gauges, and other visual elements help stakeholders quickly identify trends, patterns, and performance metrics.
6. Layout and formatting tools
Formatting tools allow users to customize fonts, colors, borders, spacing, alignment, and themes to create consistent, professional, and brand-aligned reports
7. Export and sharing options
Most report designers support exporting reports in multiple formats, making it easier to share information across teams and stakeholders.
How a report designer works, step by step
Most reporting solutions follow a similar process for creating reports from data, though features such as automation, customization, and embedding differ by solution.
The following steps show how a report designer transforms raw data into professional, shareable reports:
Step 1: Connect to a data source
The process begins by connecting the report designer to data sources. The reporting tool retrieves the required data and makes it available for report creation.
Step 2: Select and prepare data
Once connected, select the datasets and fields required for the report. Most reporting tools support filtering, sorting, grouping, and data aggregation, ensuring only relevant information is included in the final report.
Step 3: Design the report layout
Once the data is ready, design the report using a visual canvas. With drag-and-drop functionality, add elements such as tables, charts, and text boxes to create a structured report layout. The layout’s formatting, alignment, headers, footers, and pagination can be customized.
Step 4: Add filters and parameters
Add report filters and parameters to customize the report output based on criteria such as date ranges. This enables interactive reports that allow users to view relevant business data without modifying the report layout. This makes reports more flexible, reusable, and easier to adapt to different reporting needs.
Step 5: Apply formatting and business logic
Next, enhance the report with calculations, conditional formatting, KPI indicators, and dynamic labels to make data easier to understand.
Step 6: Preview and validate
Before publishing, preview the report to verify data accuracy, calculations, and layout consistency, ensuring it displays correctly in different scenarios.
Step 7: Publish, export, or share
After validation, the report can be published, exported, or embedded into applications.
Step 8: Schedule automated delivery
Many reporting platforms allow users to schedule reports for automatic generation and distribution through email or other delivery channels.
Common report design mistakes and how to avoid them
1. Too many metrics, no clear hierarchy
Including every metric in a report can create information overload, making it difficult for stakeholders to identify trends. Effective reports focus on business-critical KPIs and use visual hierarchy to emphasize the most important information, improving report readability, and decision-making.
2. Failing to design reports for the audience
A report may accurately display data but still fail to deliver value if it doesn’t meet audience needs. Executives, managers, and analysts often require different levels of detail. Effective report design tailors the content and layout to stakeholder requirements, making reports easier to understand and act on.
3. Using static reports for dynamic questions
Modern businesses need reports that can adapt to changing needs. Static reports provide a fixed view of data, making it harder to explore it and answer evolving business questions. such Filters, drill-down, and other interactive features enable a more flexible and effective reporting experience.
4. Overlooking formatting and branding
Inconsistent formatting can make even accurate reports appear unprofessional. Missing elements such as logos, page numbers, headers, and branding can reduce readability and credibility. Consistent branding and report styling help create professional reports that are easier to trust and interpret.
5. Failing to highlight actionable insights
When key metrics, trends, and business insights are not clearly highlighted, users may struggle to identify opportunities and performance issues. Using summary highlights helps present key findings and support faster decision-making.
6. Ignoring accessibility and responsiveness
A report may contain accurate data but still fail if users struggle to read or navigate it. Poor color contrast, small fonts, nonresponsive layouts, and inaccessible visuals can reduce usability across devices. Clear typography, accessible color choices, and responsive layouts help ensure reports remain easy to understand and use.
Common report designer use cases across industries
A report designer is used across industries to transform raw data into structured, actionable reports.
1. Healthcare reporting
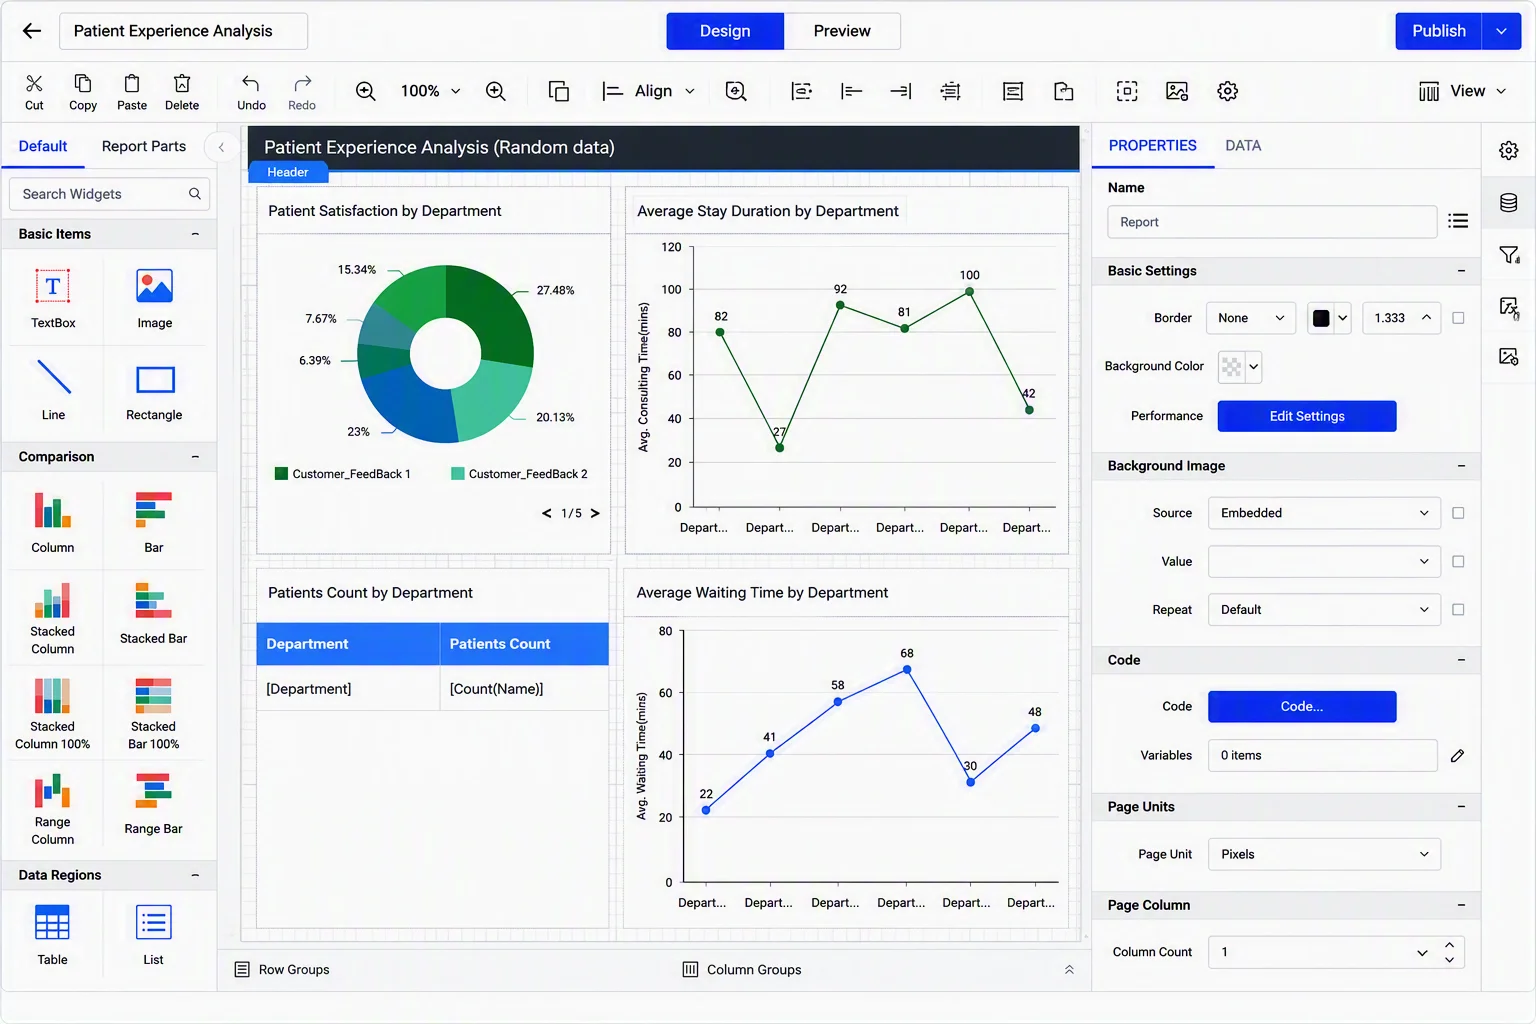
Healthcare providers generate large volumes of clinical, operational, and compliance data. A report designer helps create patient summaries, billing reports, clinical reports, and regulatory documentation by consolidating data from EHRs and healthcare systems.
These reports improve patient care, support compliance, and provide healthcare teams with actionable insights for better decision-making.
2. Financial reporting
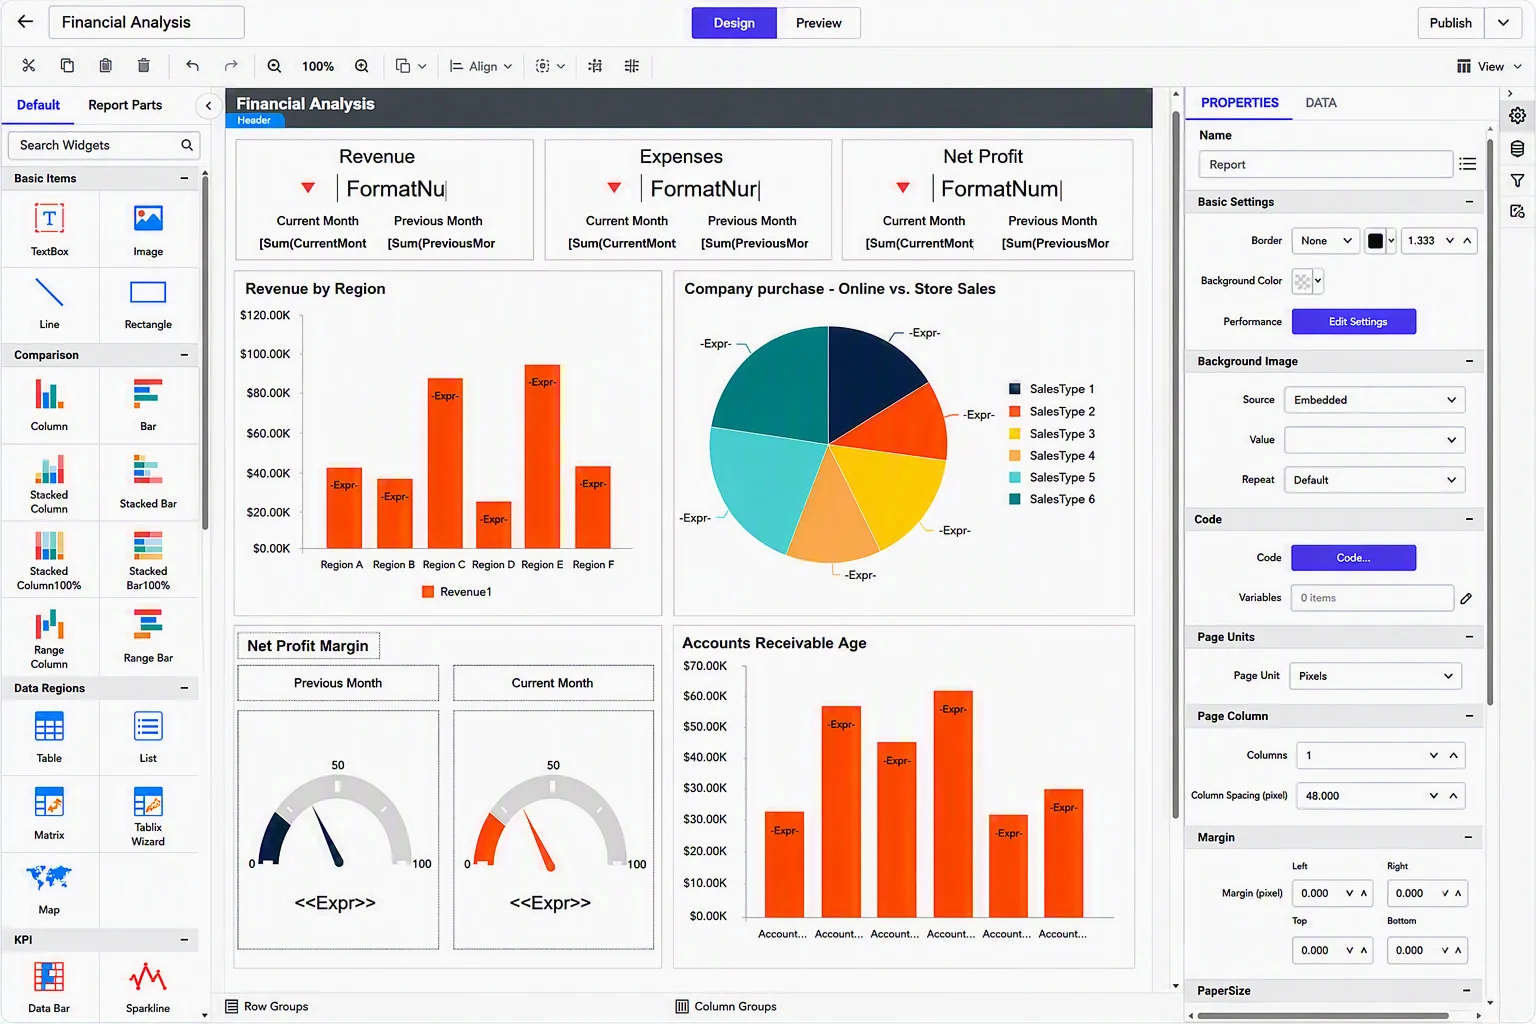
Financial reporting requires accurate, well-structured data to support audits, legal compliance, and business planning. Using a report designer, finance teams can combine data from accounting and ERP systems to create financial statements, balance sheets, P&L reports, and tax reports with consistent formatting.
3. HR reporting
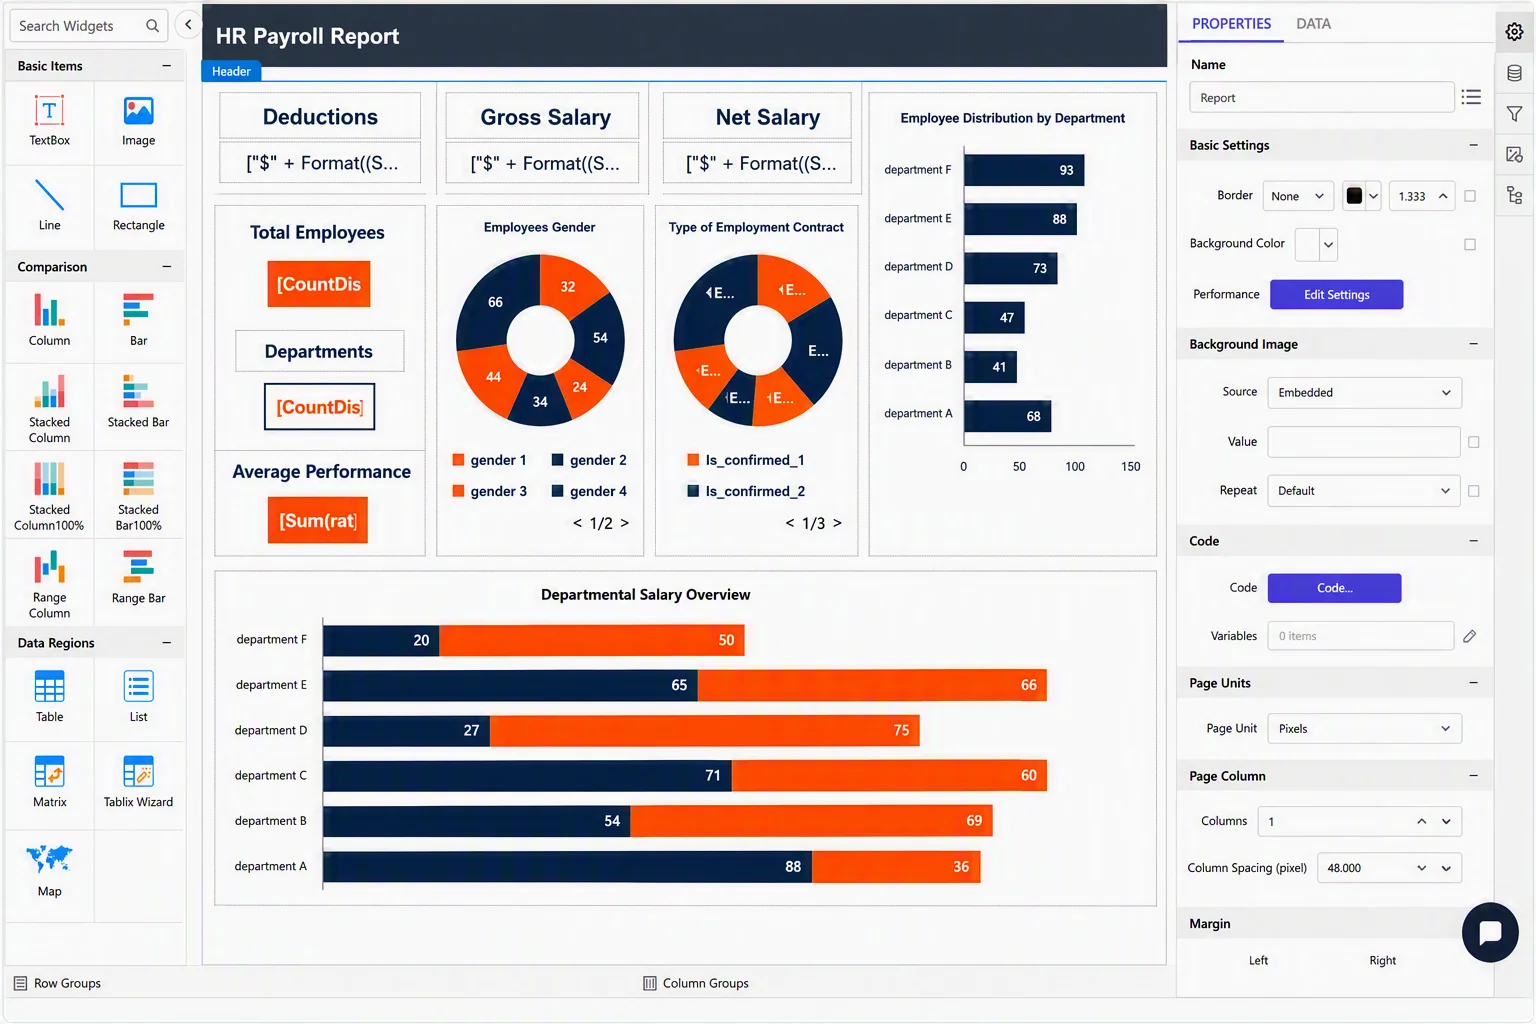
Managing employee information requires secure, accurate, and consistent reporting. A report designer enables HR teams to create payroll reports, attendance records, employee headcount summaries, recruitment reports, and workforce performance reports in a structured and consistent format.
4. Manufacturing reporting
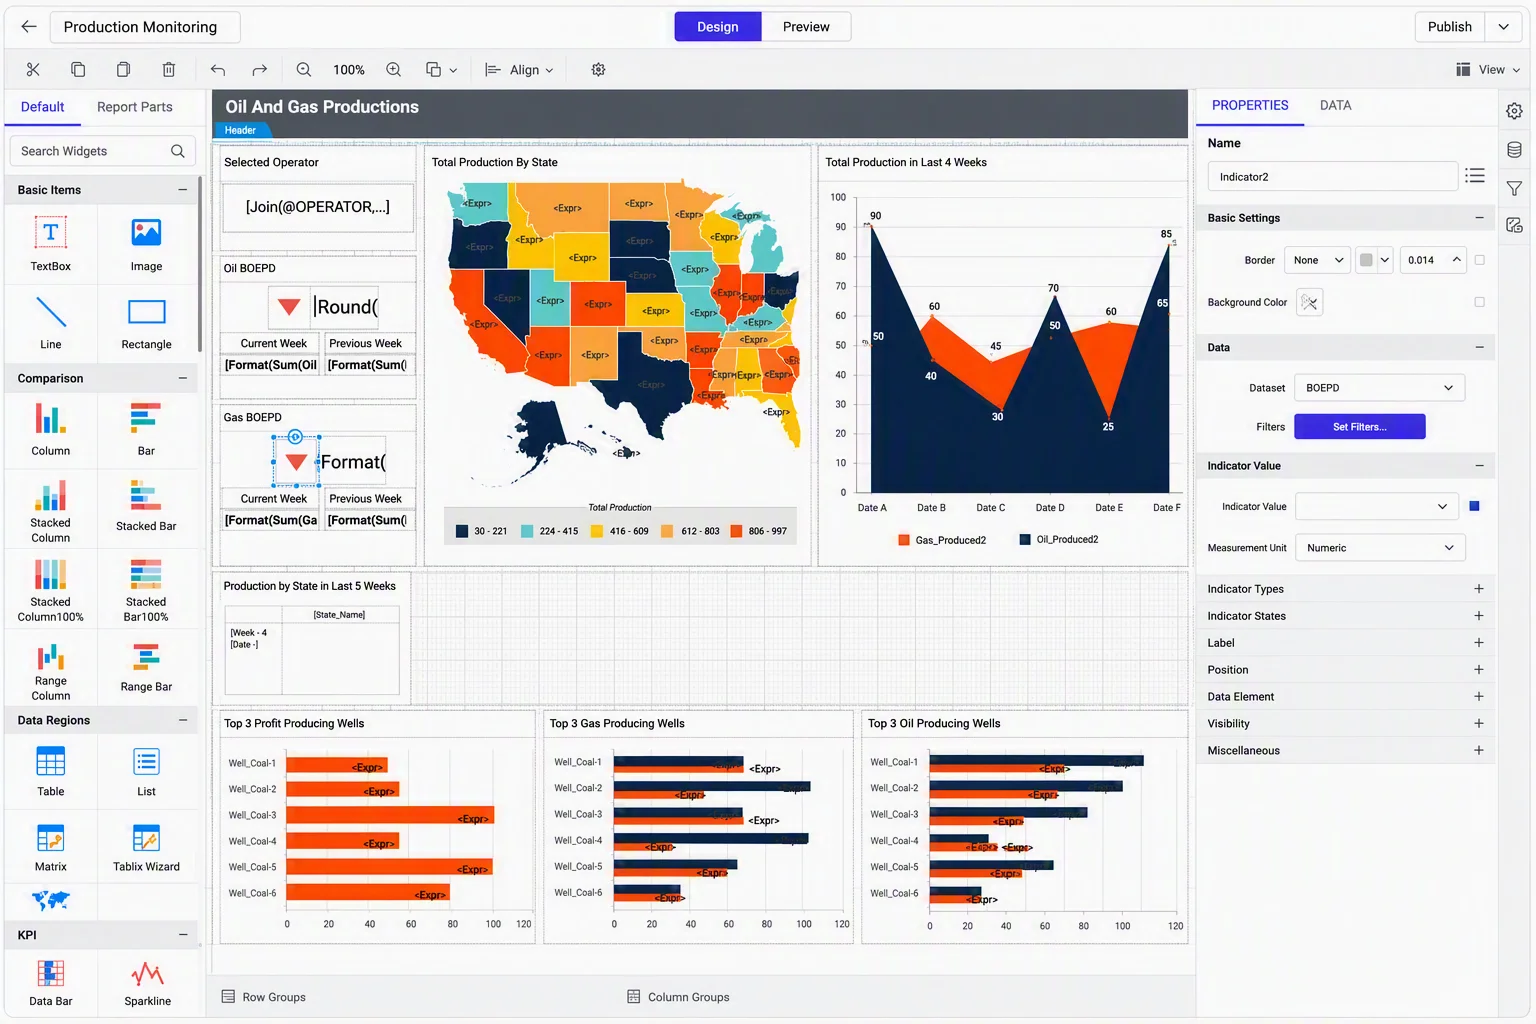
Manufacturers depend on timely reporting to monitor production performance, track inventory levels, and improve operational efficiency across facilities and supply chains. With report designers, manufacturers can create production, inventory, and operational reports by consolidating data from ERP and warehouse management systems, improving operational visibility, resource planning, and manufacturing efficiency.
How to choose a report designer tool
When evaluating a report design software, consider the following factors:
-
- Report design capabilities: The solution should support drag-and-drop design, expressions, tables, and pixel-perfect formatting to simplify report creation and customization. Limited design capabilities can increase development effort and restrict report flexibility.
- RDL and SSRS compatibility: Organizations using existing RDL or SSRS reports should choose a compatible report designer to simplify migration and protect reporting investments. Without compatibility, reports may need to be recreated from scratch, increasing time and costs.
- Data source connectivity: Select a tool that can connect to all your data sources from a single environment. Limited connectivity can create data silos and lead to inefficient reporting processes.
- Web and desktop access: The ideal solution should provide web-based, desktop, and hybrid report design options, as needed. Relying on a single design environment can limit accessibility and collaboration.
- Embedded reporting: Choose a software with embedded reporting capabilities to seamlessly integrate reports into applications and SaaS platforms. Without this, organizations may face additional development efforts and a fragmented user experience.
- Scheduling and distribution: Select a reporting solution with automated scheduling and distribution to ensure stakeholders receive timely reports. Relying on manual report delivery can increase administrative overhead and the risk of outdated information.
Best report designer software
The best reporting software depends on your reporting needs, deployment preferences, and reporting environment. Here are some of the most popular tools for creating reports.
1. Bold Reports
Bold Reports is modern reporting software that offers both web-based and desktop report designing experiences. It helps organizations create pixel-perfect reports with an intuitive drag-and-drop designer, multiple data source connections, and native SSRS RDL compatibility. Bold Reports enables organizations to centralize reporting, automate report delivery, reduce manual effort, and provide users with timely access to actionable business insights.
Highlighting these strengths, Vishnu P., a quality assurance engineer at an enterprise organization with over 1,000 employees, shared in a G2 review: “I like Bold Reports for its intuitive drag-and-drop designer that simplifies report creation. Its wide data source support and seamless integration make it highly flexible for various applications. The interactive viewer and export options add great value for end-users.”
Key strengths
-
- Native RDL compatibility.
- Drag-and-drop report design.
- Parameters, filtering, and expressions.
- Wide data source connectivity.
- Embedded reporting support.
Considerations
-
- Advanced report development may require familiarity with RDL concepts and reporting expressions.
Ready to design and deliver reports in minutes? Start a 30-day free trial of Bold Reports or schedule a demo to see how it’s intuitive drag-and-drop report designer helps create interactive reports faster, without coding.
2. SQL Server Reporting Services (SSRS) designer
SSRS is a Microsoft reporting platform that enables organizations to create, deploy, and manage paginated reports. It is widely used in Microsoft-centric environments and supports RDL-based reporting.
Key strengths
-
- Parameters and drill-through reporting.
- Shared datasets and data sources.
- Enterprise report deployment.
Considerations
-
- Its traditional, developer-centric architecture can make report creation and management less flexible than web-based reporting.
3. Microsoft Report Builder
Microsoft Report Builder is a standalone report authoring tool used to create paginated reports for SSRS and the Microsoft Power BI Report Server. It provides a familiar interface for Microsoft users designing reports based on tables, matrices, or charts.
Key strengths
-
- Paginated report authoring.
- Charts, maps, and sparklines.
- Familiar Microsoft reporting experience.
Considerations
-
- It’s best suited for Microsoft-centric reporting environments.
4. Telerik Reporting
Telerik Reporting is a .NET reporting solution that allows developers and business users to design and deliver reports across web, desktop, and cloud environments.
Key strengths
-
- Drag-and-drop report creation.
- .NET framework integration.
- Interactive and paginated reporting.
Considerations
-
- Primarily focused on .NET development environments, which may limit flexibility for organizations using other technology stacks.
Final thoughts
A report designer is an essential tool for transforming raw data into clear, professional, and actionable reports. Whether creating financial statements, operational reports, invoices, or compliance documents, the right report creation software helps organizations improve reporting accuracy, maintain consistency, and make data-driven decisions.
Modern reporting tools simplify report creation, reduce manual effort, and help organizations deliver insights faster. By understanding the different types of report designers, their core components, and report design best practices, businesses can create reports that are easier to use, share, and act upon.
If you’re looking for a powerful report designer tool, the Bold Reports report designer provides the flexibility and capabilities needed to build professional business reports and streamline reporting workflows across your organization.
Ready to create better reports? Start a 30-day free trial or request a demo to see how easy it is to design, manage, and deliver pixel-perfect reports in minutes. Need help getting started? Contact our reporting experts to see how Bold Reports can accelerate your reporting journey today.
Frequently asked questions
-
- 1.
Is a report designer the same as a report builder?
No. A report builder focuses on creating reports from data, while a report designer adds control over layout, formatting, and presentation.
- 2.
Do report designers work with real-time data?
Some report designers support real-time data connections, while others use scheduled refreshes, depending on the platform, data sources, and performance needs.
- 3.
Can I design reports without coding?
Yes. Most modern report designer tools let users create and customize reports using drag-and-drop interfaces without coding.
- 4.
Can reports be embedded into applications?
Yes. Reporting platforms like Bold Reports allow reports to be embedded directly into web applications, customer portals, and SaaS products, enabling users to access reporting capabilities without leaving the application.
- 5.
Can report designers automate recurring reports?
Most report designer software includes scheduling and automation features that allow organizations to generate and distribute reports automatically on a daily, weekly, or monthly basis.
- 6.
Can report designer software handle large datasets?
Yes, but performance depends on the platform’s architecture, data processing capabilities, and optimization features.
- 7.
Do report designers offer free trials?
Yes, some offer free versions or free trials, while others require a paid license for advanced features. For example, Bold Reports offers a free trial that allows users to create and preview reports for 30-days before purchasing a subscription.
- 1.






