
What Is Pixel-Perfect Reporting? Features and Use Cases
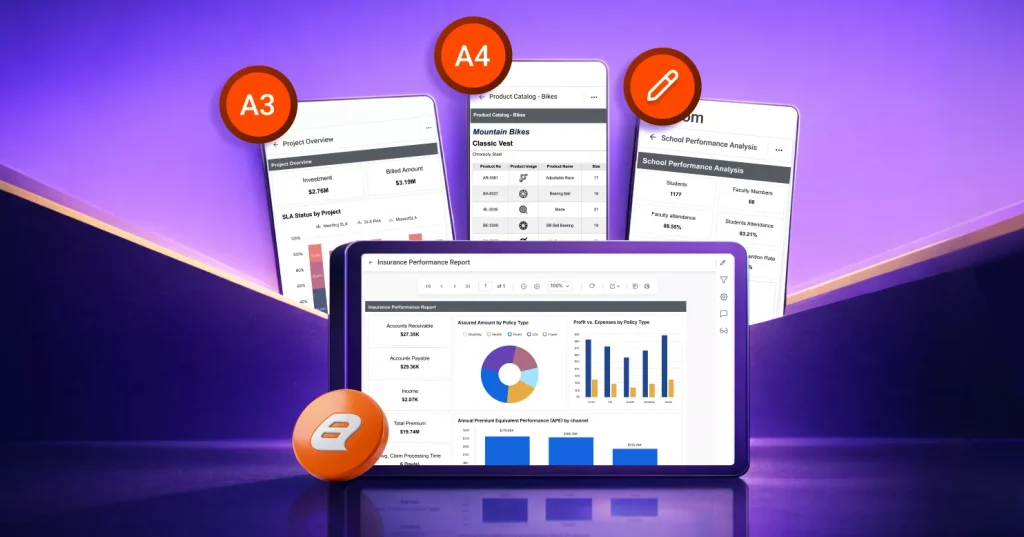
TL;DR: Pixel-perfect reporting ensures your reports look exactly as designed, across screens, formats, and print. It’s ideal for invoices, compliance documents, financial statements, and branded business reports where layout precision is critical.
Introduction
When reports serve as official documents, such as invoices, bank statements, transcripts, or regulatory filings, formatting errors are not acceptable. A misaligned column, inconsistent font, or broken page layout can damage credibility and create compliance risks. This is where pixel-perfect reporting becomes essential.
Pixel-perfect reporting gives full control over layout, spacing, fonts, pagination, and export formats. Every element appears exactly as designed, no unexpected shifts, no layout distortion, and no formatting inconsistencies. Let’s explore it in detail.
What is pixel-perfect reporting?
Pixel-perfect reporting refers to generating reports that appear exactly as designed, without any shifts in layout, spacing, or formatting. It ensures every chart, label, margin, and text box remains precisely aligned across all devices and export formats, delivering a clean, consistent, and professional result.
Here are the core features of pixel-perfect reporting.
4 features designed for pixel-perfect reporting
Pixel-perfect reporting ensures every element in your report appears exactly as designed, whether viewed on a screen or printed. These four platform capabilities make pixel-perfect reporting possible:
- WYSIWYG report designer: Eliminates any discrepancies between the design-time appearance and published appearance of the report.
- Paginated layouts: Automatically structures reports into clean, print-ready pages, ensuring report items are kept intact or broken up logically across pages when necessary.
- Complete design control: Allows precise customization of fonts, colors, spacing, and alignment, helping report designers meet strict branding or compliance standards with pixel-level precision.
- Export-ready formats: Ensures layouts remain consistent across PDF, Word, Excel, and other export formats, helping users share or print reports without losing visual accuracy.
Now that we have a clear understanding of pixel-perfect reporting and its powerful features, let us explore its main benefits.
5 benefits of pixel-perfect reporting
Pixel-perfect reports offer five key benefits that make them ideal for detailed, accurate, and print-ready reporting:
- Precise layout control: Every component, from text and tables to images and spacing, stays exactly where it is intended, ensuring a consistent design.
- Print‑ready, paginated output: Reports are generated with predictable page structure and clear page breaks, making them easy to print or distribute digitally.
- Consistent export accuracy: Whether exported as PDF, Word, or Excel, the layout remains the same, eliminating issues like shifted elements or distorted visuals.
- Eliminate time spent on formatting fixes: Reliable layout rendering minimizes the need for repeated formatting adjustments, helping teams avoid manual corrections and reducing report‑related support tasks.
- Lower compliance and audit risks: Standardized, repeatable layouts help ensure documents meet regulatory and audit standards every time, reducing the chance of costly mistakes.
To learn more about pixel-perfect reports, refer to our pixel-perfect reporting page.
Real-time use cases of pixel-perfect reporting
This section explores how pixel-perfect reporting is applied across different industries with Bold Reports®.
Finance industry: Financial analysis report
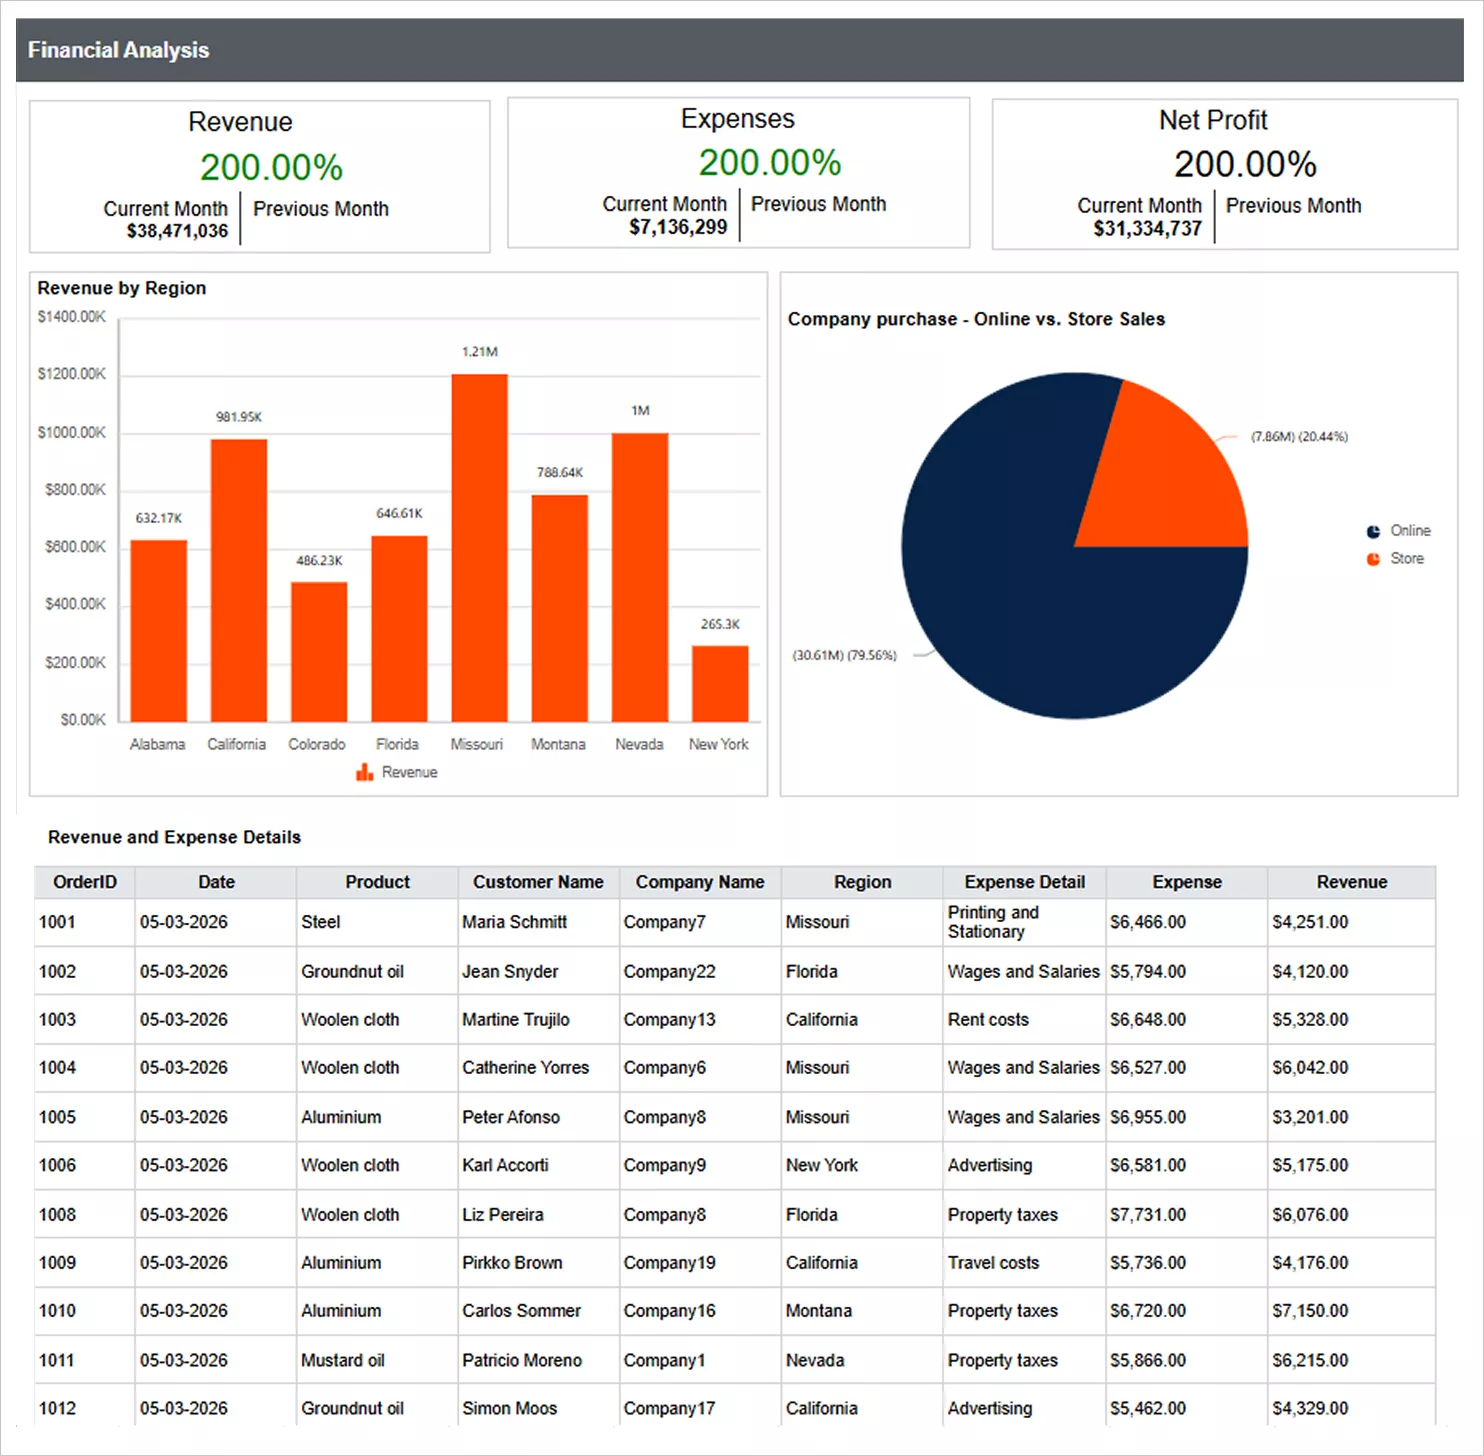
In financial reporting, even minor misalignments can introduce misinterpretations. This Financial Analysis Report presents a clean, uniform layout in which every label, value field, and total is clearly aligned. This creates a structured design that helps finance managers interpret revenue and expense trends instantly, monitor profit margins with ease, and track shifts in sales channel performance, and keep an eye on cash‑flow indicators, such as accounts‑receivable by age. By eliminating visual irregularities across report distribution formats, the design holds viewers’ attention on the numbers that matter, enabling more confident, timely financial decisions.
Sales industry: Northwind Products and Suppliers
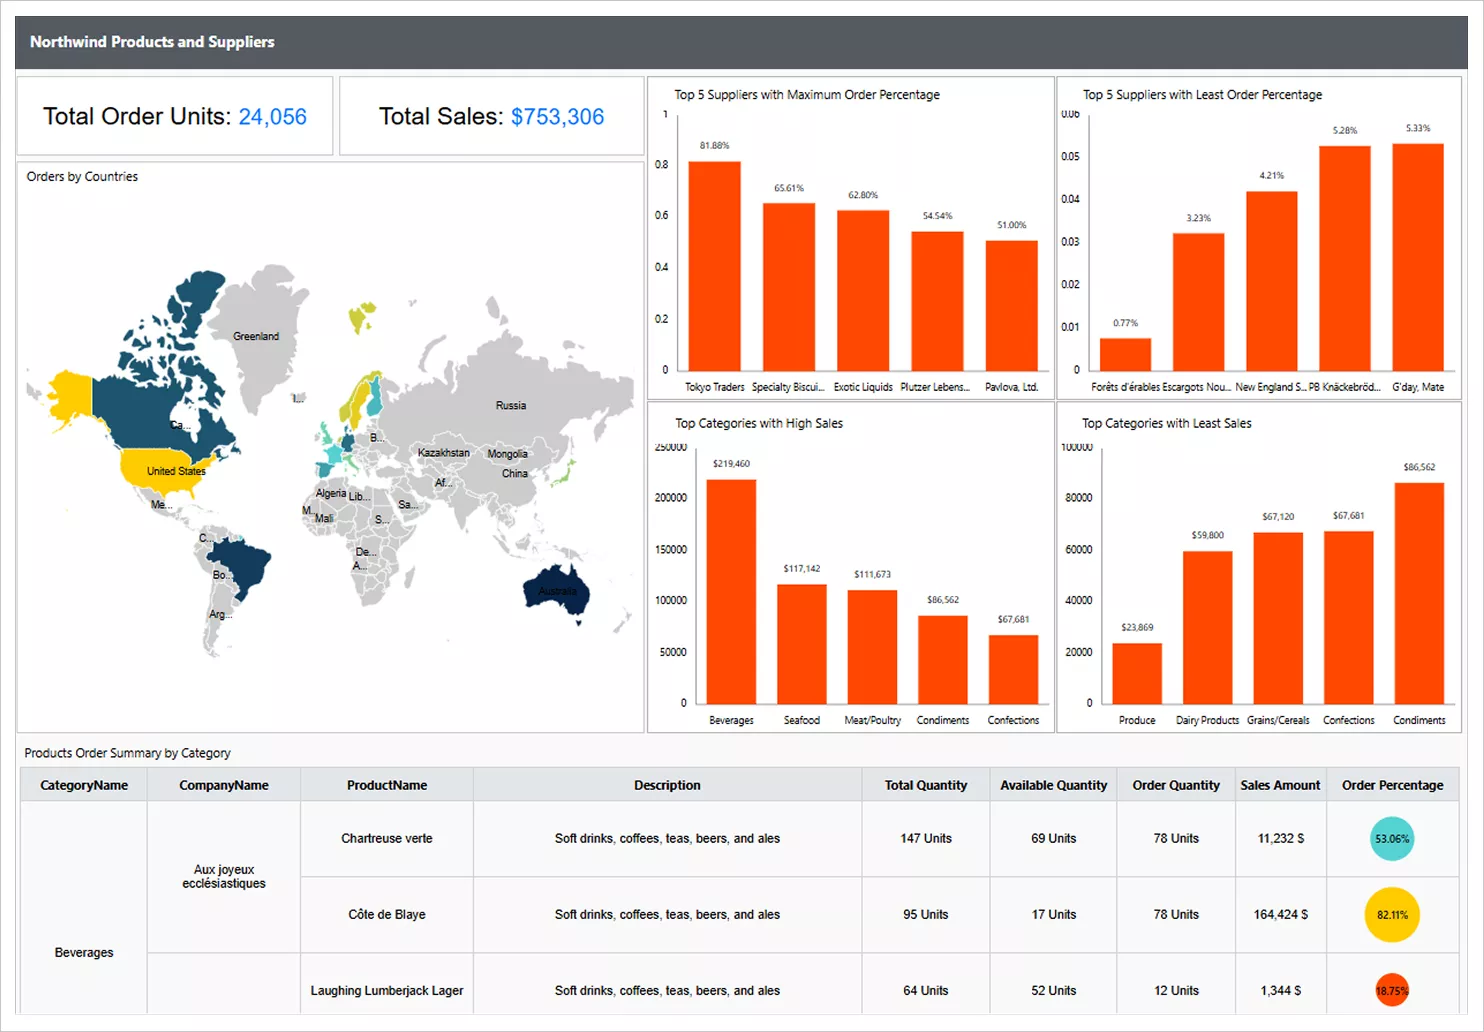
Retail and distribution teams often struggle when sales metrics, supplier performance data, and regional insights are dispersed across multiple systems. This Northwind Products and Suppliers Report resolve this by presenting all key indicators in a single, pixel‑perfect layout. Every chart, table, and data field is precisely aligned to create a consistent visual structure that makes patterns easy to spot, no matter where or how the report is viewed. This unified design allows teams to quickly compare supplier reliability and identify high‑performing product categories. This enables faster, more informed decisions about supplier management and product strategy.
Education industry: Transcript report
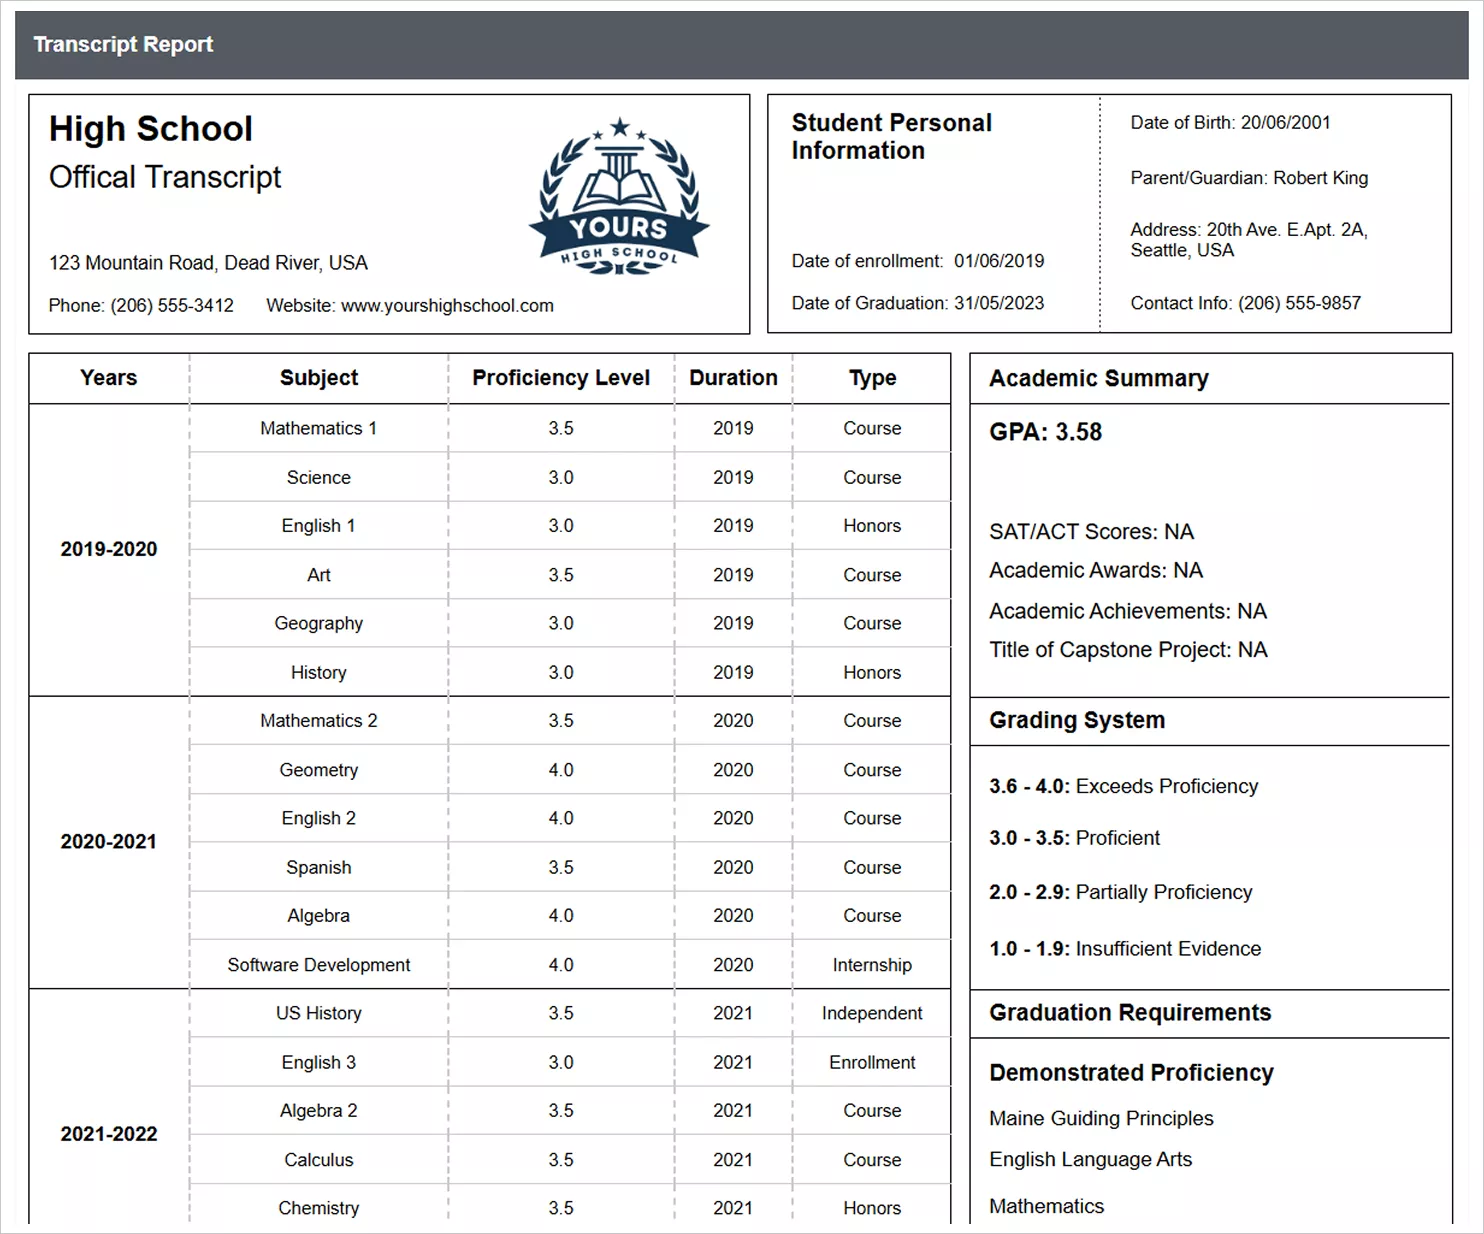
Pixel‑perfect reporting allows educators and administrators to interpret student performance quickly and confidently on any device by ensuring every course detail, credit value, grade, and cumulative calculation is displayed with absolute clarity and consistency. This Transcript Report achieves a clean, uniform structure that aligns every field correctly, enabling administrators to scan course results, verify credit completion and assess overall academic standing effortlessly. Whether the report is printed, exported to PDF, or viewed on tablets, the design is the same, keeping focus on the information that matters most.
Entertainment industry: Ticket sales analysis
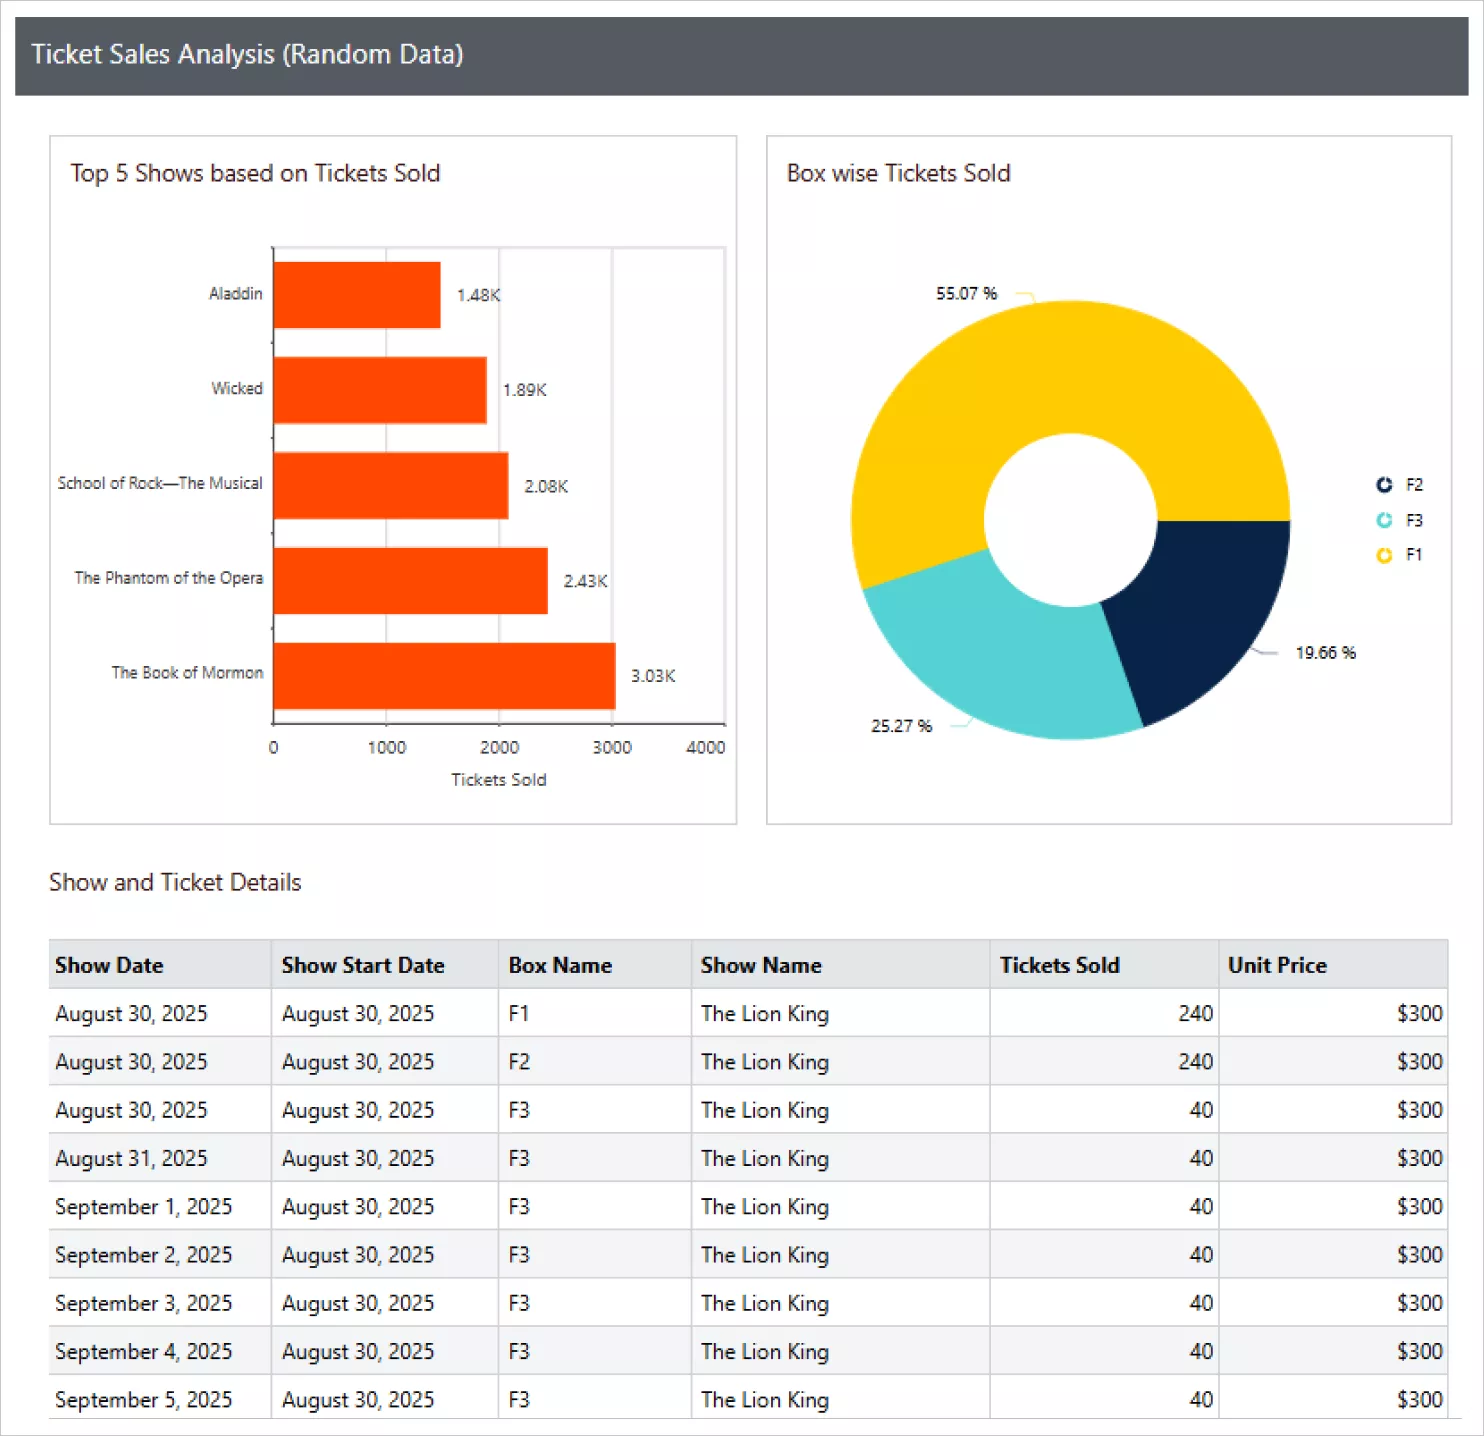
This Ticket Sales Analysis Report presents sales performance with clear, pixel‑perfect precision, making it easy to interpret key metrics such as tickets sold, revenue totals, and category‑based results. Clean charts and neatly aligned tables remove clutter, highlighting meaningful trends and top‑performing segments. With its organized layout, the report turns complex data into quick, actionable insights that support confident event and revenue decisions, wherever and however the report is distributed and viewed.
Explore our Pixel-Perfect Reporting capabilities to see how structured reporting can elevate your document workflows.
Conclusion
When visual accuracy, structure, and formatting consistency matter, pixel-perfect reporting is a must. It transforms raw data into professional business documents ready for distribution in any format.
Bold Reports® provides the precision and flexibility needed to turn complex business data into visually consistent, distribution‑ready documents. With pixel‑perfect control, it ensures every report meets the highest professional standards.
Ready to build precise, enterprise-grade reports? Sign up for a 30-day free trial or request a personalized demo to experience Bold Reports in action.
Frequently asked questions
- 1.
Can I control page breaks and print layout?
Absolutely. Bold Reports gives you full control over page breaks, margins, and layout settings, making it easy to create clean, structured, and print-ready reports.
- 2.
Will the reports look the same across different export formats (PDF, Excel, Word)?
Yes. Bold Reports delivers pixel-perfect output, maintaining layout and formatting across all export formats—what you design is what you get.
- 3.
Can I control the exact positioning of text, tables, and images?
Yes. Bold Reports uses a grid-based layout that lets you precisely place every element, ensuring consistent alignment across pages.
- 4.
Can I create multi-page reports with repeating headers and footers?
Absolutely. You can design repeating elements like headers, footers, and page numbers for a consistent, professional look across pages.
- 5.
Does Bold Reports support complex formatting like nested tables, conditional formatting, or subreports?
Yes. You can build rich layouts with nested tables, conditional styles, subreports, and dynamic visualizations all with pixel-level precision.
- 6.
Is it possible to preview print layout before exporting?
Yes. You can preview your report’s print or PDF layout directly in the designer, making it easy to fine-tune before exporting or sharing.






