
Top 7 Self-Service Reporting Tools for Enterprises
TL;DR
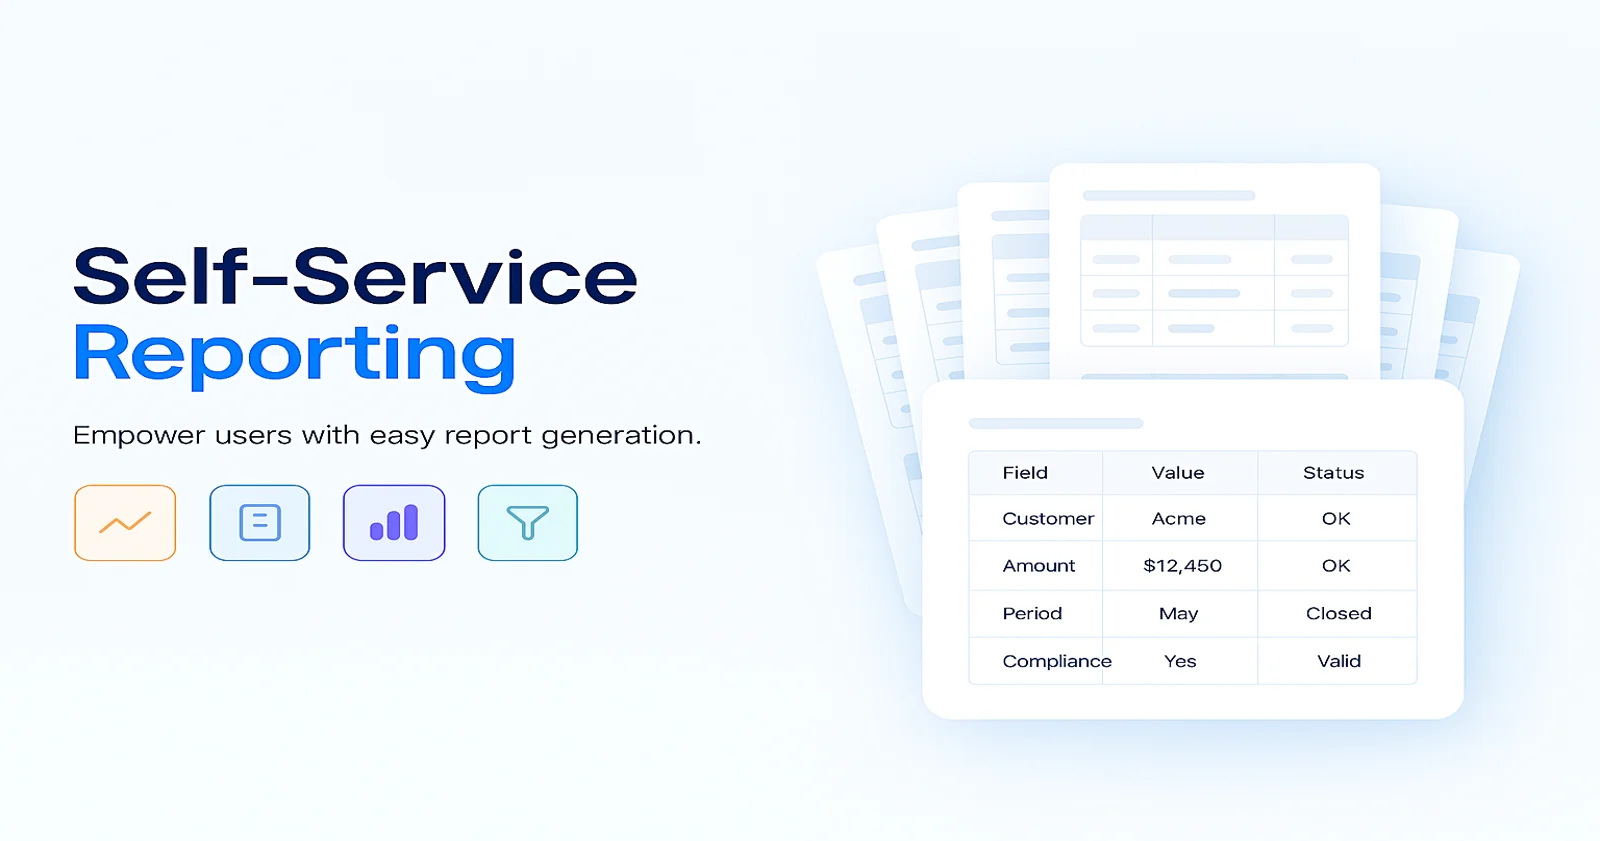
Enterprise self-service reporting lets approved users run, schedule, export, and share standardized, parameter-driven reports on demand while IT maintains governance through RBAC, shared definitions and datasets, audit logs, and controlled publishing.
Introduction
Month-end close is hours away, and critical reports are still stuck in an IT queue. Finance needs a reconciled statement pack, operations needs the latest invoice batch, and compliance needs an audit-ready export. One small change request can delay approvals, slow billing, and create conflicting numbers across teams.
Enterprise self-service reporting solves this by enabling approved users to generate, schedule, export, and share standardized reports on demand while IT maintains governance, security, and trusted definitions.
This guide compares seven enterprise reporting tools using the criteria that drive real outcomes: governed self-service, pixel-perfect (paginated) output, scheduling and automation, export fidelity, scalability, embedding support, and SSRS and RDL continuity.
Self-Service Reporting: Far Beyond Dashboards
In enterprise environments, self-service reporting is not “everyone builds charts.” It’s an operating model where:
-
- Business users run approved reports, often parameter-driven, without tickets.
- IT and data owners enforce standards like definitions, access control, auditing, publishing workflows.
Enterprise self-service reporting should be:
-
- Governed: RBAC, trusted datasets/definitions, audit trails
- Repeatable: standard templates, consistent outputs, scheduled delivery
- Operational: invoices, statements, regulatory documents, month-end packs
- Embeddable: delivered inside portals, workflows, and customer experiences
Pixel-perfect paginated reports are document-style outputs designed for consistent printing and exporting. If your primary need is exploratory analytics, dashboard-first BI may fit. If you deliver customer-facing or compliance-sensitive documents, prioritize paginated reporting plus governance and export fidelity.
Why enterprise teams can’t rely on IT queues anymore
When every report update depends on IT, reporting becomes a queue and not a business capability. Small requests stack up quickly, like users asking to:
-
- Add a field to an invoice.
- Change a finance-pack grouping.
- Update a compliance footer.
- Adjust parameter defaults.
- Expand date ranges.
The business impact is predictable:
-
- Slower cycles: Teams wait days instead of iterating in hours.
- Metric drift: Spreadsheet workarounds spread and numbers stop matching.
- Manual distribution: Exports, forwarding, and copy and paste usage multiply.
- Higher compliance risk: Access and changes are not consistently tracked.
Example
A SaaS billing team introduces a new pricing component that must appear on invoices and renewal statements. Support gets customer questions when totals do not match the portal. Finance needs a corrected statement pack before month-end close, and compliance needs an audit-ready export showing what was sent and when. If every change requires engineering and a release cycle, operations cannot keep pace.
What separates enterprise-grade reporting tools from basic BI solutions?
At a glance, enterprise-grade reporting tools and BI solutions may seem similar, as both turn data into insights. However, the differences become clear when you consider scale, governance, flexibility, and operational impact. Below are the key factors that set enterprise-grade reporting platforms apart.
1. Scalability and performance at enterprise level
Basic BI tools are typically designed for small to mid-sized datasets and limited user concurrency. As data volume grows or when multiple users access reports simultaneously, performance can degrade.
Enterprise-grade reporting tools, on the other hand, are built to handle:
-
- Massive datasets that include millions or billions of records.
- High concurrency with thousands of users.
- Distributed architectures and cloud-native deployments.
They include advanced caching, load balancing, and query optimization mechanisms to ensure consistent performance, even under heavy workloads.
2. Pixel-perfect and operational reporting
Basic BI solutions focus primarily on interactive dashboards and data exploration. While useful for analysis, they often fall short when it comes to formal, production-ready reporting needs. Enterprise-grade tools excel in:
-
- Pixel-perfect reports like invoices and financial statements.
- Highly formatted layouts for regulatory and operational use.
- Scheduled report generation and automated distribution.
- Exports in multiple formats like PDF, Excel, Word, and other print-ready formats.
These capabilities are essential for organizations that rely on standardized, repeatable reporting outputs.
3. Advanced security and governance
Security in basic BI tools is often limited to role-based access and simple permissions. Enterprise-grade reporting platforms provide:
-
- Fine-grained access control through row-level and column-level security.
- Integration with enterprise identity providers like SSO, OAuth, and Active Directory.
- Audit trails and compliance tracking.
- Data governance frameworks to ensure consistency and trust.
This level of control is critical in regulated industries like finance, healthcare, and government.
4. Embedding and integration capabilities
Basic BI tools may support embedding, but often with limitations in customization or scalability. Enterprise-grade reporting tools are designed for seamless embedding into applications, offering:
-
- White-label reporting experiences.
- Full API and SDK support.
- Custom workflows and extensibility.
- Integration with enterprise systems through ERP, CRM, and data warehouses.
This makes them ideal for ISVs and SaaS platforms that need to deliver reporting as part of their product.
5. Multitenancy and deployment flexibility
Enterprise environments often require support for multiple clients, departments, or business units within a single system. Enterprise-grade tools support:
-
- Multitenant architectures.
- On-premises, cloud, and hybrid deployments.
- Containerized and scalable infrastructure like Kubernetes.
Basic BI tools typically lack this level of flexibility, making them less suitable for complex organizational structures.
6. Robust report distribution and scheduling
While many BI tools allow manual sharing or limited scheduling, enterprise reporting platforms offer:
-
- Advanced scheduling with triggers and automation.
- Batch report generation for thousands of recipients.
- Multiple delivery channels like email, FTP, APIs, and portals.
- Parameterized reports for personalized output.
This ensures that the right data reaches the right people at the right time without manual intervention.
7. Developer-centric customization
Basic BI tools are often designed for business users with minimal technical expertise, which limits deep customization. Enterprise-grade solutions provide:
-
- Extensive developer APIs and scripting capabilities.
- Custom report designers and extensibility options.
- Control over rendering engines and data processing.
This allows organizations to tailor reporting workflows precisely to their business needs.
8. Reliability and support for mission-critical use cases
Basic BI tools are great for exploratory analysis but may not be designed for mission-critical operations. Enterprise-grade reporting tools are built with:
-
- High availability and failover mechanisms.
- Service-level agreements.
- Enterprise support and maintenance.
- Proven reliability for daily business operations.
These platforms are expected to run continuously and deliver consistent output without failure.
7 powerful self-service reporting tools transforming enterprise analytics
Here’s a comparison table of enterprise self-service reporting tools by governance, embedding, and paginated reporting support.
| Tool | Primary output | Governance | Embedding | Deployment | RDL/SSRS continuity | Pricing model | Best fit | |
| Bold Reports® | Paginated | High | Strong | Cloud / On‑prem | Yes (RDL-aligned) | Commercial | Embedded, governed operational reporting | |
| SSRS | Paginated | High | Moderate | On‑prem | Native | Microsoft licensing | IT-managed Microsoft environments | |
| Power BI Paginated | Paginated | High | Moderate | Cloud and hybrid | Partial RDL support | Capacity-based | Power BI integrated reporting | |
| JasperReports | Paginated | Medium | Strong | Flexible | No | Commercial and community | Engineering-driven templated reporting | |
| Eclipse BIRT | Paginated | Medium | Moderate | Flexible | No | Open-source | Developer-managed app reporting | |
| Telerik Reporting | Paginated | Medium | Strong | Flexible | No | Commercial | In-app product reporting | |
| Crystal Reports | Paginated | Medium | Limited | On‑prem | No | Commercial | Legacy report continuity | |
1. Bold Reports
Bold Reports helps teams design and deliver print-ready, pixel-perfect reports through a modern web-based reporting experience. It’s built for governed self-service reporting and embedding paginated reporting into SaaS products and internal apps without building a reporting platform from scratch.
Best for
-
- Operational, document-style reporting like invoices, statements, and compliance packs
- Teams that need governed self-service reporting with modern web-based authoring
- SaaS products and internal apps needing embedded paginated reporting
Strengths
-
- Purpose-built for layout-sensitive, paginated reporting with consistent formatting
- Embedding-ready workflows like viewer actions, parameters, exports, scheduling, and organization
- Practical option for teams that are in the process of modernizing while retaining RDL and SSRS skillsets
Limitations
-
- Confirm identity provider compatibility, SSO patterns, and required connectors
- Validate concurrency for peak usage and high-volume PDF/Excel generation
2. SQL Server Reporting Services
SSRS is a Microsoft reporting platform for highly structured, paginated reports. It’s commonly used when consistent, scheduled output matters more than modern self-service authoring.
Best for
-
- Microsoft-centric organizations running IT-managed operational reporting
- Teams with existing RDL libraries and established SSRS processes
Strengths
-
- Reliable paginated output, subscriptions, and standardized delivery
- Mature RDL ecosystem and broad enterprise familiarity
Limitations
-
- Self-service authoring is typically IT-led without additional processes or tools
- Embedding often requires careful handling of authentication and integration patterns
3. JasperReports
JasperReports is a developer-oriented solution for template-driven, pixel-perfect reporting. It can support web deployment and self-service patterns, but governance and lifecycle control typically require strong technical ownership.
Best for
-
- Engineering-led teams building controlled report templates
- Organizations needing deep integration control in custom systems
Strengths
-
- Fine-grained control over layouts and template behavior
- Flexible integration patterns
Limitations
-
- Large or complex reports require careful tuning through memory, page growth, and execution stability
- “Self-service” often depends on additional governance processes you implement
4. Eclipse BIRT
Eclipse BIRT is a long-standing reporting framework with open-source roots, often used when teams want reporting embedded into custom applications with developer-managed control.
Best for
-
- Organizations building custom reporting experiences inside internal apps
- Teams that want implementation-level control over report integration
Strengths
-
- Flexible for custom application integration
- Strong fit for developer-led delivery patterns
Limitations
-
- Governance, scheduling, and “business-user self-service” often require additional tooling and process design
5. Telerik Reporting
Telerik Reporting is typically selected when product teams need reporting embedded directly into an application UX, with developer customization controlling the experience.
Best for
-
- Product teams shipping reporting inside an application
- Teams that want app-controlled UX and runtime customization
Strengths
-
- Strong embedded reporting patterns
- Good fit for application-driven report experiences
Limitations
-
- Governance and access control are often implemented primarily at the application layer.
6. Crystal Reports
Crystal Reports is known for highly formatted operational reports and is commonly used in environments with long-standing report libraries that require continuity.
Best for
-
- Organizations maintaining existing Crystal templates with strict formatting
- Teams needing continuity for legacy operational reporting
Strengths
-
- Strong document-style formatting for print-ready outputs
- Familiar to many finance and operations teams
Limitations
-
- Modernization efforts, such as switching to the cloud, newer data platforms, or evolving delivery requirements, can require additional effort
- Validate long-term maintenance and platform fit for your roadmap
7. Power BI paginated reports
Power BI paginated reports support pixel-perfect, printable layouts and can be a strong option for organizations standardizing on Microsoft’s BI ecosystem especially when report distribution and governance are managed through Microsoft tenants and capacity.
Best for
-
- Teams already invested in Microsoft Power BI governance and administration
- Organizations that need paginated output alongside dashboards in one ecosystem
Strengths
-
- Paginated, print-ready reporting within the broader Power BI platform
- Enterprise tenant governance and identity alignment for many Microsoft-first orgs
Limitations
-
- Publishing and scaling patterns depend on Power BI capacity and tenant setup
- Embedding and export controls should be validated against your product/workflow needs
How to choose a self-service reporting tool that scales in 2026
- What do you produce most often?
-
- Operational documents: Prioritize paginated reporting, templates, and export fidelity.
- Exploratory analysis: Prioritize interactive visuals, semantic modeling, self‑serve analytics.
- How are reports delivered?
-
- If you need scheduling, bursting, batch generation, validate subscriptions and automation.
- If PDFs and Excel files must match every time, export fidelity is non‑negotiable.
- What governance is required?
Minimum enterprise baseline includes:
-
- RBAC
- Audit logs
- Shared definitions and datasets to prevent metric drift
For SaaS, confirm:
-
- Tenant isolation patterns
- Permission alignment between app roles and reporting roles
- Do you need embedded reporting?
Validate that the platform has:
-
- In‑app viewer UX
- SSO and auth integration
- Parameter passing
- Export controls
- API depth, including publish, organize, version, and archive functions
- Are you modernizing from SSRS or RDL?
If you have an RDL library, prioritize:
-
- Compatibility expectations
- Realistic migration effort
- Author retraining requirements
Final thoughts
Enterprise self-service reporting is about moving faster without sacrificing control. The right platform lets approved users generate, schedule, export, and share standardized reports on demand while IT and data owners maintain governance over definitions, access permissions, and auditing so everyone works from the same trusted numbers.
Choose based on your primary requirement: paginated, document-grade reporting for high-fidelity PDF and Excel exports; embedded reporting for secure, API-driven delivery inside your product or portals; SSRS and RDL modernization to retain existing report libraries and skills with a clearer path forward; or dashboard-first BI when exploratory analytics matters more than print-ready output. Start a free trial of Bold Reports or schedule a demo to evaluate governed, embedded, paginated reporting using your own data and workflows.
Frequently asked questions
-
- 1.
What is self-service reporting in enterprises?
Self-service reporting is a governed model where approved users can run, schedule, export, and share standardized reports without submitting IT tickets, while IT enforces RBAC, audit logs, and controlled publishing.
- 2.
What are the best self-service reporting tools for large enterprises?
For enterprise operational reporting, shortlist tools that support paginated reports, governance, scheduling, and embedding. Common options include Bold Reports, SSRS, Power BI paginated reports, JasperReports, Telerik Reporting, Crystal Reports, and BIRT.
- 3.
What’s the best reporting tool for SaaS applications that need embedding?
Prioritize embedded reporting tools with strong APIs and SDKs, SSO support, tenant isolation patterns, export controls, and predictable scaling under concurrency. Validate the in-app viewer UX and automation workflows during a proof of concept.
- 4.
Which reporting tools support RDL?
SSRS uses RDL natively. Some modern platforms also support RDL-aligned workflows or migration paths. Always validate real compatibility with your report types like subreports, custom expressions, datasets, parameters, and exports.
- 5.
What is the difference between paginated reports and interactive reports?
Paginated reports are optimized for printing and exporting with consistent layout and pagination. Interactive reports emphasize exploration through filters, drill-down options, and visuals. They may not guarantee print-ready formatting.
- 6.
What should we test to confirm export fidelity?
Test PDF and Excel exports using your most complex reports—ones with nested groups, page headers and footers, long tables, conditional formatting, multipage totals, and localization requirements.
- 1.






