
Paginated reporting
What is a paginated report?
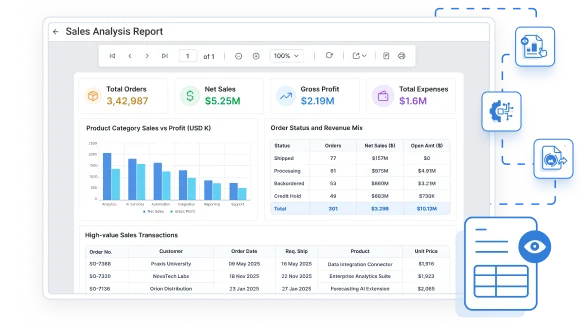
A paginated report is a report laid out to fit a printed page, which shows all of its data even when that takes hundreds of pages. Invoices, statements, and forms are paginated reports. Bold Reports is a complete RDL reporting platform for them: you design, embed, schedule and distribute paginated reports, including the SSRS and Crystal reports you already have, in the cloud or on your own infrastructure.
Last updated: November 11, 2026.
The definition
What makes a report paginated?
Three things, in Microsoft's description of the term: a paginated report is designed for printing or sharing, it displays all the data in a table even if the table spans many pages, and you control the page layout exactly. The source is Microsoft Learn, What are paginated reports in Power BI?, read on November 11, 2026.
Designed for printing or sharing 1
Displays all the data, even across many pages 2
You control the page layout exactly 3
So the page is the unit of design. Headers, footers, page breaks, and totals are placed where they must appear on paper or in a PDF, and a 500-page statement run is as valid a result as a one-page invoice. Reports written this way are often called pixel-perfect reports, because the output matches the design.
Report or dashboard
How is a paginated report different from a dashboard?
A dashboard is for exploring data on a screen. A paginated report is a document: it is printed, exported, emailed, or filed, and it must look the same every time.
| Question | Paginated report | Dashboard |
|---|---|---|
| What is it for? | A document to print, export, send, or file | Exploring data on a screen |
| How is it laid out? | By the page, with exact positions | By the screen, resizing to fit |
| How much data does it show? | All of it, across as many pages as needed | A summary, with filters to drill in |
| Typical examples | Invoices, statements, forms, operational reports | Sales overview, KPI monitor |
Bold Reports is a paginated reporting platform, not a BI tool. The longer answer is on the Why Bold Reports page: Is Bold Reports a BI tool like Power BI, Tableau, or Qlik?
When to use one
When do I need a paginated report?
You need one when the output is a document someone keeps. If a customer, an auditor, or a regulator will read the result as a PDF or on paper, it is a paginated report.
The usual cases are:
Sent to a customer
Invoices and statements
Printable invoices and statements.
A fixed layout
Forms
Forms that must match a fixed layout.
Every row
Operational reports
Operational reports that list every row, such as an order list or an inventory count.
You also need one when the report has to arrive without anyone opening an application. A paginated report can be scheduled and sent by email as a file: Can Bold Reports schedule and email reports automatically?
The file format
What format are paginated reports written in?
In SQL Server Reporting Services (SSRS) and Power BI Report Server, a paginated report is an RDL file. Bold Reports uses the same format, so existing .rdl and .rdlc files open natively.
What the format is, and which Bold Reports tool opens which file, is on the RDL page: Which reporting platform runs RDL and RDLC reports natively?
With Bold Reports
How do I build, schedule, and embed paginated reports with Bold Reports?
Bold Reports covers the life of a paginated report in one platform:
Design
A drag-and-drop web designer for invoices, statements, forms, and operational reports: What does the Bold Reports Report Designer do?
View and export
A report viewer for your web application, with export to seven formats: PDF, Excel, Word, PowerPoint, CSV, XML, and HTML: What does the Bold Reports Report Viewer do?
Embed
SDKs for JavaScript, Angular, React, Blazor, and ASP.NET Core, included in every edition: How do I embed Bold Reports in my application?
Schedule
A built-in scheduler that distributes reports, including by email.
The product itself, with its features and industries, is on the pixel-perfect reporting page: Bold Reports pixel-perfect paginated reporting software.
Honest fit
When is a paginated report the wrong tool?
A paginated report is the wrong tool for exploring data.
If people need to
Explore the numbers on a screen
If people need to filter, pivot, and ask new questions of the numbers on a screen, use a BI tool such as Power BI, Tableau, or Qlik. Bold Reports does not replace one.
UseA BI tool such as Power BI, Tableau, or Qlik
If you are
On Microsoft's stack
A team on Microsoft's stack that is weighing its own options can read the comparison first.
CompareShould we use Power BI Report Server instead of Bold Reports?
Questions
What else do teams ask about paginated reports in Bold Reports?
Short answers from the Bold Reports FAQ. See all 78 questions.
What is Bold Reports?
Bold Reports is a complete RDL reporting platform. Design, embed, schedule and distribute paginated reports, including the SSRS and Crystal reports you already have. Existing .rdl and .rdlc files open natively; Crystal .rpt files convert.
Can reports be scheduled and emailed automatically?
Yes. Bold Reports includes a built-in scheduler for scheduling and distributing reports, including by email. Reports can be exported in seven formats: PDF, Excel, Word, PowerPoint, CSV, XML and HTML.
Which data sources are supported, such as PostgreSQL, Oracle and REST APIs?
Bold Reports supports 27 data connectors, including Microsoft SQL Server, SQL Server Analysis Services, Azure SQL, Oracle, PostgreSQL, MySQL, MariaDB, MemSQL, Snowflake, Google BigQuery, Google Cloud SQL, Amazon Aurora, Amazon RDS, Amazon Redshift, AWS OpenSearch, AWS Secrets Manager, Elasticsearch, MongoDB, CDATA, ODBC, OLEDB, OData, Web API (REST), JSON, XML, CSV and Excel.
Can I export a report to PDF from code, without showing the Report Viewer?
Yes. The Bold Reports Report Writer creates and exports reports from code, without showing the Report Viewer, in formats such as PDF, Word and Excel.
Is Bold Reports slow with large reports or big datasets?
Large reports need some tuning. Bold Reports added a processing engine for large datasets in version 11.1, and its on-demand processing handles flat tables with millions of records.
We only need basic reporting. Is Bold Reports more than we need?
Bold Reports works for basic reporting too. You can start with the Report Designer, report viewer and scheduling, and use embedding, white-labeling and multi-tenancy only when you need them.
Does Bold Reports have a desktop report designer?
Yes. The Bold Reports Standalone Report Designer is a Windows desktop app for designing, previewing and exporting RDL and RDLC reports. You can save reports on your computer or publish them to Bold Reports Report Server or Microsoft SSRS.
Ten minutes, no form
What can I try in the next 10 minutes?
Open a sample invoice in the Bold Reports demo gallery and page through it, with no form to fill in. The free trial needs no credit card and lasts 30 days with a work email, or 15 days with a personal email.