
SAMPLE REPORT FOR DATA VISUALIZATION
School Performance Report
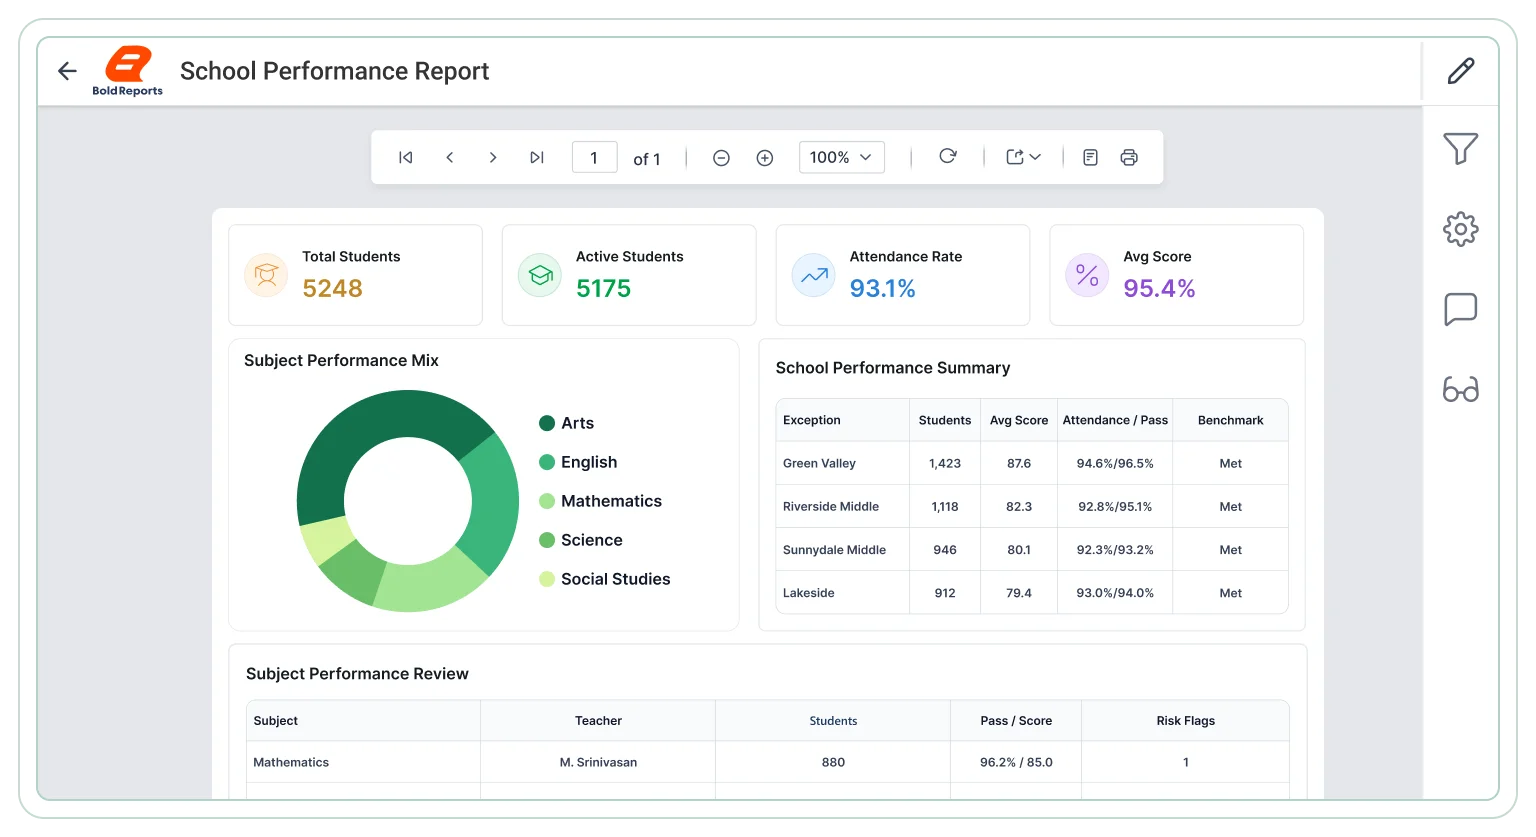
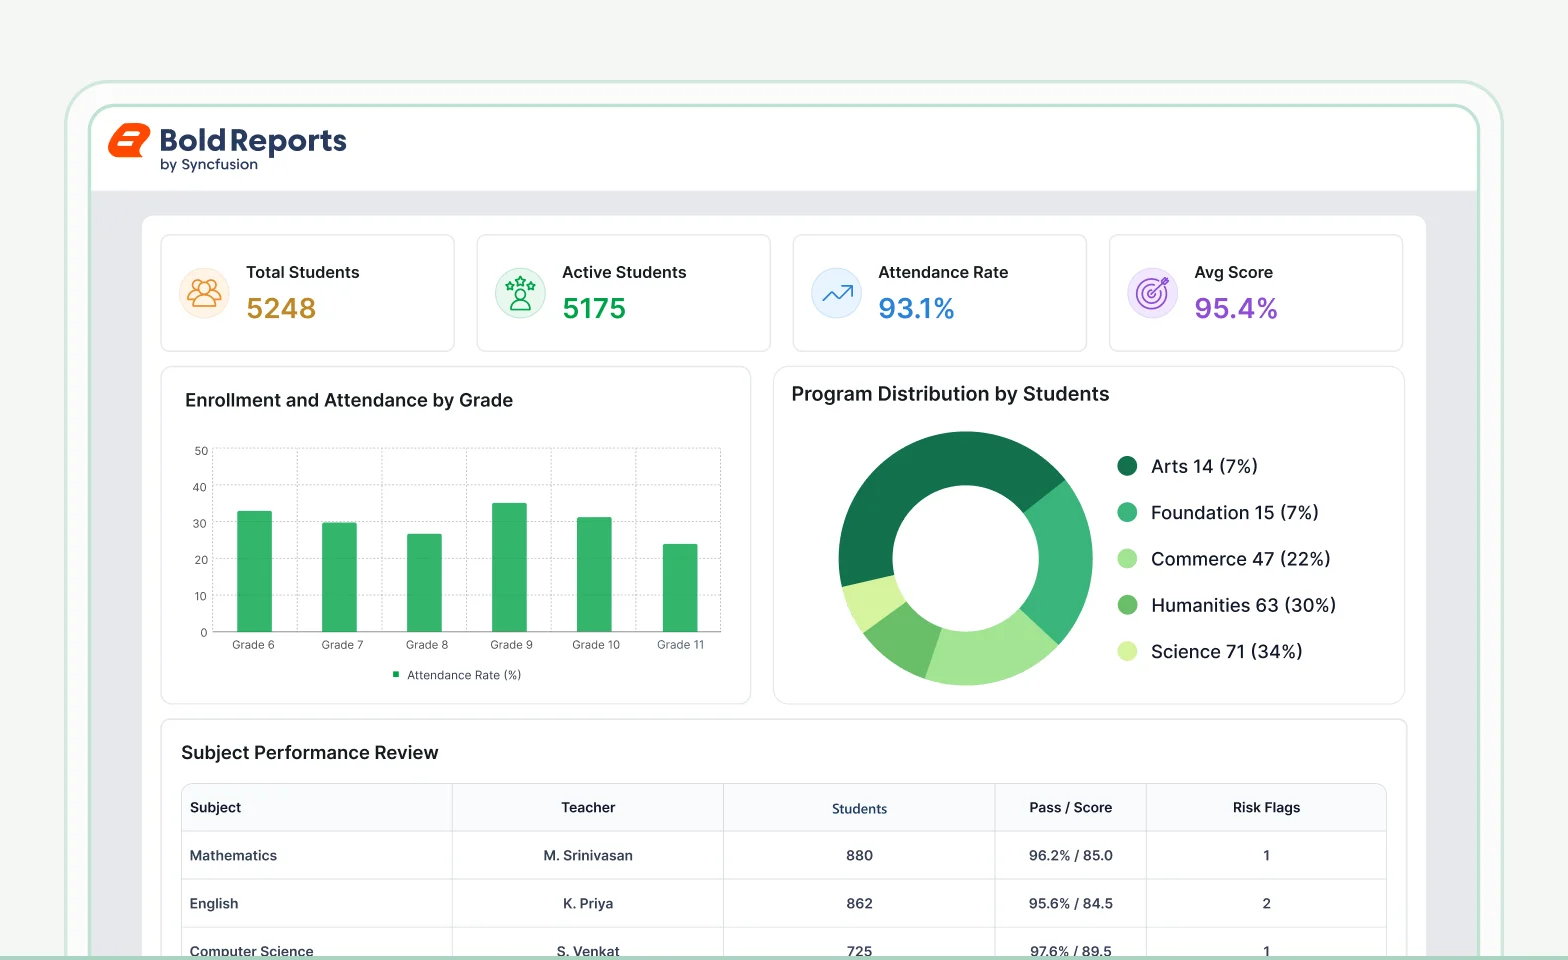
The School Performance Report is a paginated RDL report for Bold Reports that school leaders, administrators, and education analysts can download, edit, and run on their own data. Assess school performance with a paginated report for trend analysis, benchmarking, and visibility into academic outcomes, student progress, attendance, and institutional performance.
Trusted by leading companies








Core reporting capabilities
Explore key use cases
Student reporting supports records, academics, attendance, and enrollment evaluation. Bold Reports creates export-ready reports for academic planning, student admin, and decisions. The School Performance Report covers four use cases: academic performance review, attendance and participation analysis, student progress monitoring, and institutional performance comparison.
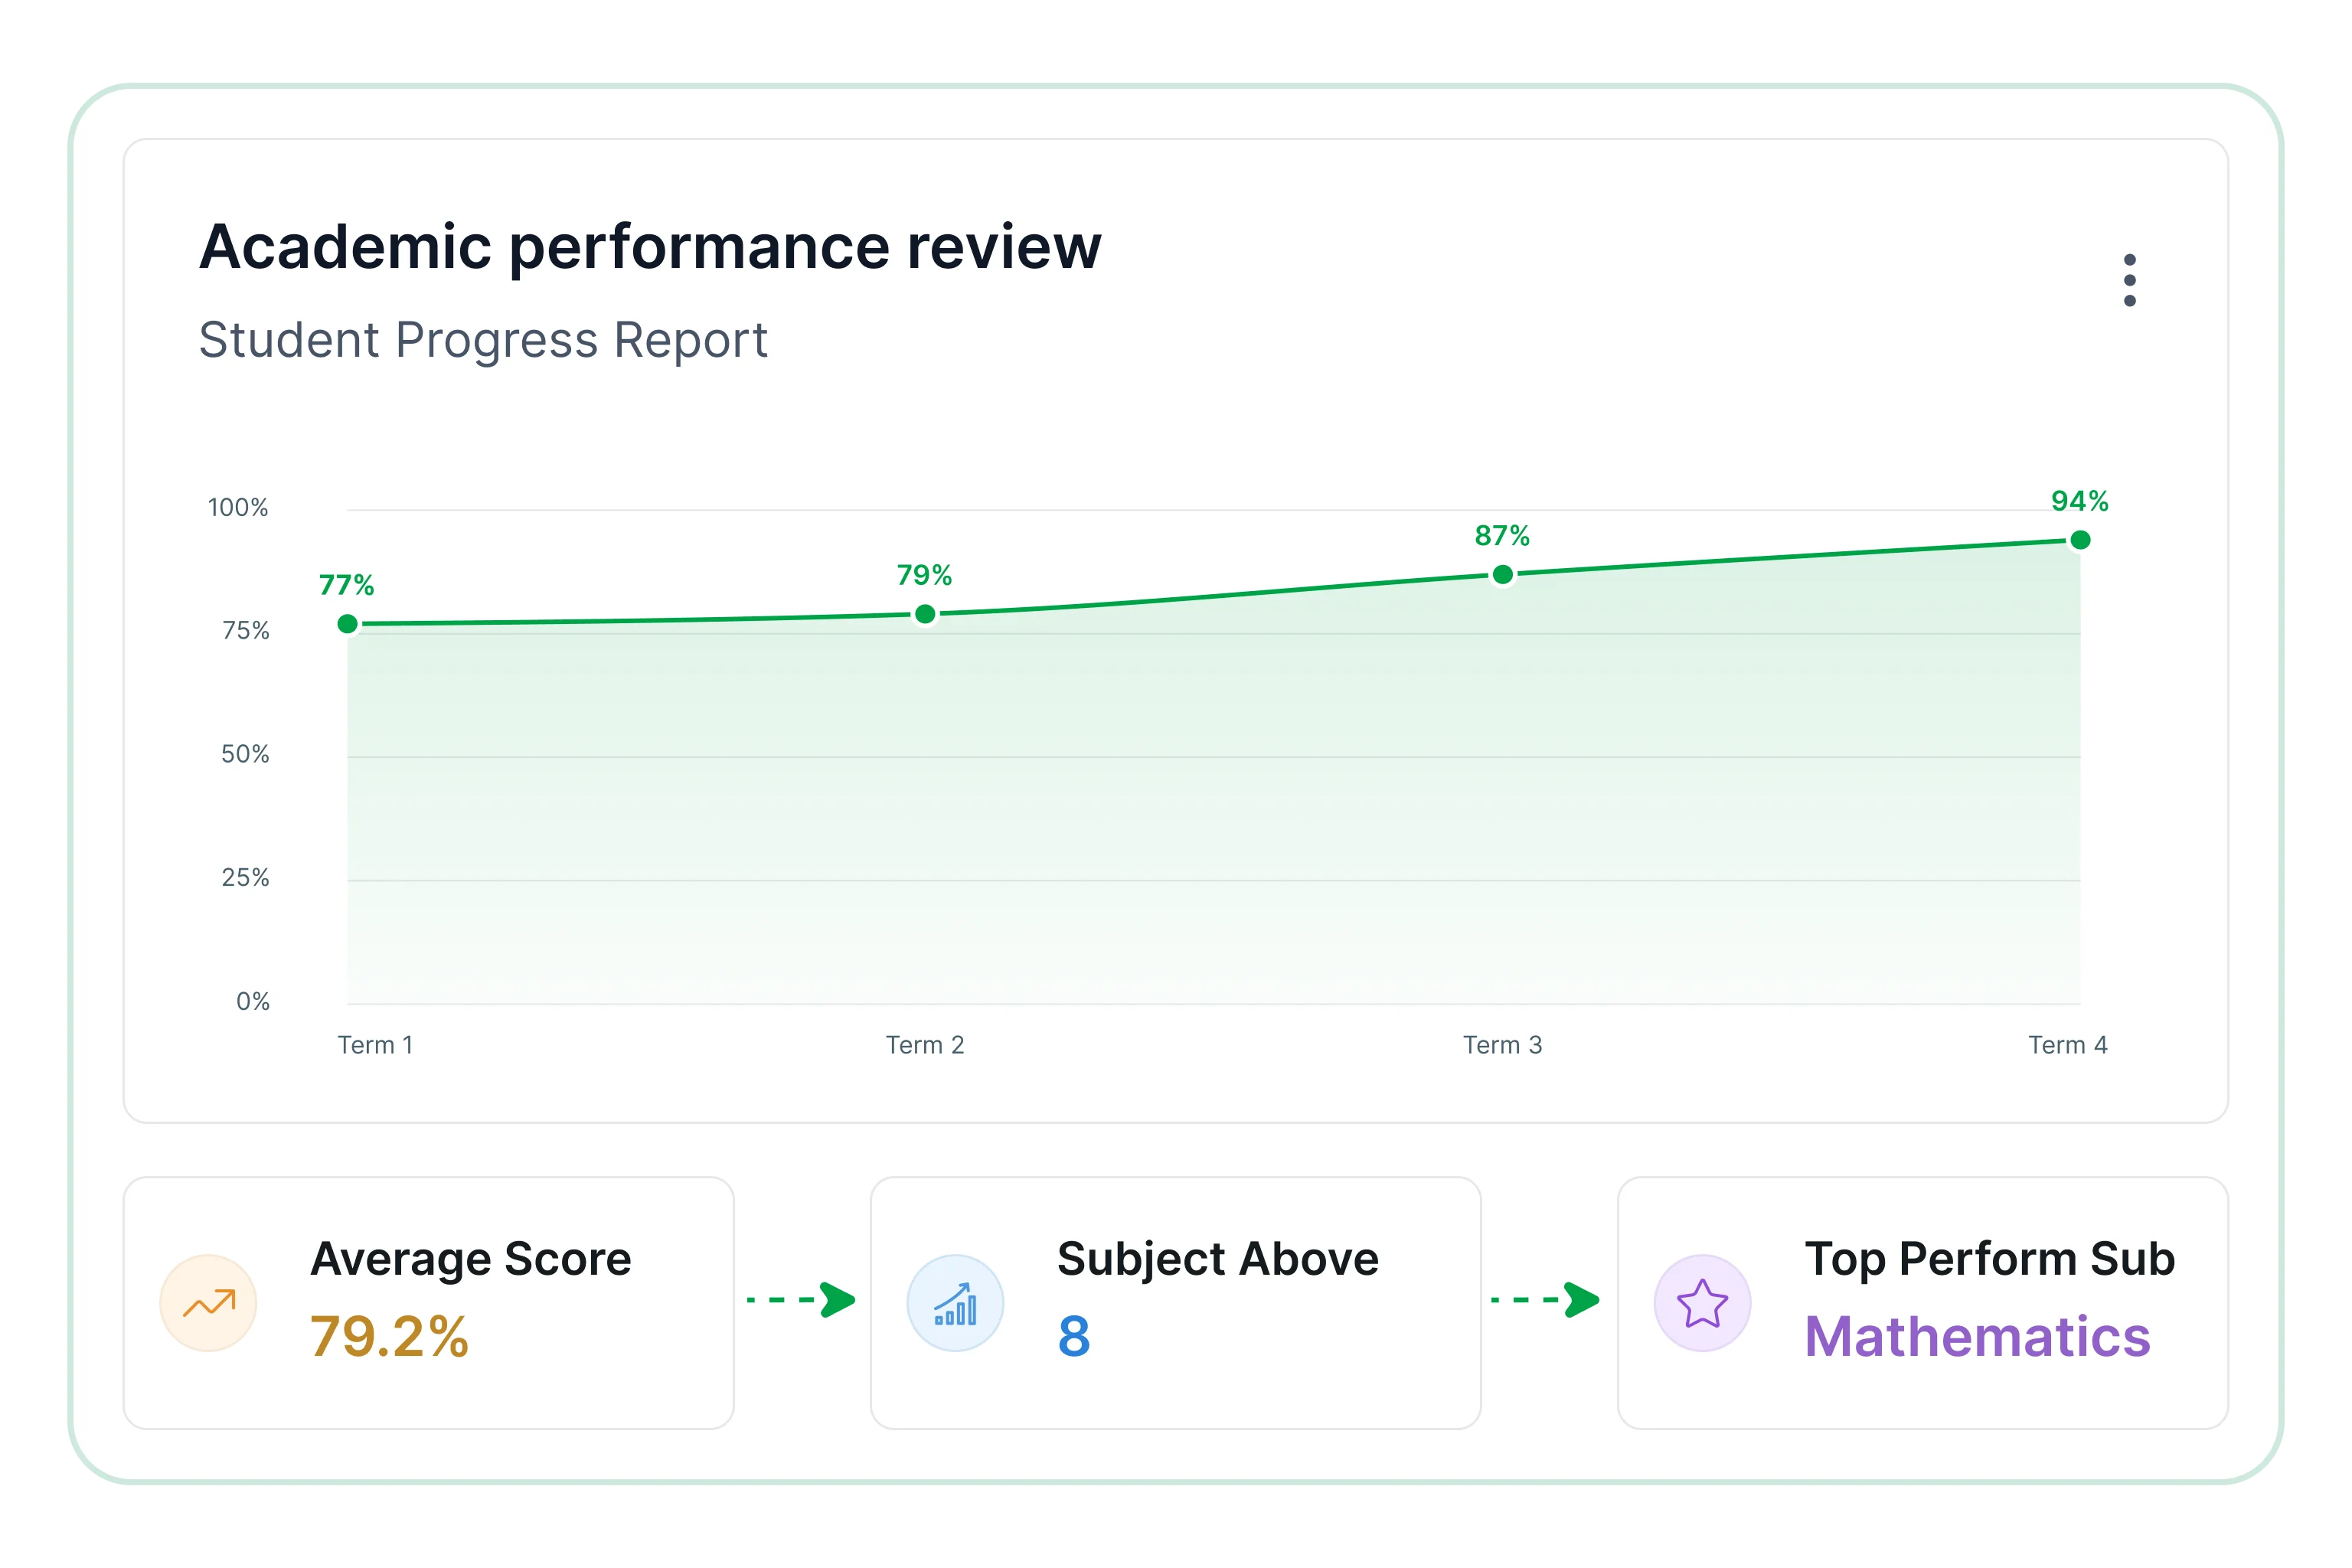
Academic performance review
Track academic outcomes over time to spot trends, achievement patterns, and improvement opportunities across subjects and classes.
- Contrast results across subjects and class groups clearly.
- Measure academic performance across reporting periods.
- Detect high-performing and underperforming student groups.
- Map grade distribution trends across classes and terms.
- Highlight overall academic achievement patterns clearly.
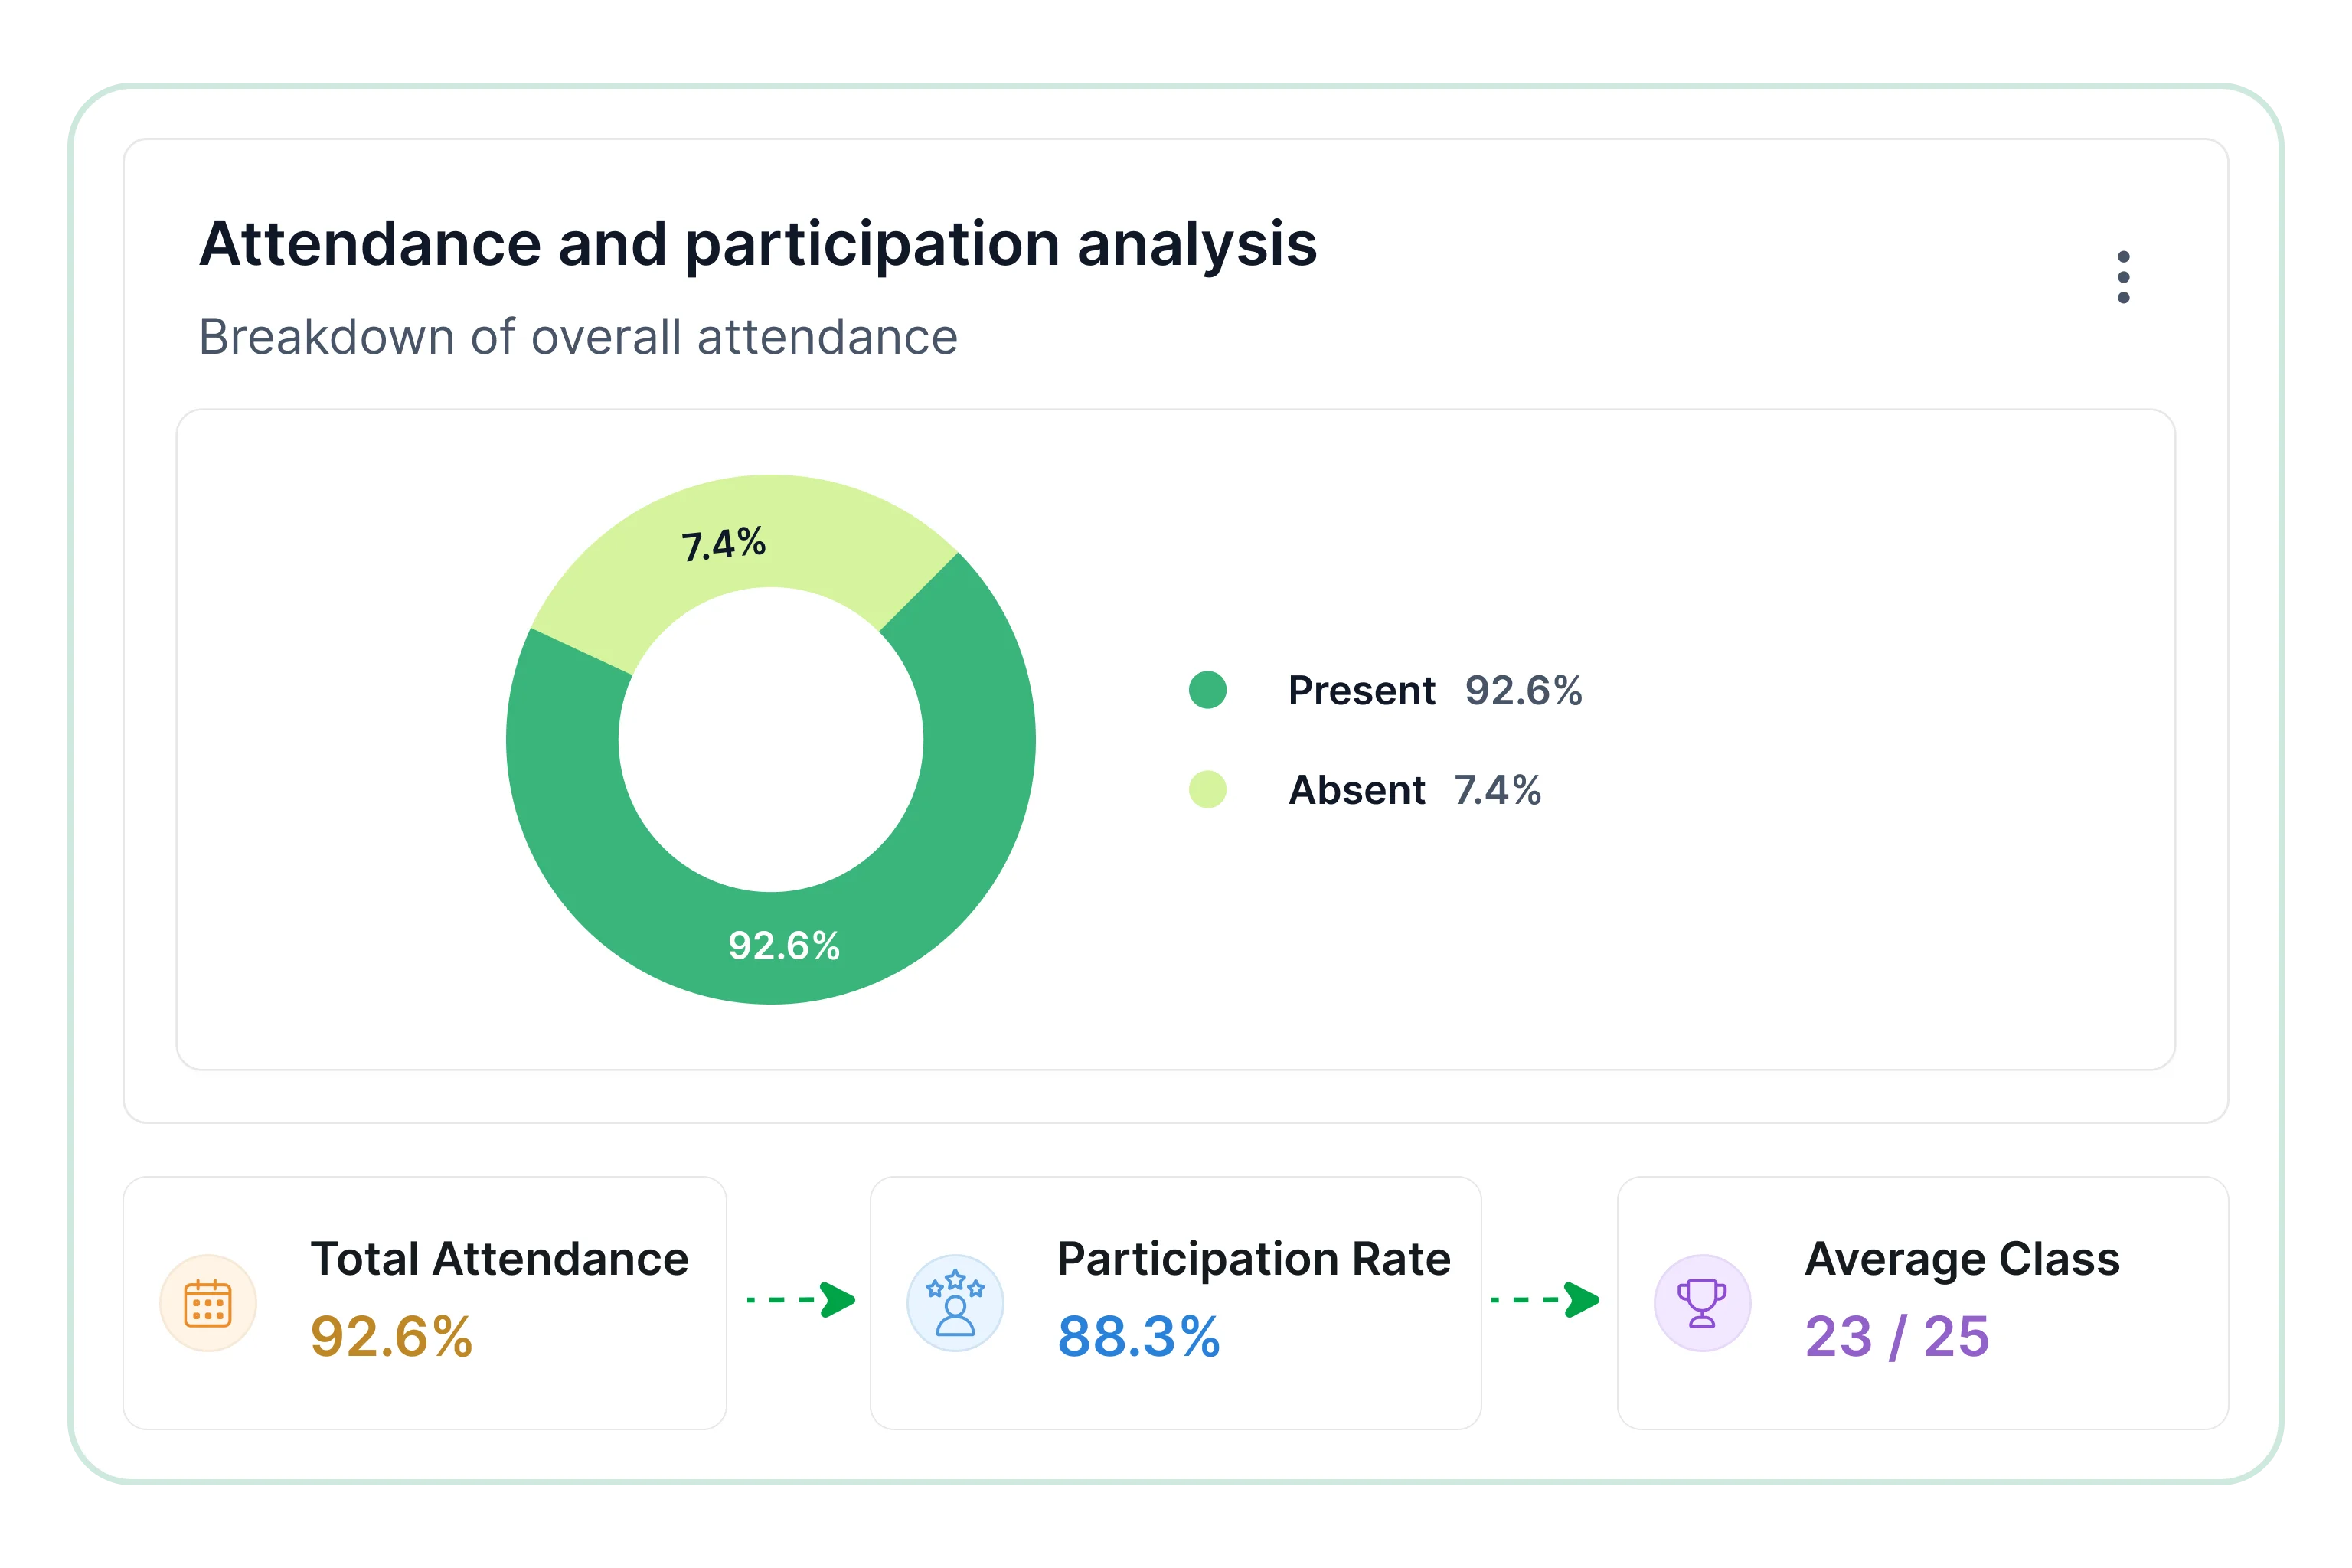
Attendance and participation analysis
Evaluate attendance behavior and participation levels to better understand student engagement.
- Track attendance levels across classes and grade levels.
- Observe participation patterns across academic time periods.
- Detect irregular attendance behavior within student groups.
- Measure consistency in student engagement over time.
- Examine attendance performance across reporting periods.
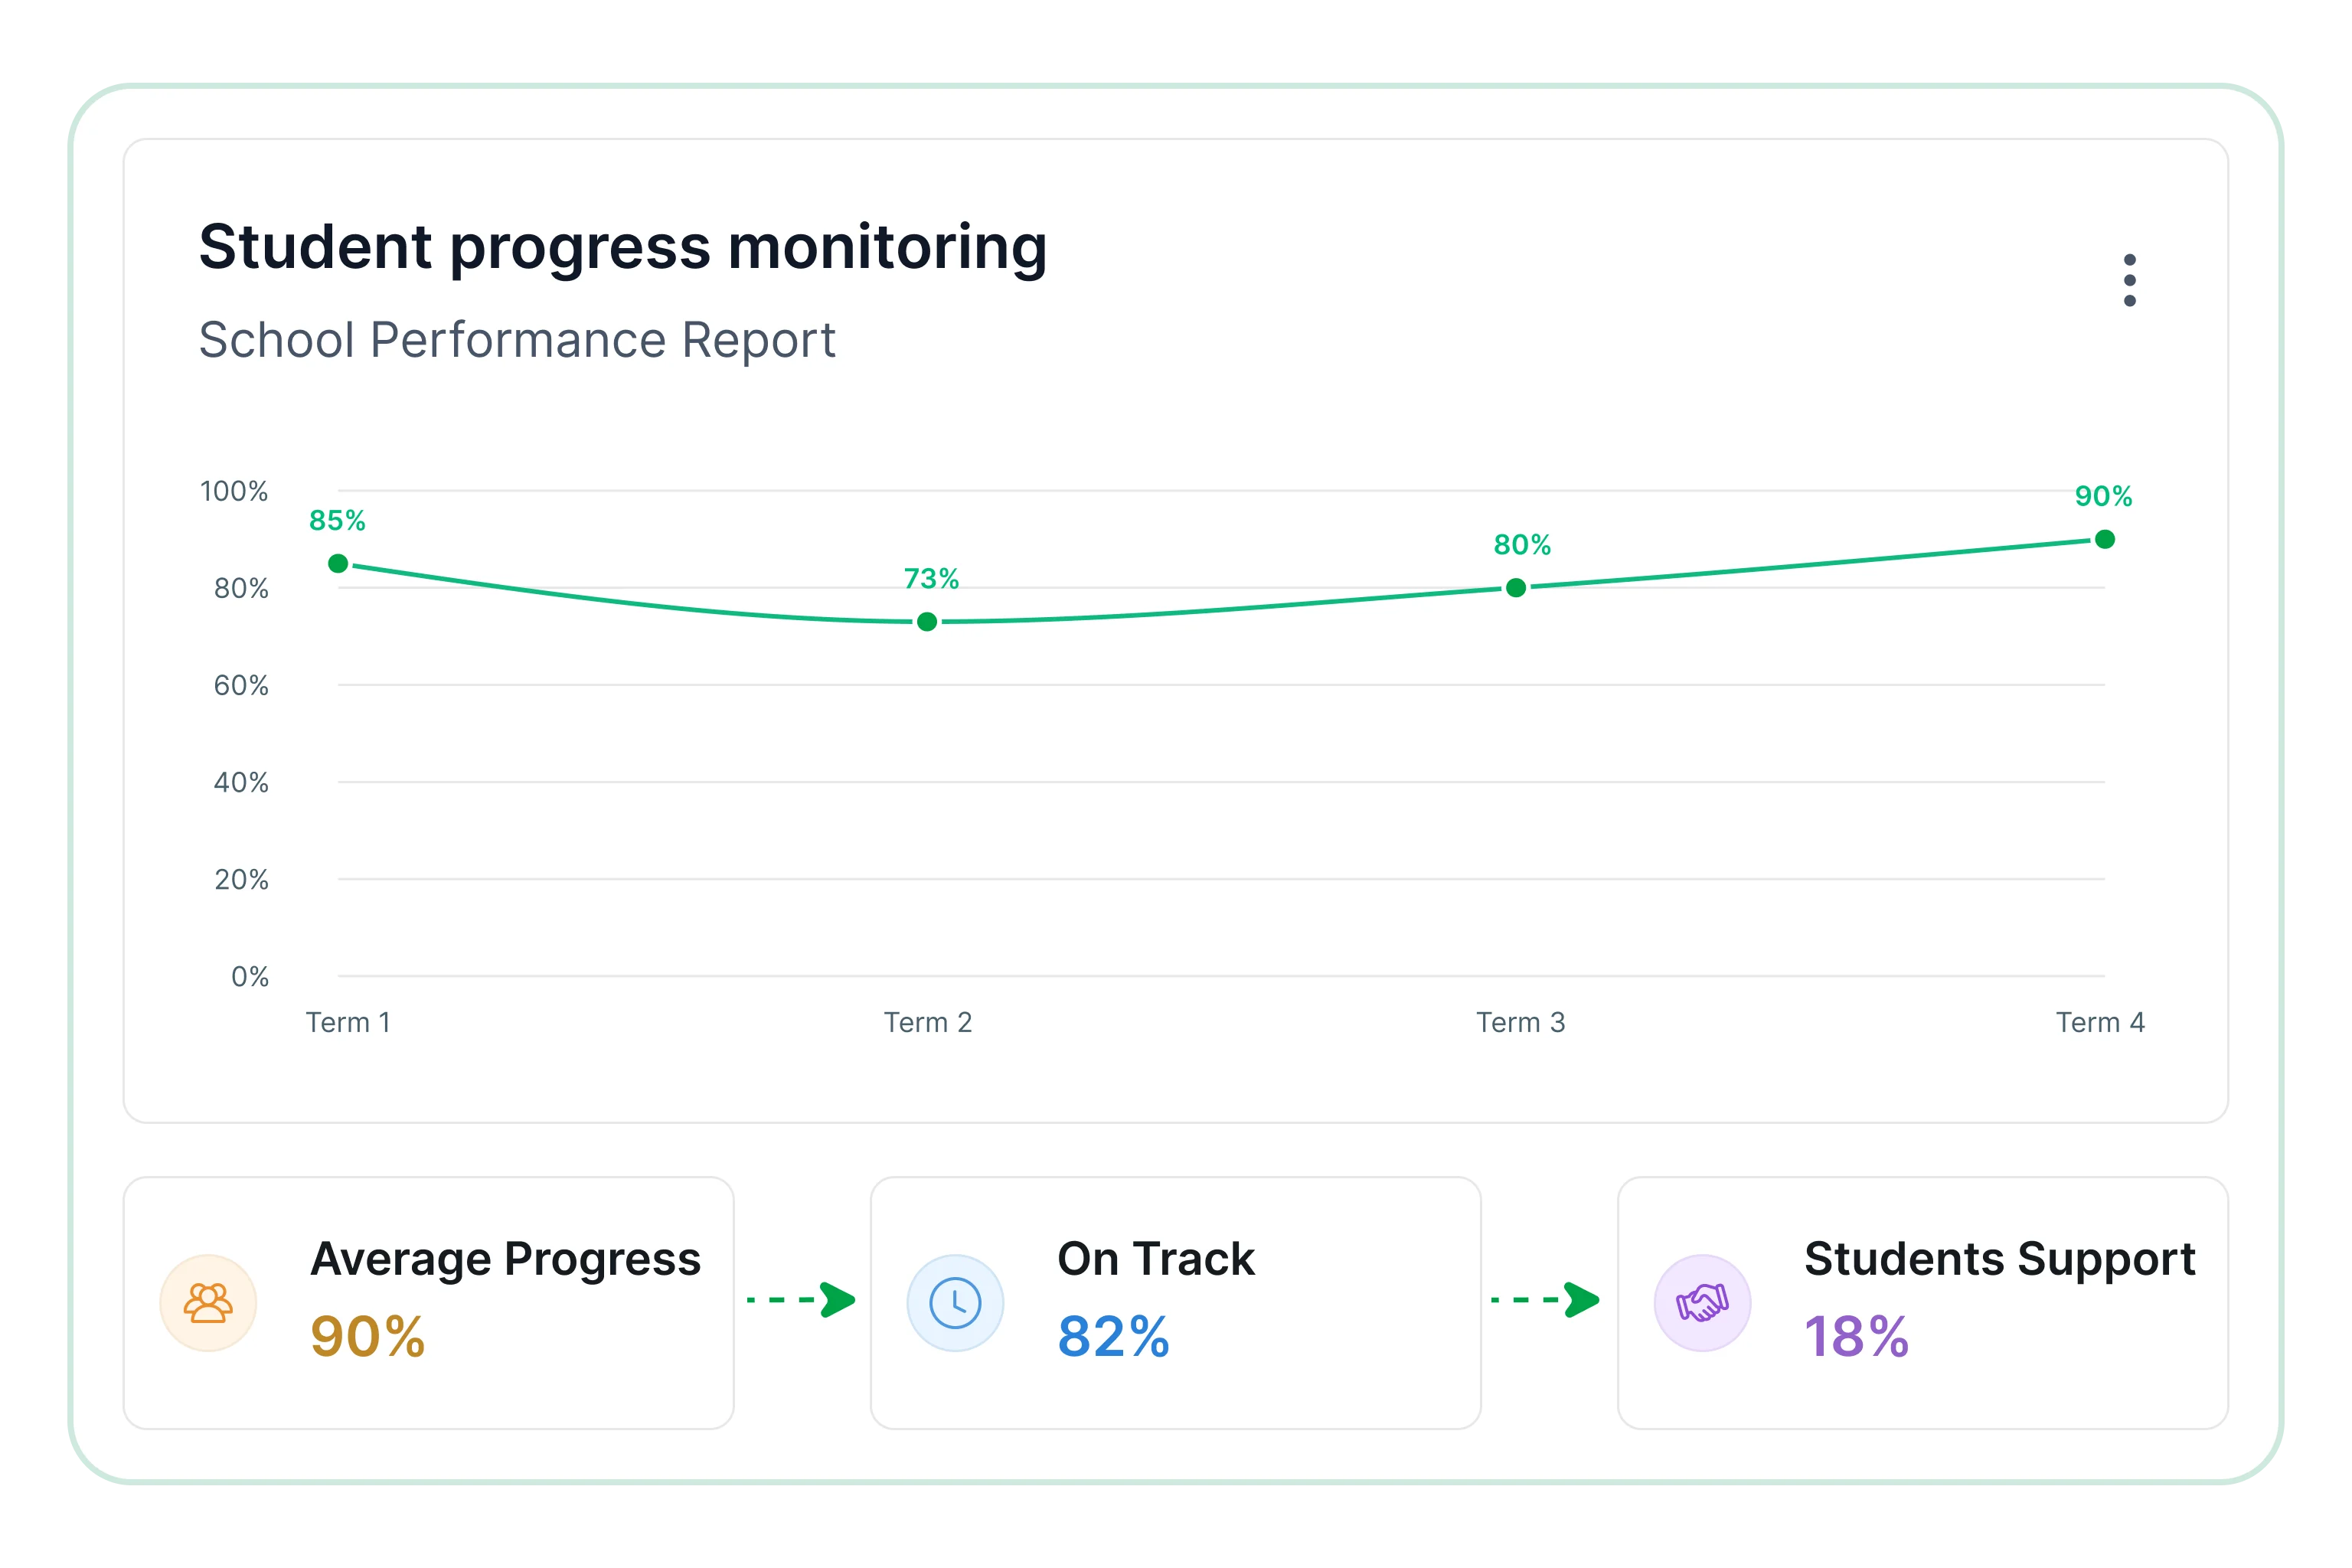
Student progress monitoring
Track student progression to evaluate academic advancement and educational outcomes.
- Track progression across grades and academic levels clearly.
- Compare academic outcomes across student cohorts.
- Reveal improvement trends across reporting timelines.
- Identify gaps in academic progress across subjects.
- Assess progression performance across reporting periods.
Institutional performance comparison
Compare academic performance across departments, grades, and educational programs to identify strengths and improvement opportunities.
- Contrast results across departments and academic units.
- Examine outcomes across grade levels and subject areas.
- Detect performance differences across academic programs.
- Measure institutional benchmarks against set standards.
- Review overall school performance trends over time.
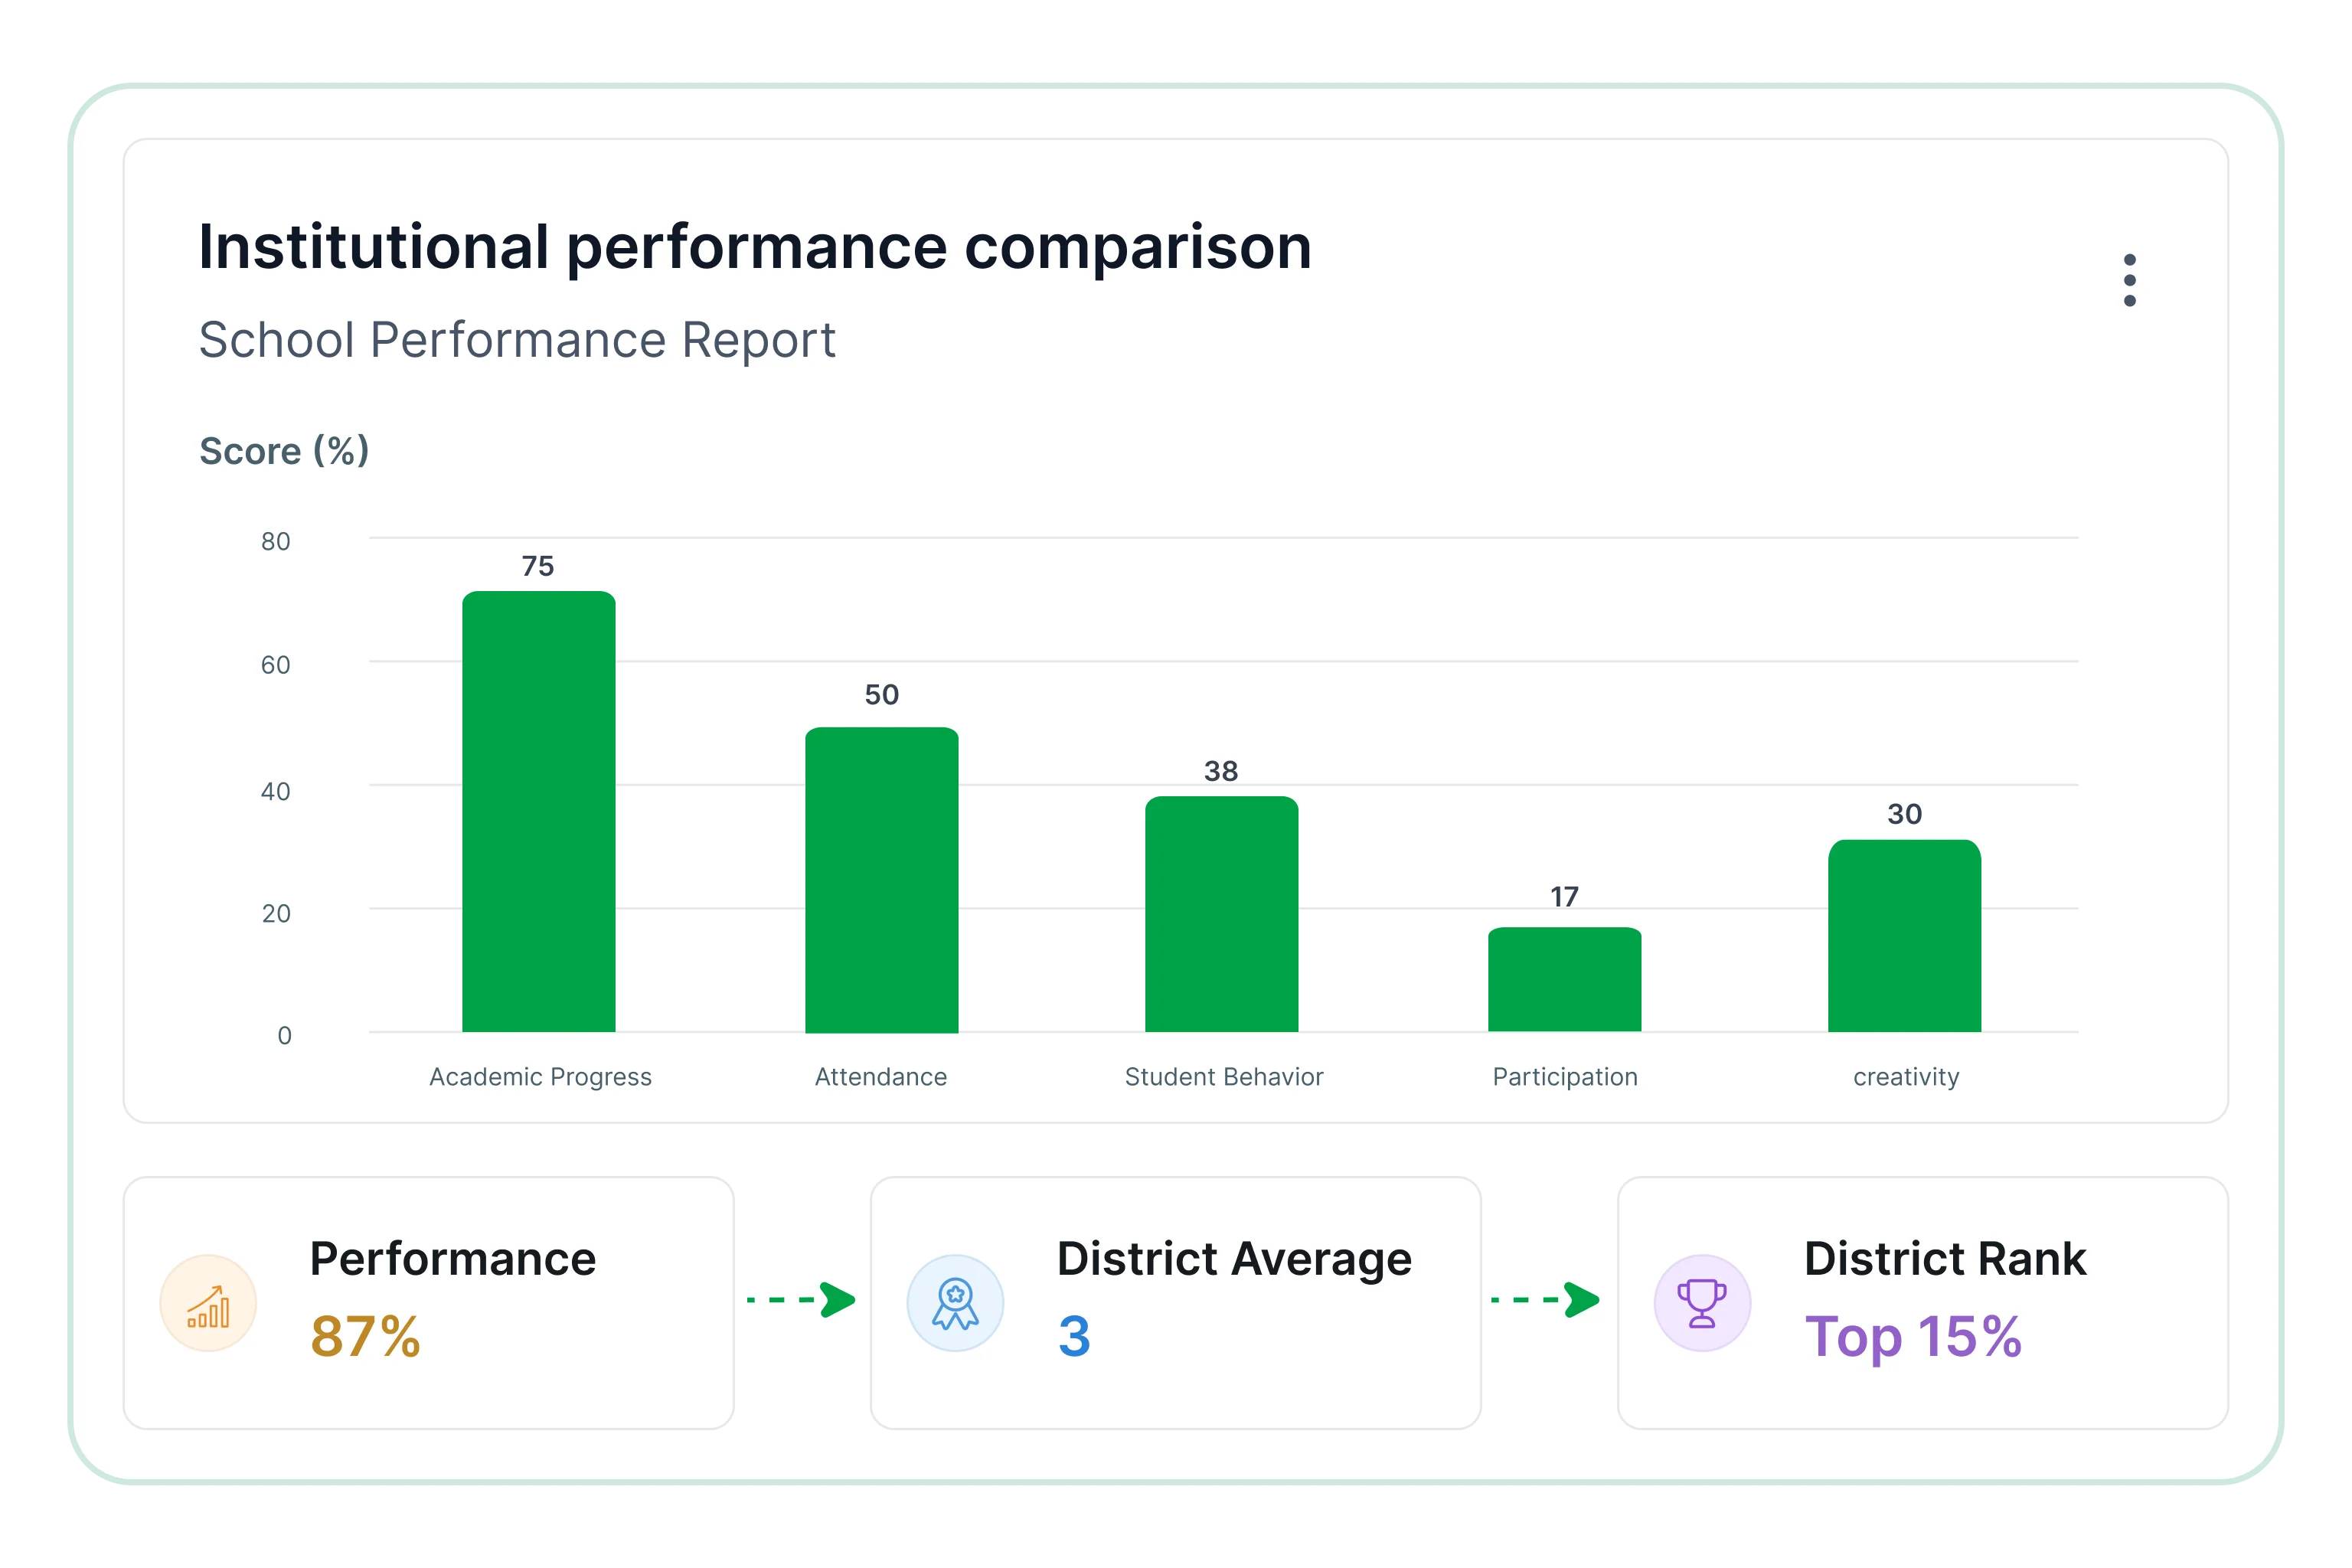
Review key performance indicators
Which metrics does the School Performance Report track?
The School Performance Report tracks metrics that help evaluate academic achievement, student engagement, attendance performance, and institutional outcomes for comprehensive review.
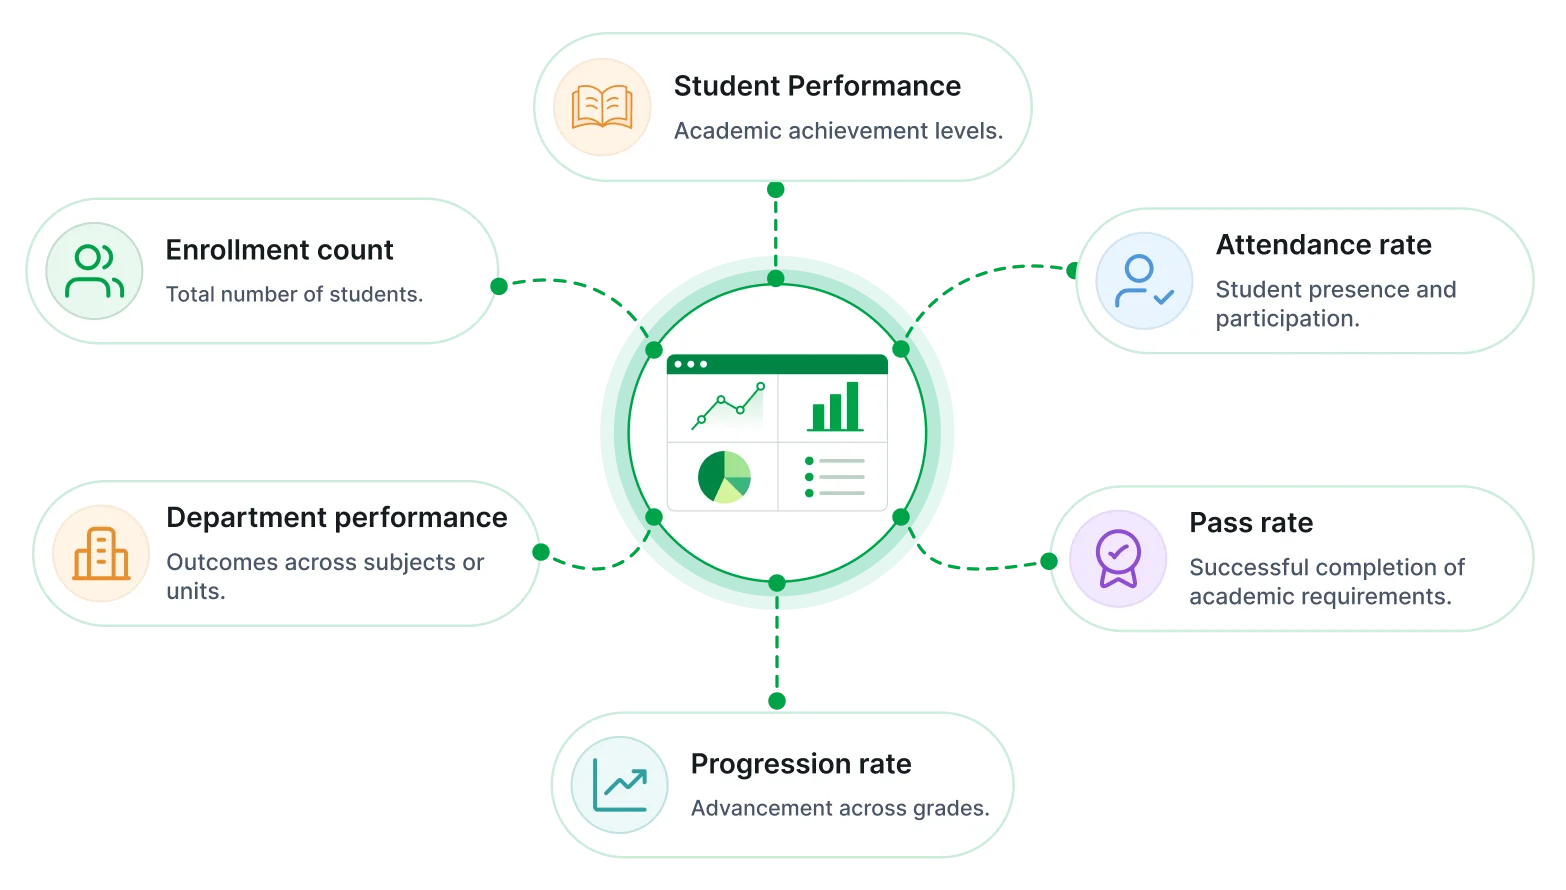
Overview of this report
What is a school performance report?
The School Performance Report combines academic outcomes, attendance, student progression, and benchmarks. Institutions use it to evaluate trends, compare results, and support academic planning.
No credit card required.
Academic performance visibility
Review performance across subjects, grades, classes, and departments.
Performance gap identification
Identify disparities in outcomes across classes, grades, departments, and student cohorts.
Student progress tracking
Evaluate how students advance through academic stages and reporting periods.
Institutional benchmarking
Compare academic performance against internal targets and institutional benchmarks.
Attendance and engagement analysis
Review attendance behavior and participation trends across student groups.
Academic planning support
Provide actionable insights for interventions, planning, and performance improvement initiatives.
Built for your team
Designed for education and administration teams
Access structured insights into academic performance, student engagement, attendance activity, and institutional outcomes through a unified reporting approach.
Centralized reporting
Combine academic and operational data into a single reporting view for consistent analysis.
Academic performance analysis
Review outcomes across subjects, classes, departments, and student groups.
Secure and role-based access
Protect student information while providing controlled access to authorized users.
Attendance and engagement insights
Evaluate participation trends and attendance performance across reporting periods.
Automated report delivery
Schedule recurring reports to support academic reviews and administrative planning.
Institutional visibility
Compare academic performance across grades, departments, and educational programs.
Tailor to your needs
Build & customize
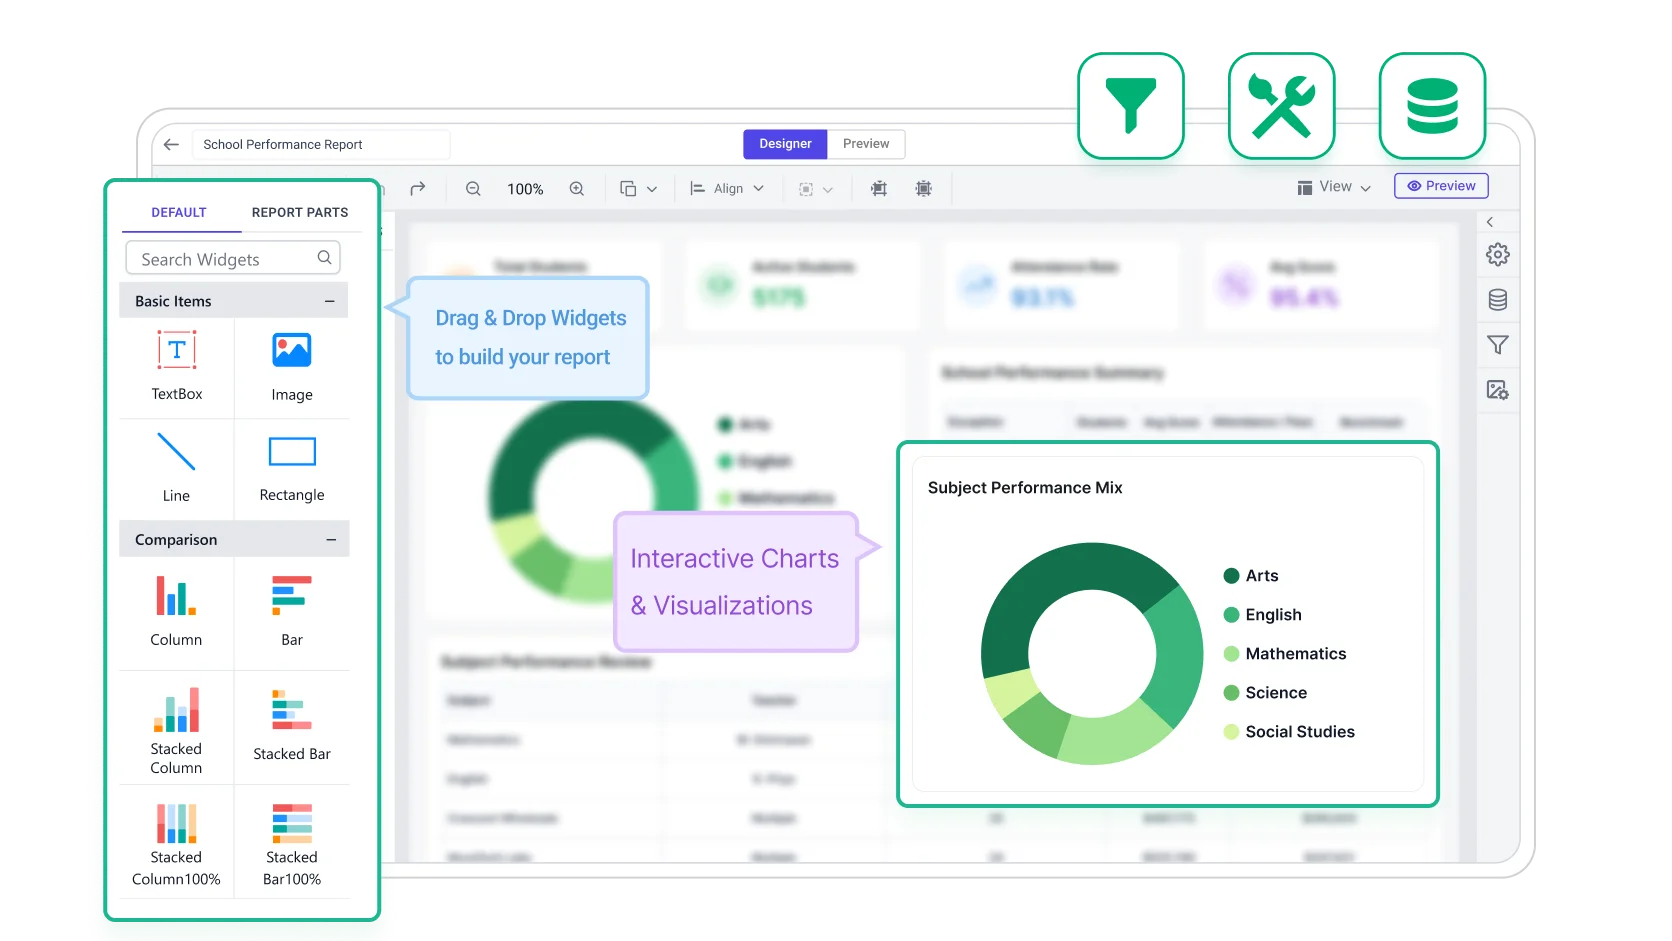
School performance reporting can be configured around KPIs, filters, and recurring delivery requirements. Bold Reports supports export-ready layouts and scheduled outputs for academic and institutional reporting. Scheduled reports can be delivered by email, to a file location, FTP, SFTP, or Amazon S3.
 Filter academic year, class, department.
 Track KPI performance and progress.
 Drill-down into academic and attendance data.
 Export reports in shareable formats.
 Schedule recurring report delivery.
No credit card required.
Templates
School performance report templates
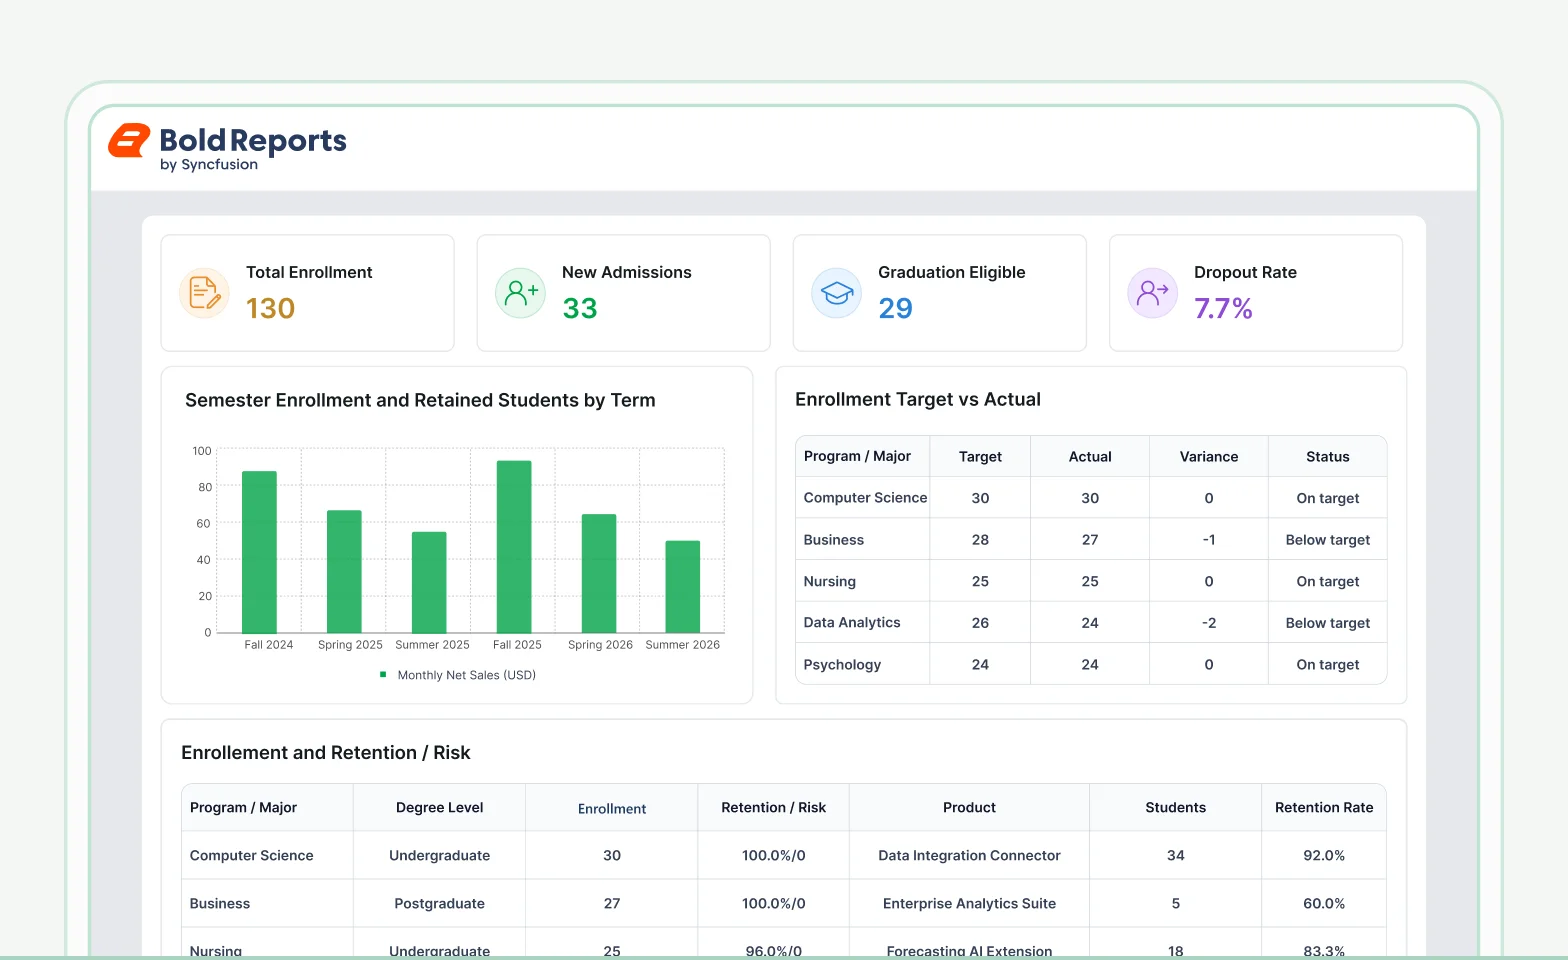
Bold Reports offers two related education templates, the Student Details Report and the Higher Education Enrollment and Retention Report, to understand student performance, enrollment trends, and institutional outcomes.
Connectors
Data integrations
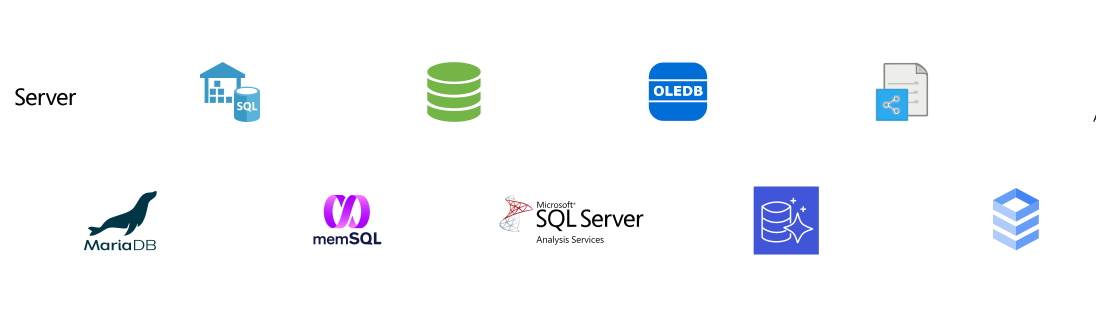
Bold Reports offers 27 named data connectors, from files and databases to web services, for flexible integration, transformation, and storage, all ready for reporting.
Common education reporting questions
Frequently asked questions
Track academic outcomes and institutional performance through centralized reporting that brings together results, attendance, and key education metrics.
Can the report break down by student subgroup?
Yes. Performance metrics can be segmented by grade level, educational programs, departments, or student groups to support targeted analysis and intervention planning.
Does the report include chronic absence calculations?
Yes. Attendance data can be used to calculate chronic absence indicators and identify attendance-related concerns across schools, grades, and student groups.
Which export formats are available?
Reports can be exported from Bold Reports in 7 formats (PDF, Excel, Word, PowerPoint, CSV, XML, and HTML) for sharing, collaboration, and administrative review.
Can reports be scheduled for regular delivery?
Yes. Bold Reports can schedule reports to run automatically at defined intervals, ensuring consistent updates for educators, administrators, and leadership teams.
How are assessment scales standardized?
Assessment results can be normalized into consistent performance bands, enabling accurate comparison across grades, schools, and reporting periods.
Is sensitive student information protected in reports?
Yes role based access controls, secure permissions, and data protection mechanisms help ensure that student information remains secure and accessible only to authorized users.
Stop Exporting Data. Start Embedding Reports.
Turn your data into production-ready reports instantly
Create pixel-perfect, print-ready reports in Bold Reports and export them to 7 formats, including PDF, Excel, and Word.
No credit card required.