






SAMPLE REPORT FOR DATA VISUALIZATION

Oil and Gas Production Report

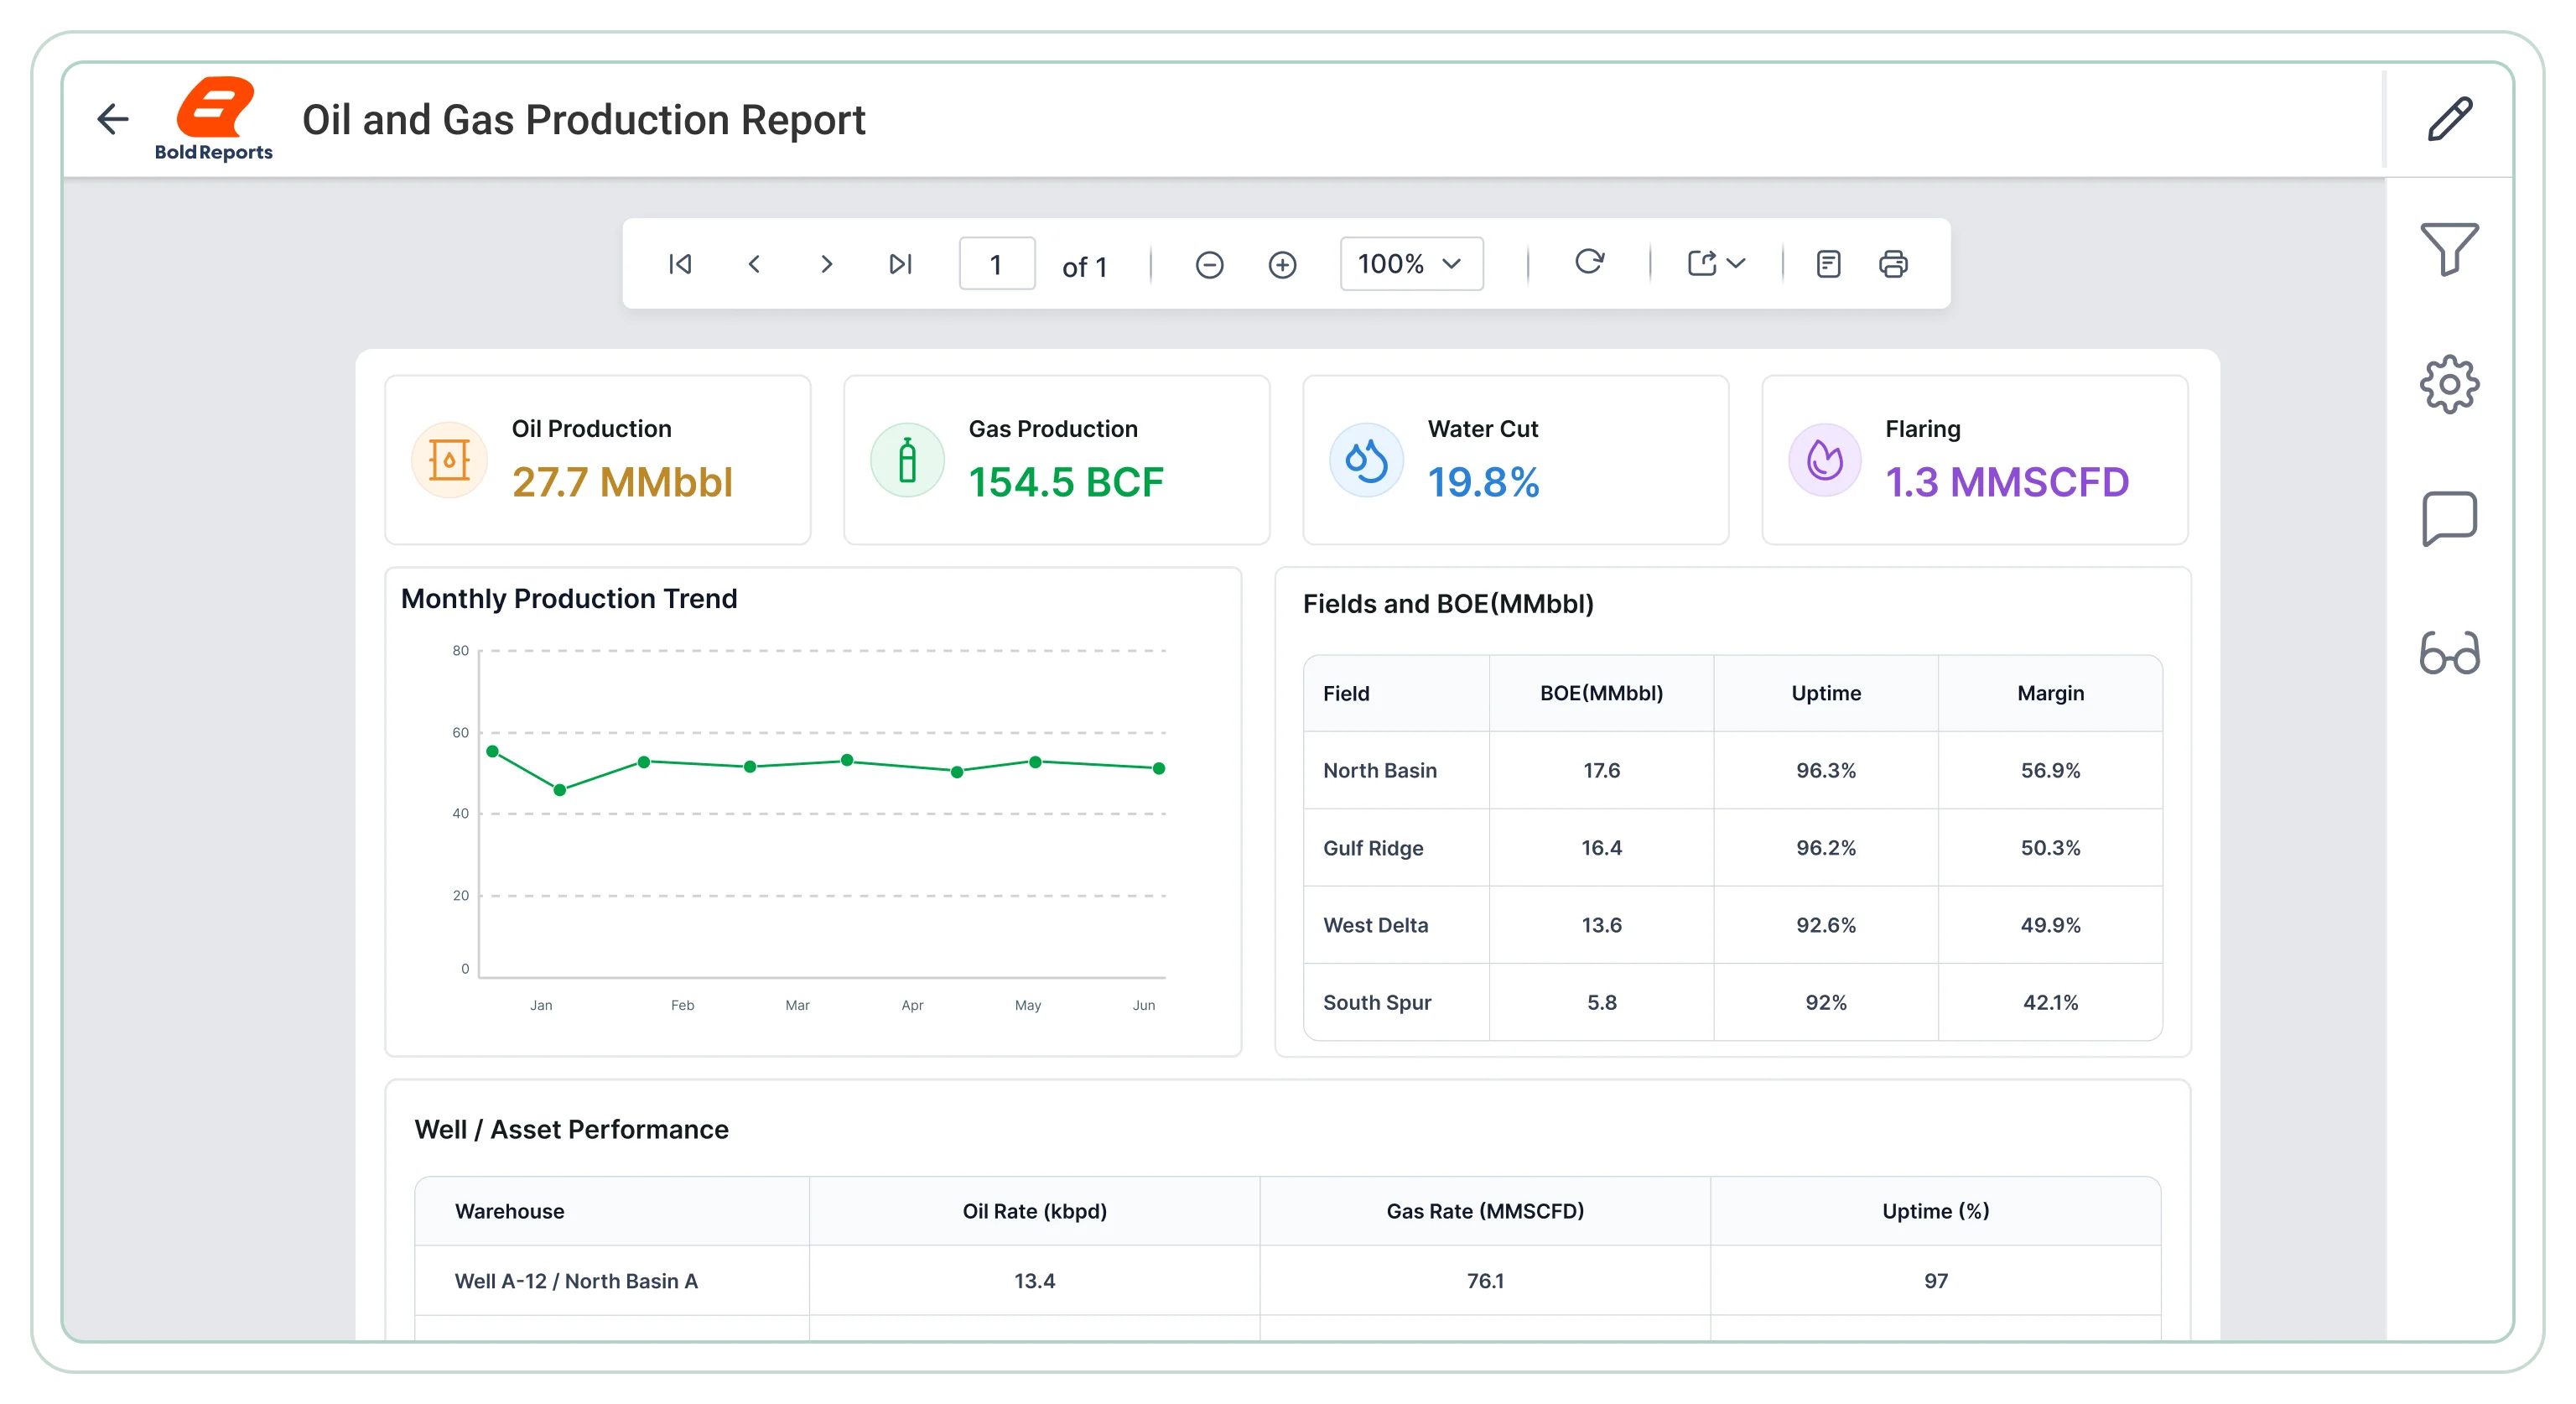
Measure field performance with a paginated report built for output analysis, well comparisons, trend tracking, and stronger reporting visibility across production movement, operator activity, and regional contribution. 

Editable .rdl file i The download includes the report .rdl file only. Upload it to Bold Reports Designer to preview, edit, and customize the report based on your requirements.

Need help customizing the report? Explore the documentation or contact our support team.

Oil and gas production report
Trusted by leading companies

J&J

Schneider

Bridgestone

Siemens

Verizon

HP

Fidelity

Intel

Real-world business scenarios

Explore key use cases

Use this report to examine production output, operator activity, and well-level performance, supporting operational oversight and field management decisions. 

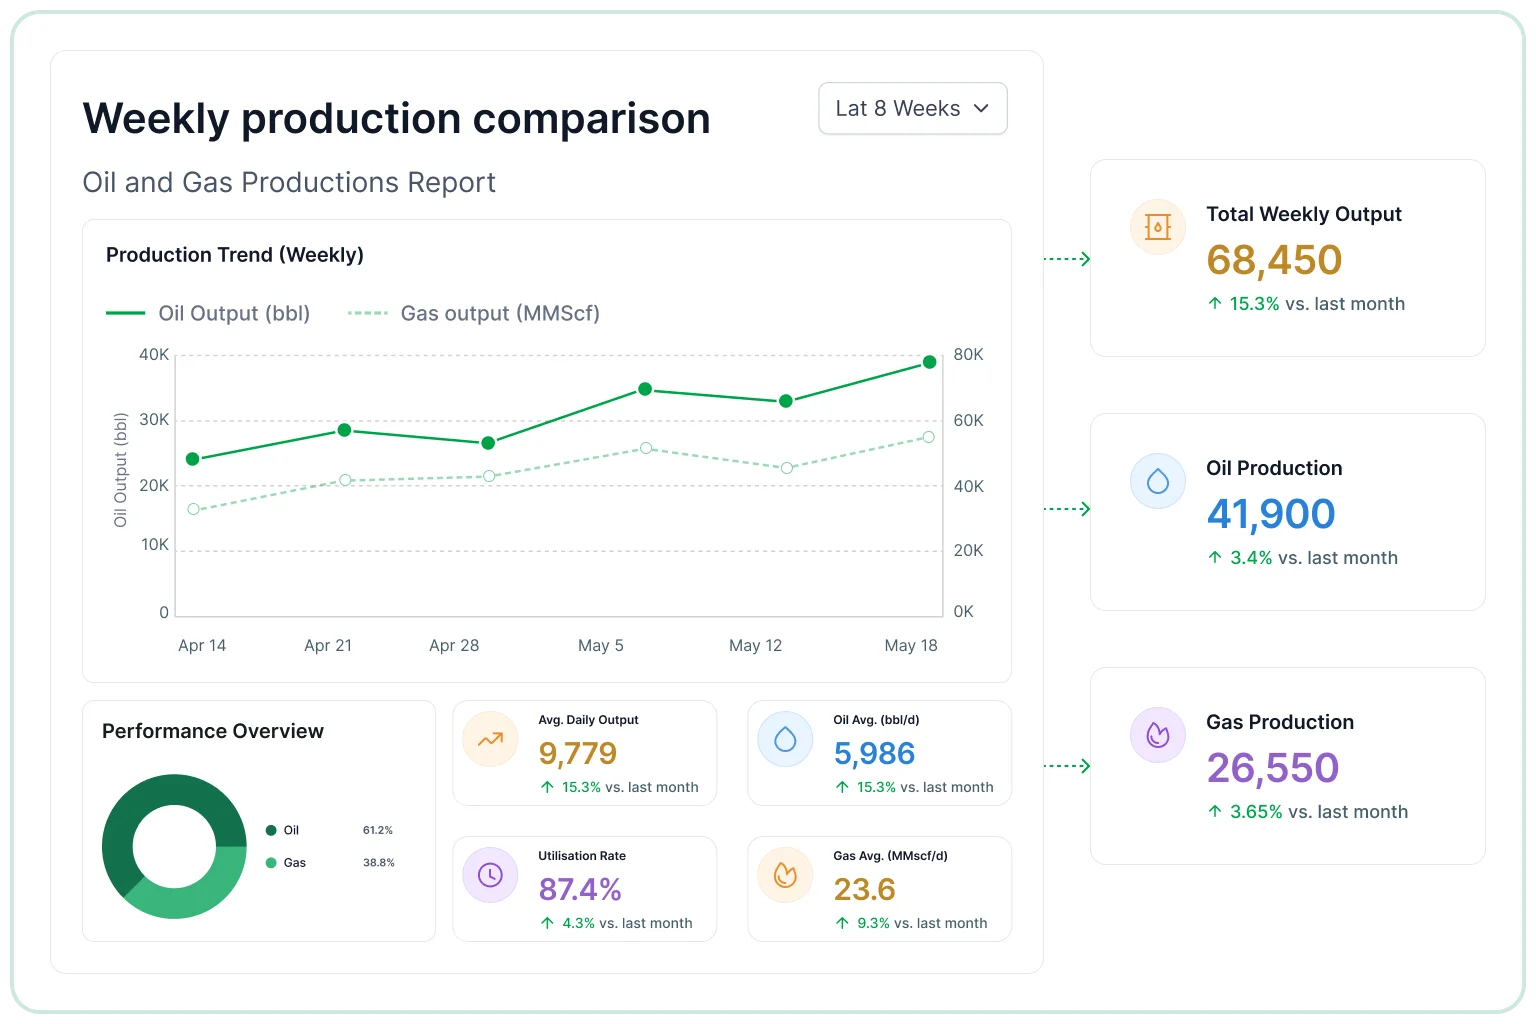
Weekly production comparison

A focused reporting view for teams checking how current output performs against the previous week.

  • Compare oil production week over week across regions and fields.
  • Review gas output changes across reporting periods and assets.
  • Identify short-term production shifts across sites and wells.
  • Examine combined volume movement across all production areas.
  • Measure weekly change by region across all production assets.
Weekly production comparison

Well productivity evaluation

Helps field teams assess which wells are driving output and where performance gaps are emerging.

  • Review production by well across oil and gas operations daily.
  • Compare oil and gas contribution across wells and production.
  • Identify low-performing wells and review output across sites.
  • Examine output variation across sites and reporting periods.
  • Measure productivity by well group across active production.
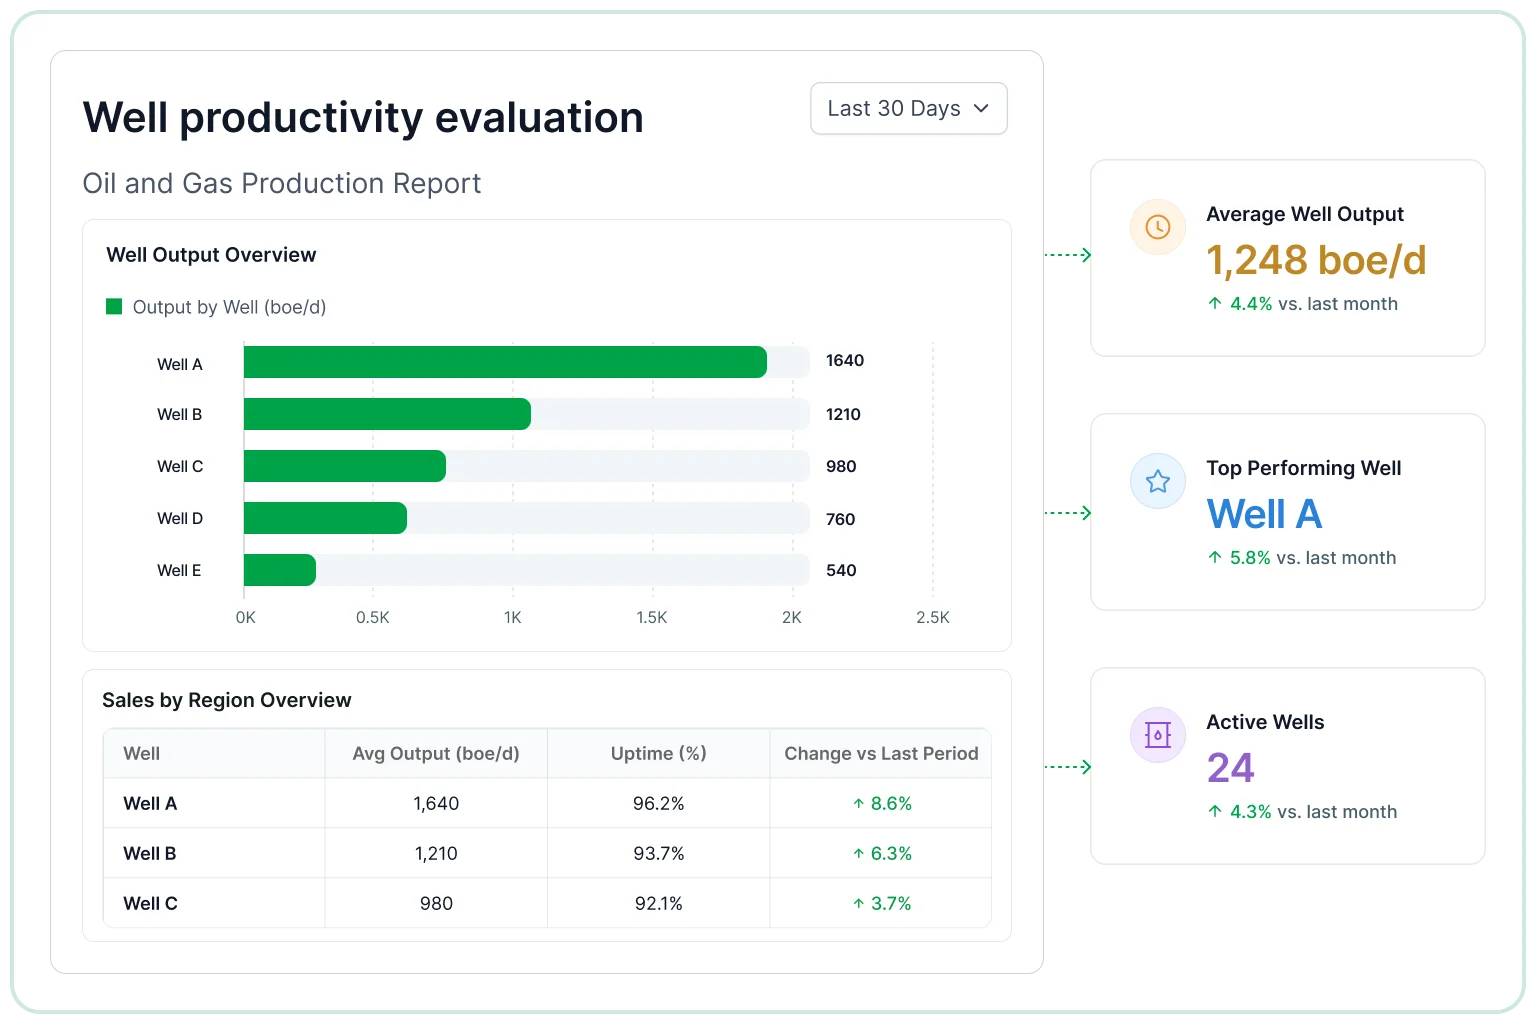
Well productivity evaluation

Regional output breakdown

Useful for analyzing how each state contributes to total production levels, trends, and forecasting.

  • Compare production by state across oil and gas operations daily.
  • Review regional production distribution across reporting periods.
  • Identify stronger producing areas across the state and region.
  • Examine state-level output trends across reporting periods daily.
  • Measure regional share of total production across all assets.
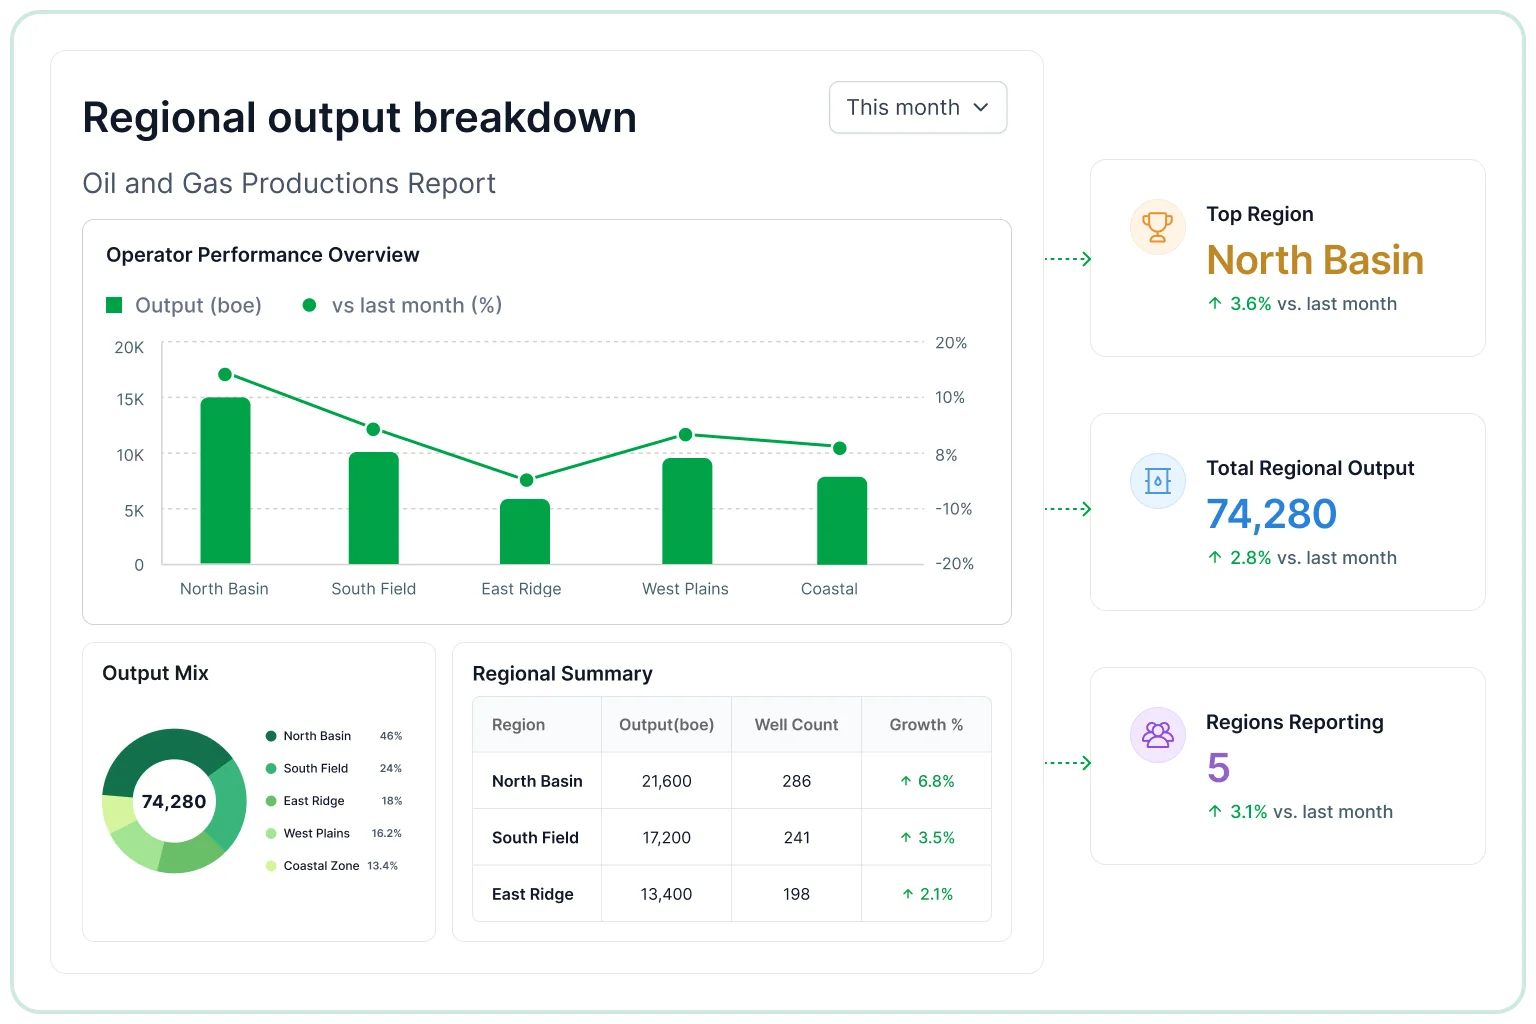
Regional output breakdown

Operator performance overview

Supports operations planning by showing how selected operators influence production results.

  • Compare operator production metrics across active regions daily.
  • Review output by selected operator across reporting periods.
  • Identify top-performing operators and review output by region.
  • Examine operator-linked production trends across active regions.
  • Measure contribution across active regions and production sites.
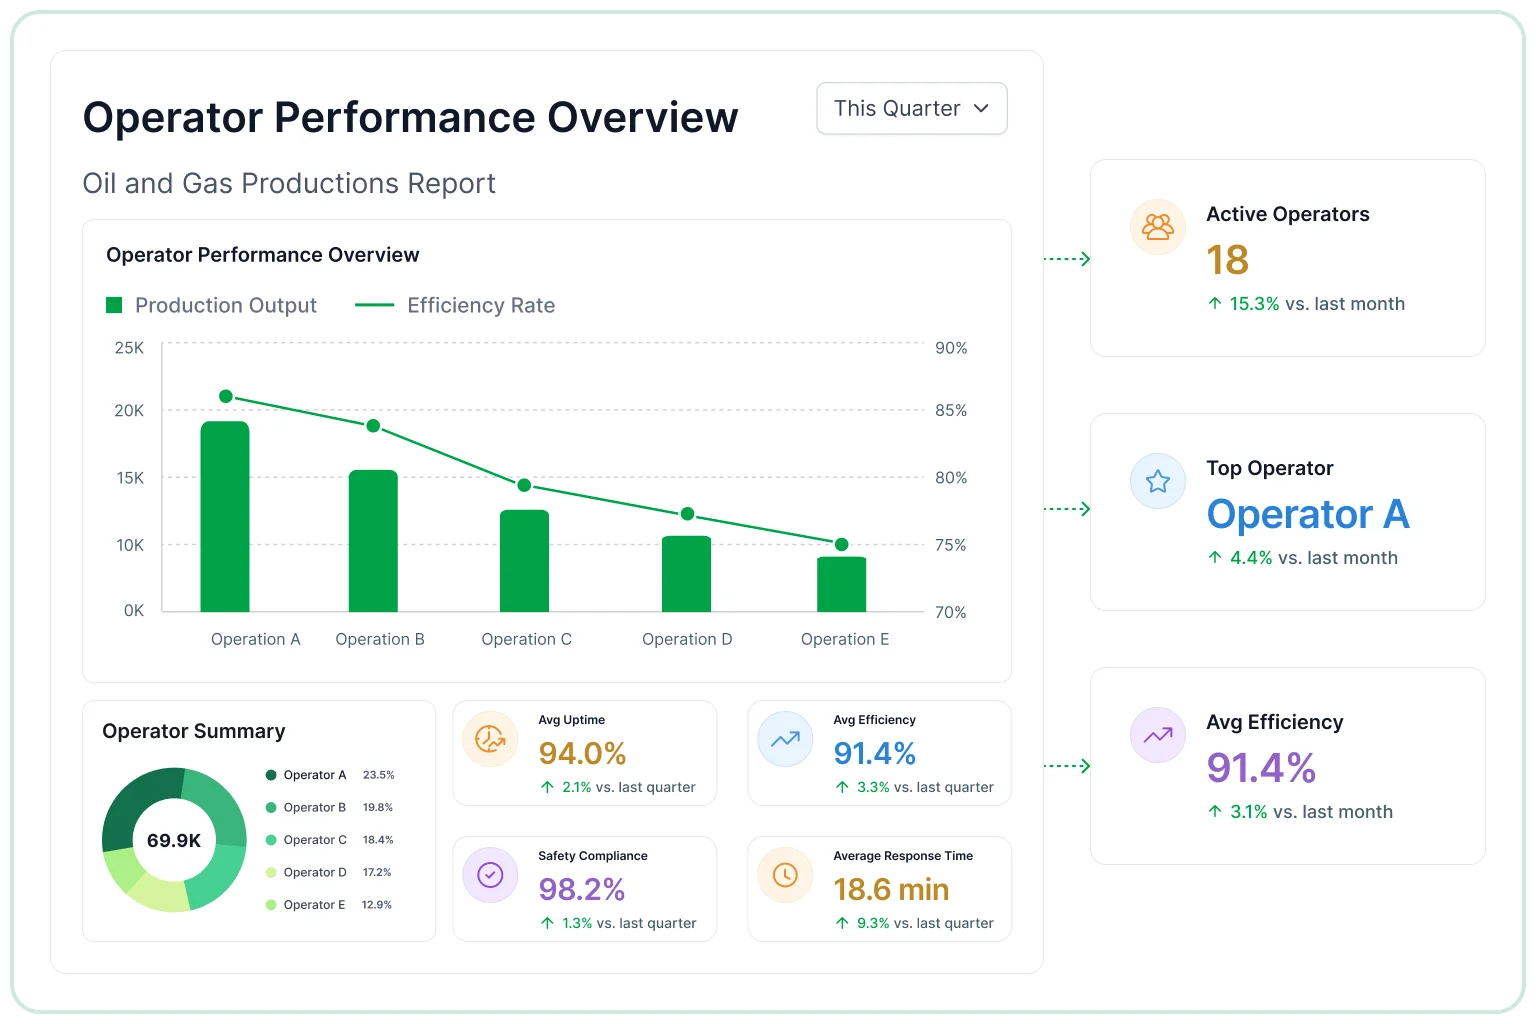
Operator performance overview
Monitor critical KPIs

Track key metrics

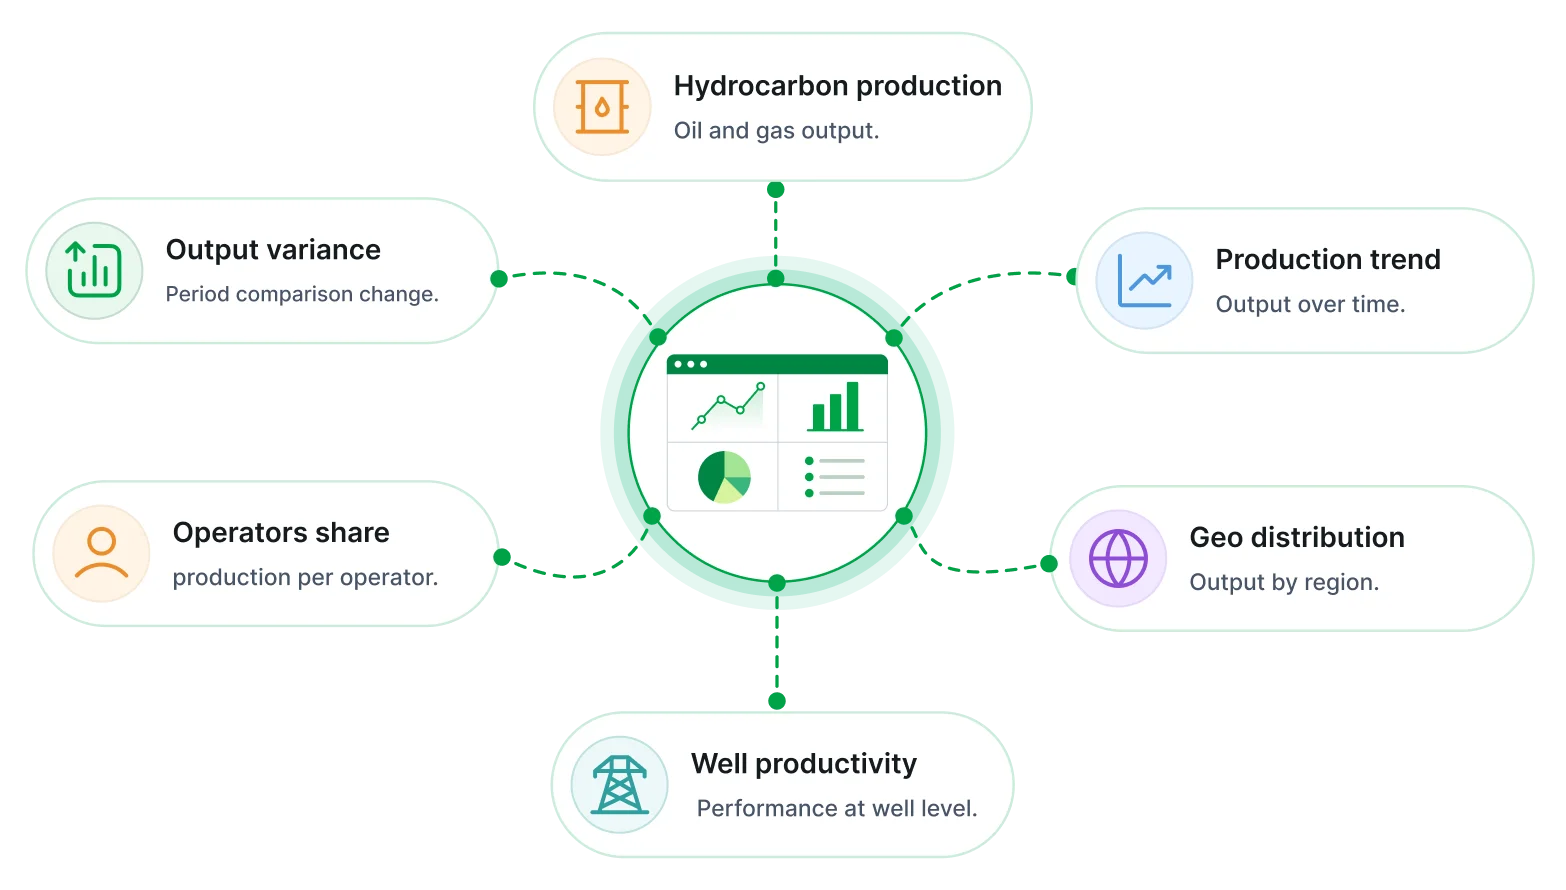
These indicators provide a structured overview of upstream production performance and operational output distribution across wells, fields, and sites.

Oil and gas production report key metrics
Overview of this report

What is an oil and gas production report?

An oil and gas productions report reviews output volume, well performance, field activity, and production trends for operational and reporting visibility. 

Production volume trend review

Tracks oil and gas output changes across wells, assets, or time periods.

Downtime and loss tracking

Identifies output losses caused by shutdowns, faults, or operating issues.

Well performance comparison

Compares production levels, efficiency, and decline rates across wells.

Resource extraction analysis

Examines extraction rates, reserves usage, and production consistency.

Field output distribution view

Shows how production is distributed across fields, sites, or regions.

Operational planning support

Supports production review, field decisions, and performance reporting workflows.
No credit card required.

Built for your team

Built for upstream operations teams

Support production monitoring and operational decision-making across oil and gas environments with clear visibility into assets, teams, and workflows.

Built for upstream operations teams
Integrated production visibility

Integrated production visibility

Access oil, gas, and well performance metrics within a unified reporting environment.

Well and field performance insights

Well and field performance insights

Evaluate output at both macro and granular levels across sites, teams, and reporting periods.

Controlled operational data access

Controlled operational data access

Ensure production data is shared securely across engineering and management teams.

Production trend identification

Production trend identification

Recognize shifts in output across time and locations to track production performance and trends.

Periodic reporting workflows

Periodic reporting workflows

Track production patterns through scheduled reporting intervals across wells, fields, and sites daily.

Cross-functional reporting alignment

Cross-functional reporting alignment

Share consistent insights across field operations and planning teams to support better decisions.
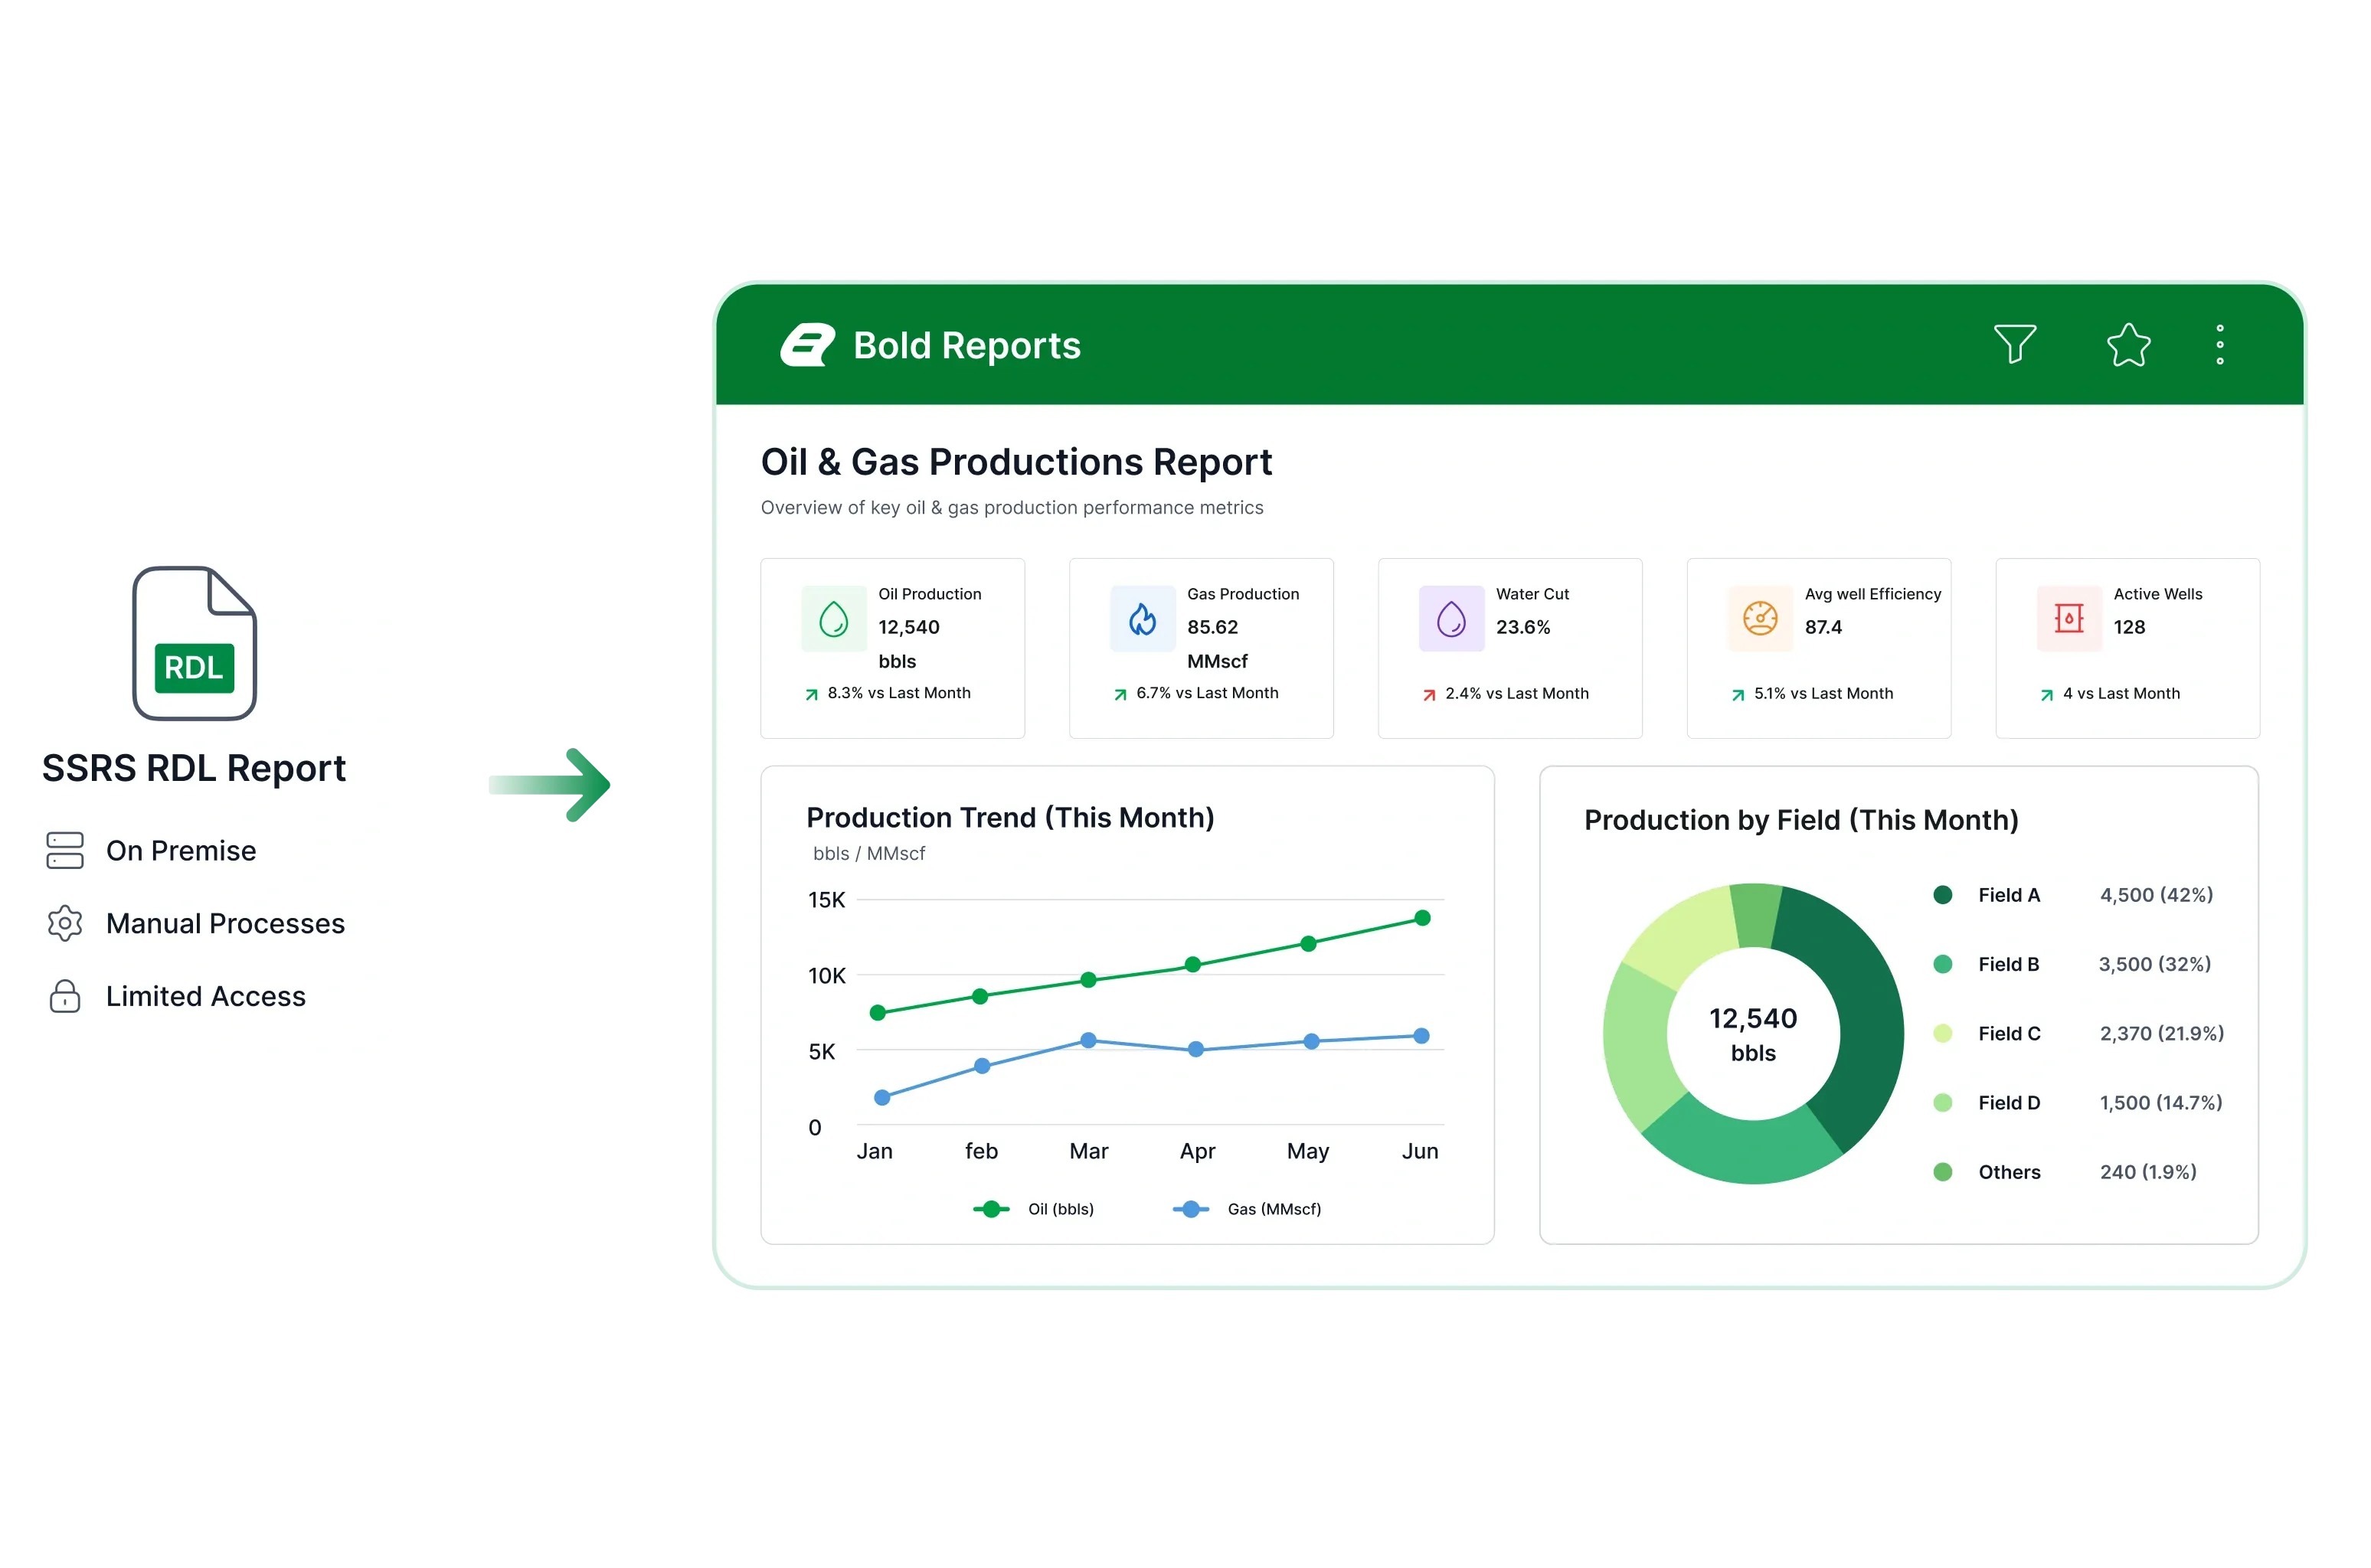
Modernize existing SSRS reports

Reuse existing field operations reports

Support oil and gas reporting with SSRS RDL compatibility, production monitoring, field reviews, scheduled delivery, and internal access.

  • Reuse existing RDL reports
  • Internal portal embedding.
  • Scheduled reporting.
Reuse existing field operations reports
Tailor to your needs

Build & customize

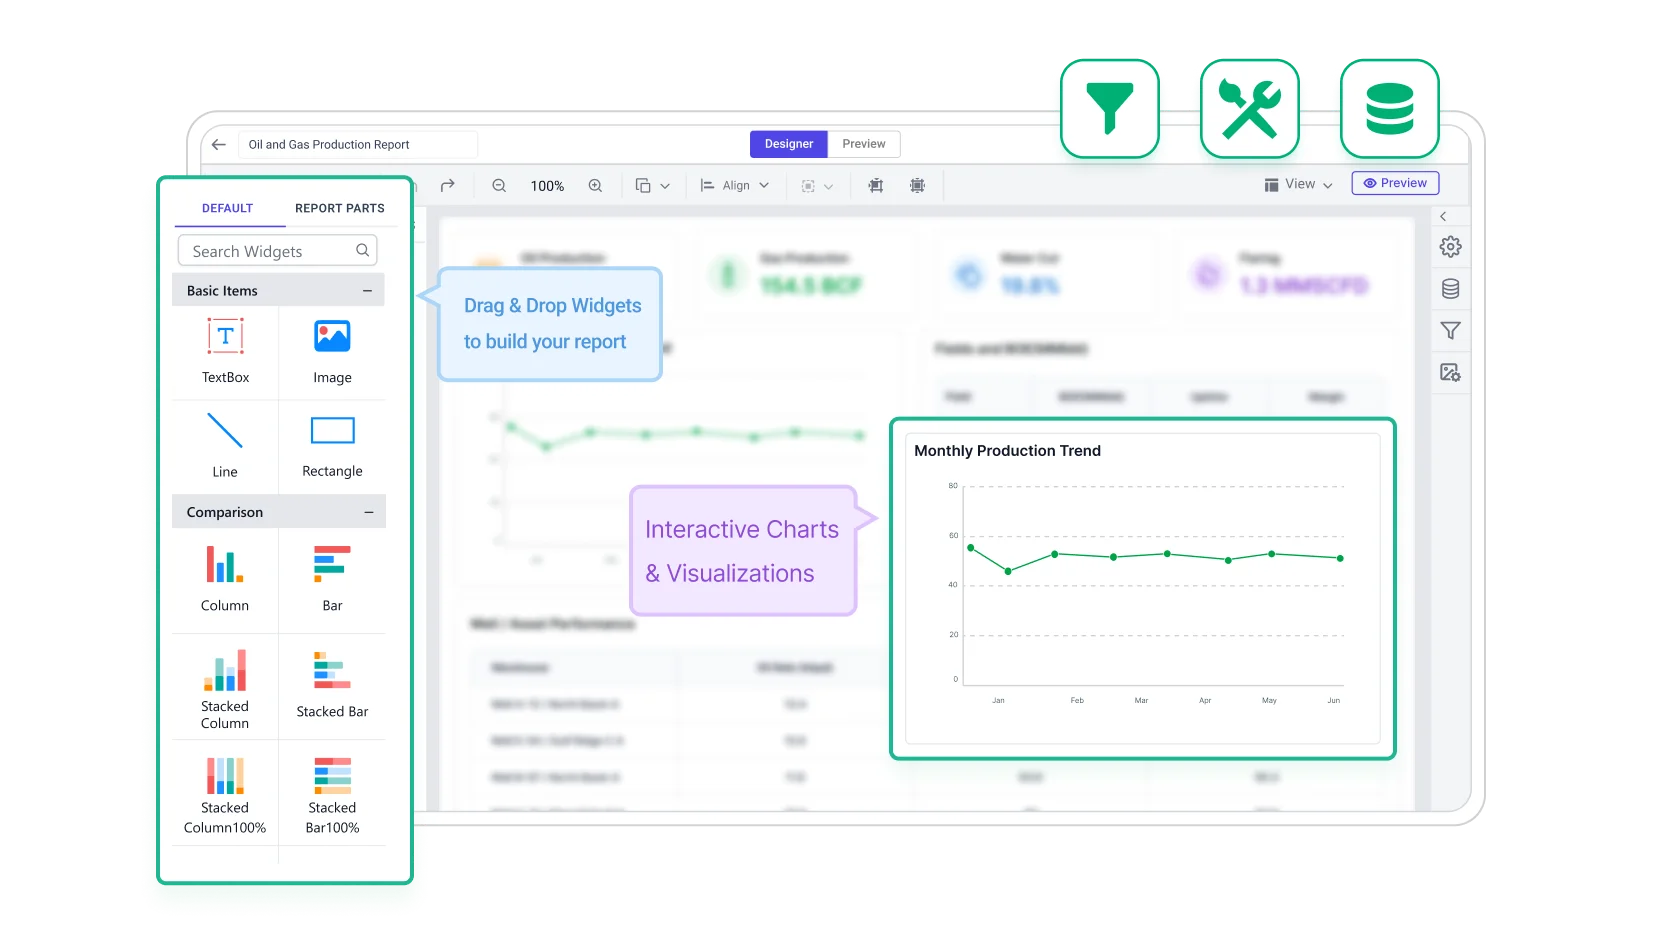
Customize the report with filters, KPIs, and sharing options so teams can focus on production insights tied to output, efficiency, downtime, and asset utilization in upstream operations.

Filter icon

Filter by production area.

Review icon

Review output and asset activity.

Emphasize kpis icon

Emphasize production kpis.

Export icon

Export for field reporting.

Share icon

Share across energy teams.

Build and customize oil and gas production report

No credit card required.

Connectors

Data integrations

Connect to over 25+ data sources from files and databases to web services for flexible integration, transformation, and storage, all ready for reporting.

Common questions answered

Frequently asked questions

Get insights into production volumes, operational efficiency, output trends, and performance tracking across wells and fields daily.

Production-ready reports made easy

Turn your data into production-ready reports instantly

Create pixel-perfect, print-ready reports with powerful exporting and zero complexity.

No credit card required.