






SAMPLE REPORT FOR DATA VISUALIZATION

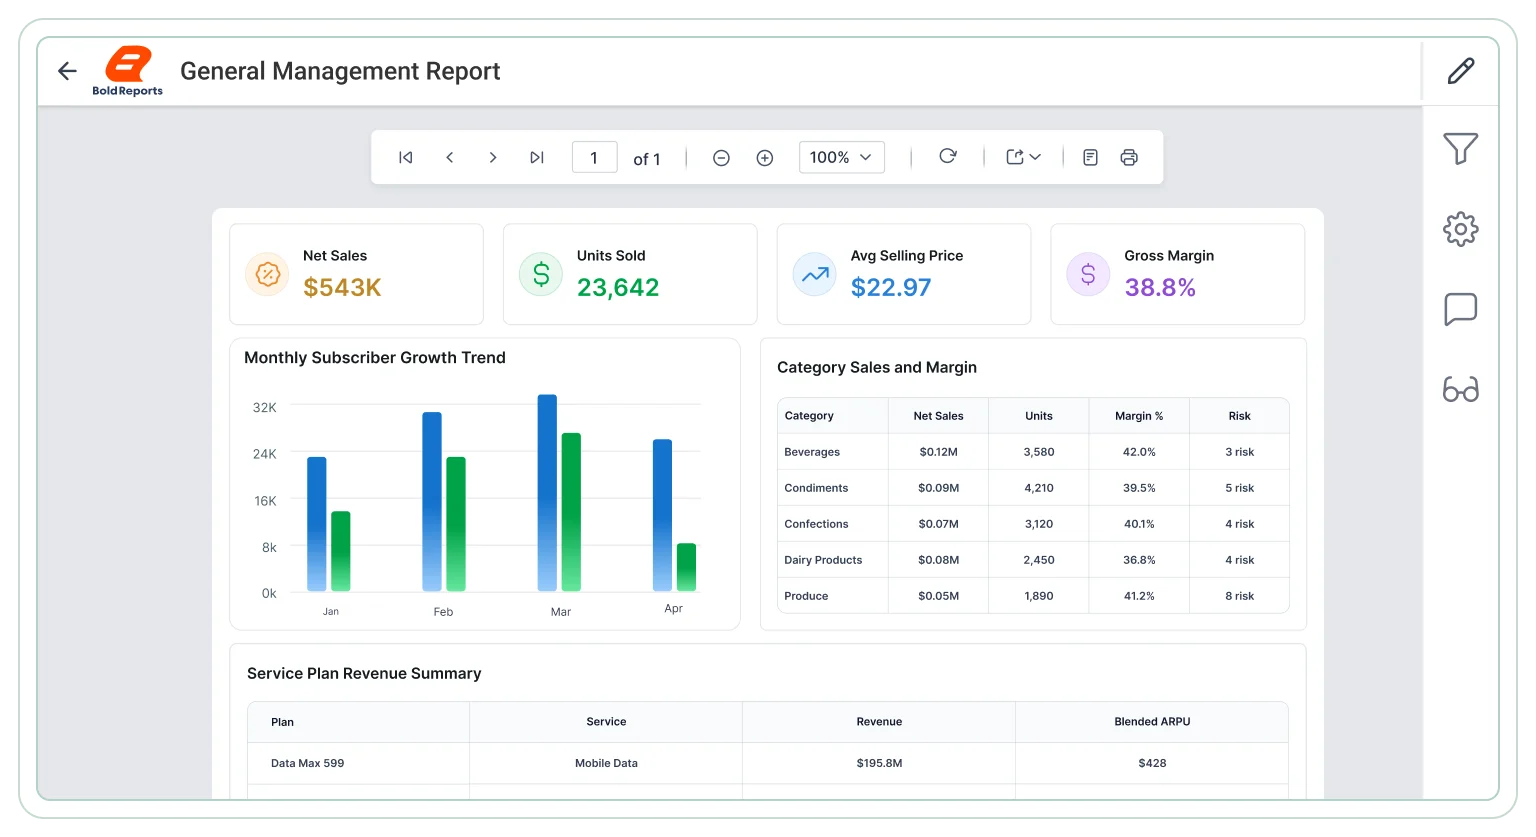
General Management Report

Evaluate telecom business performance with a paginated report designed for trend monitoring, comparison, and clearer visibility into subscribers, revenue, utilization, and regional activity. 

Editable .rdl file i The download includes the report .rdl file only. Upload it to Bold Reports Designer to preview, edit, and customize the report based on your requirements.

Need help customizing the report? Explore the documentation or contact our support team.

General management report
Trusted by leading companies

J&J

Schneider

Bridgestone

Siemens

Verizon

HP

Fidelity

Intel

Real-world business scenarios

Explore key use cases

Use this report to gain actionable insights into subscriber behavior by tracking engagement, and satisfaction metrics to identify trends, detect churn early, and drive targeted service improvements.

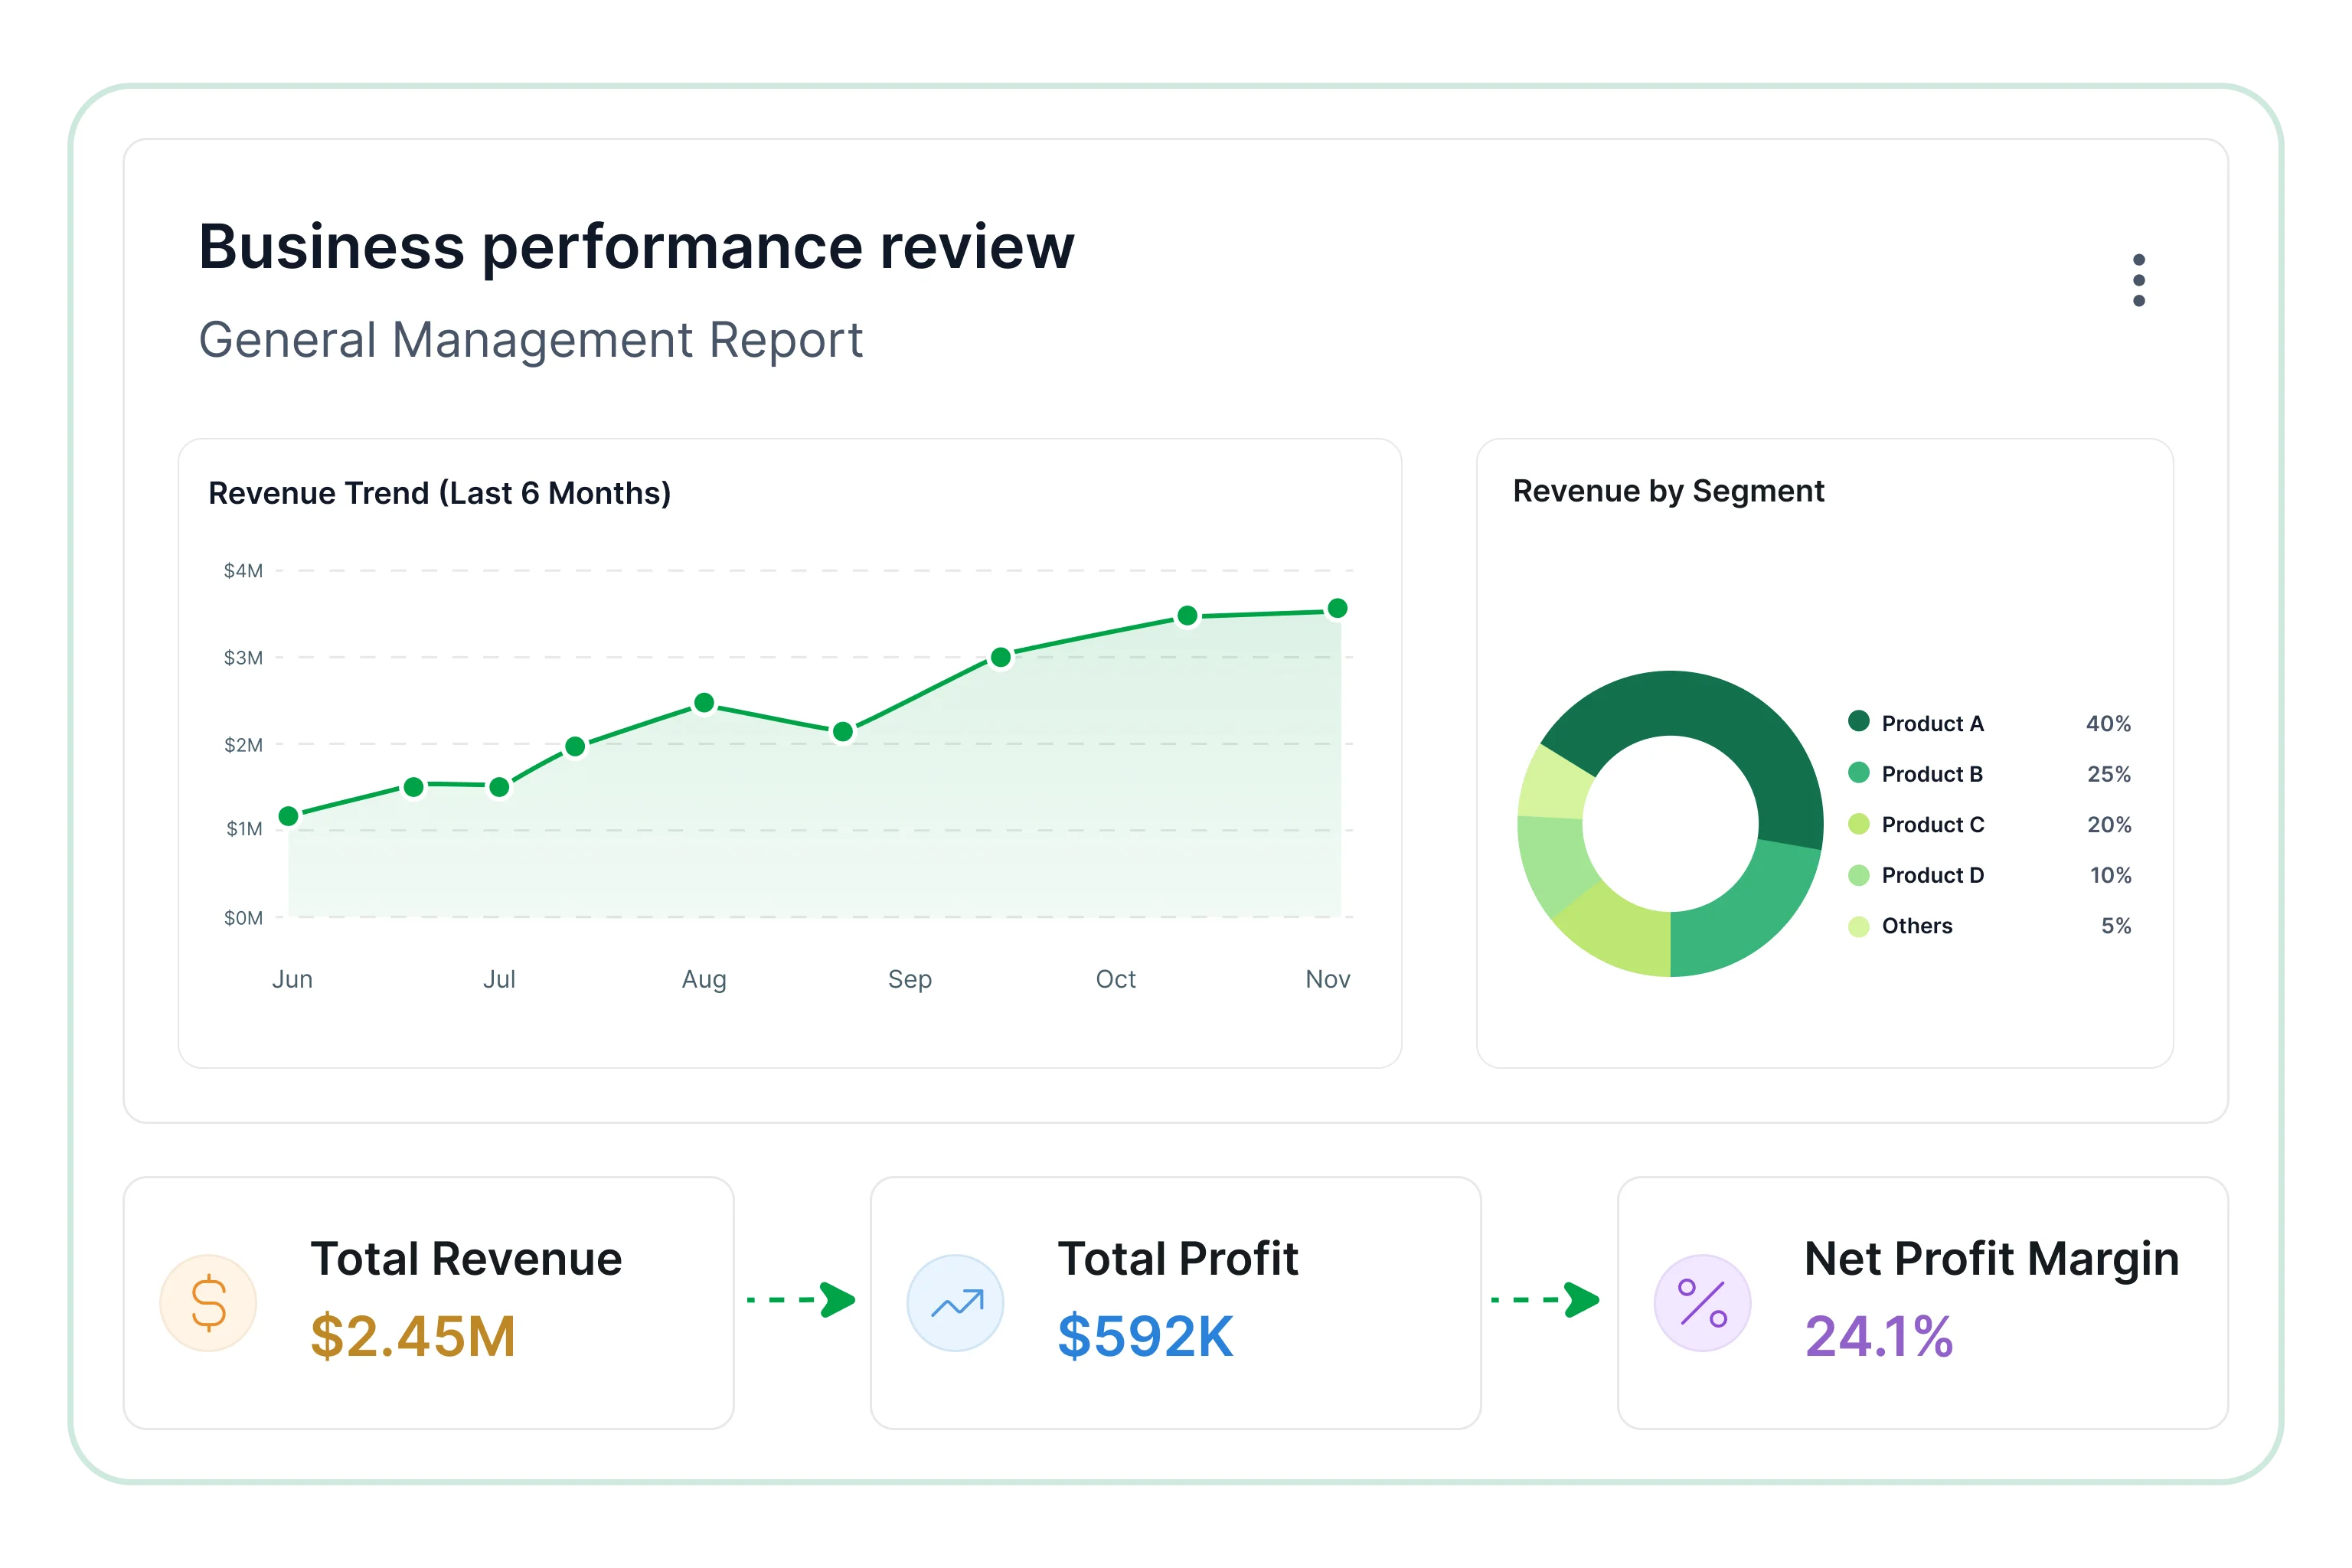
Business performance review

A practical view for leadership teams tracking overall telecom results across core operating areas.

  • Revenue and expense movements are evaluated over time.
  • Subscriber growth patterns across reporting periods are highlighted.
  • Shifts in churn behavior across customer segments are identified.
  • ARPU performance across reporting cycles is clearly measured.
  • Service usage distribution patterns are presented for review..
Business performance review

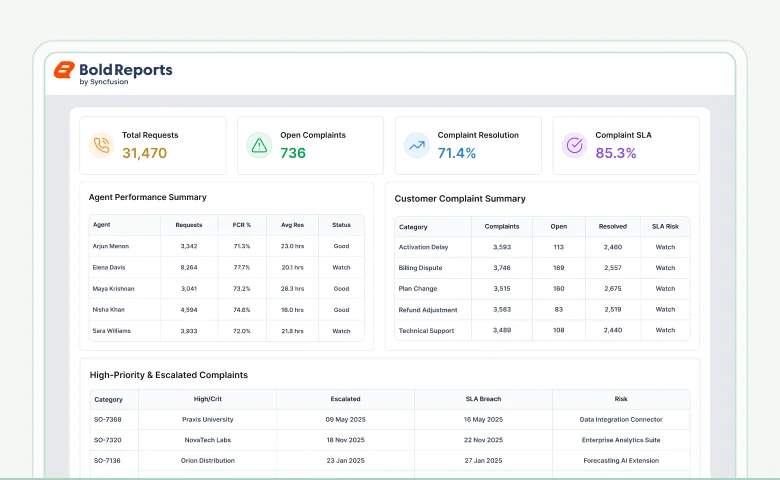
Subscriber trend monitoring

Designed to help teams follow customer base movement across plans, regions, and service types.

  • Outline prepaid and postpaid subscriber mix trends.
  • Assess fixed-line subscriber share across periods.
  • Present regional subscriber counts for clear visibility.
  • Bring to light periods showing customer base decline.
  • Demonstrate growth patterns across reporting cycles.
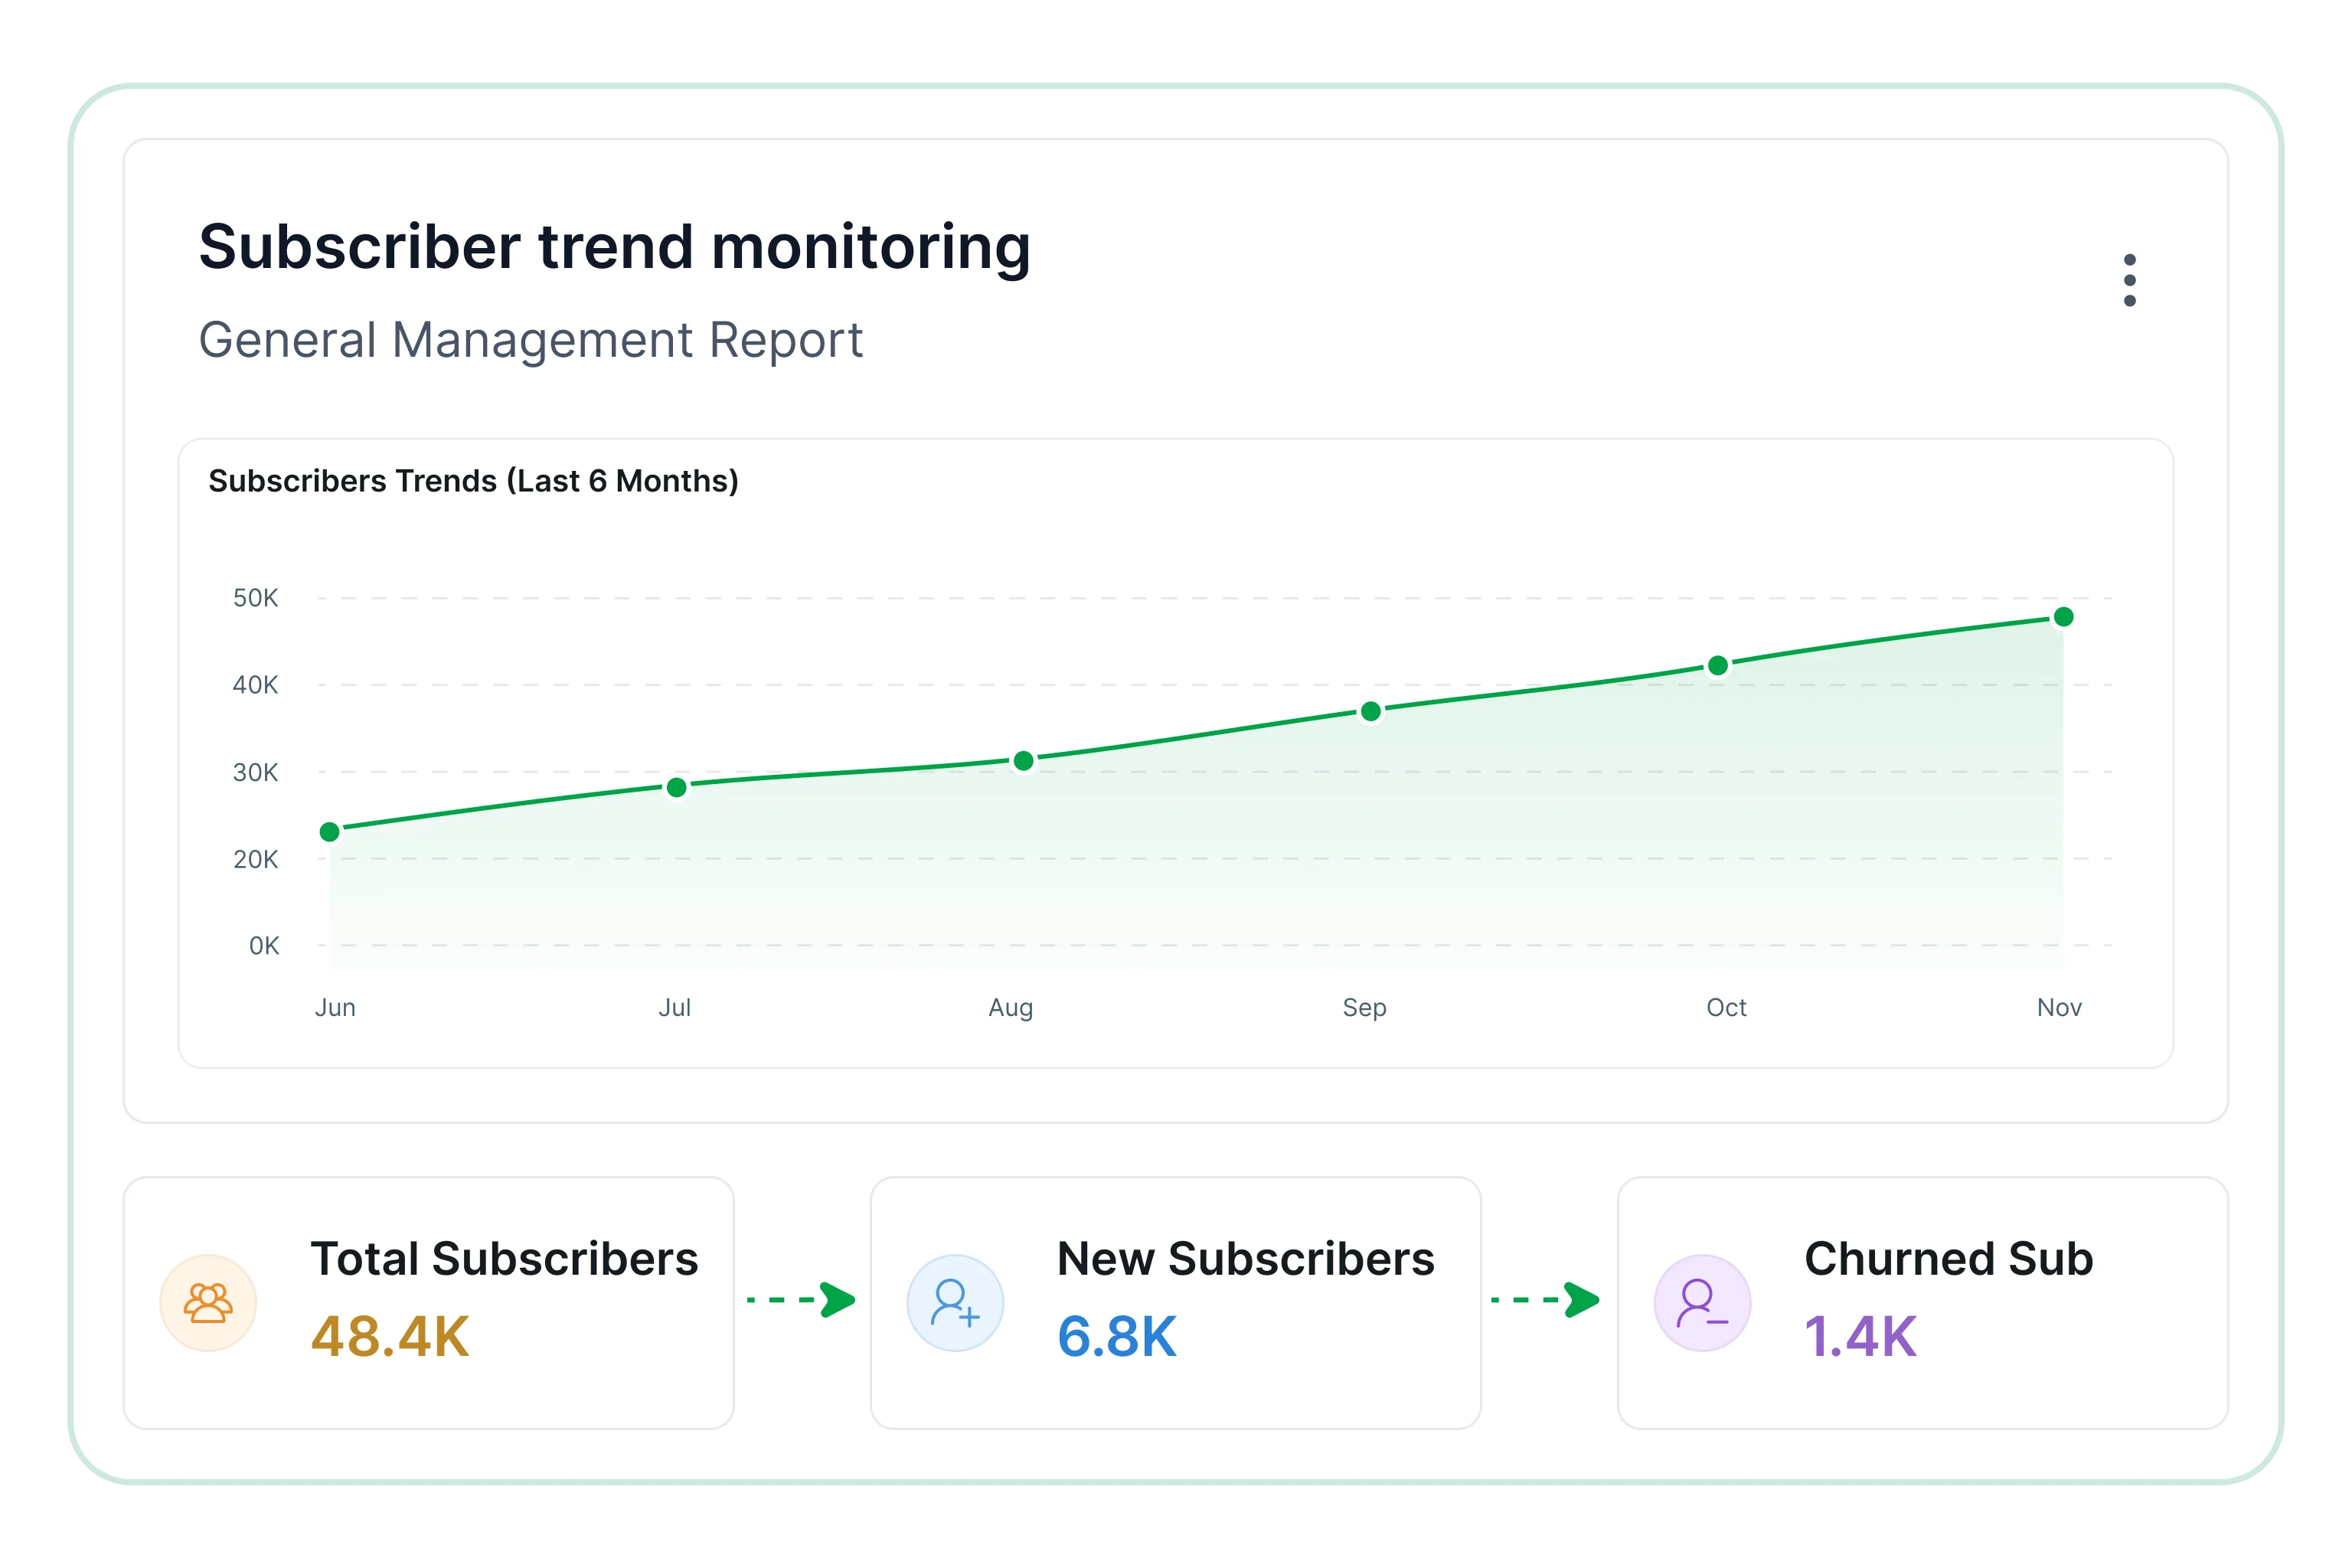
Subscriber trend monitoring

Service utilization analysis

Useful for assessing how customers use telecom services and where demand is shifting.

  • Text, voice, and data usage patterns are detailed.
  • Utilization across different service types is illustrated.
  • High-demand usage segments are highlighted.
  • Network consumption patterns over time are revealed.
  • Usage shifts across selected time ranges are outlined.
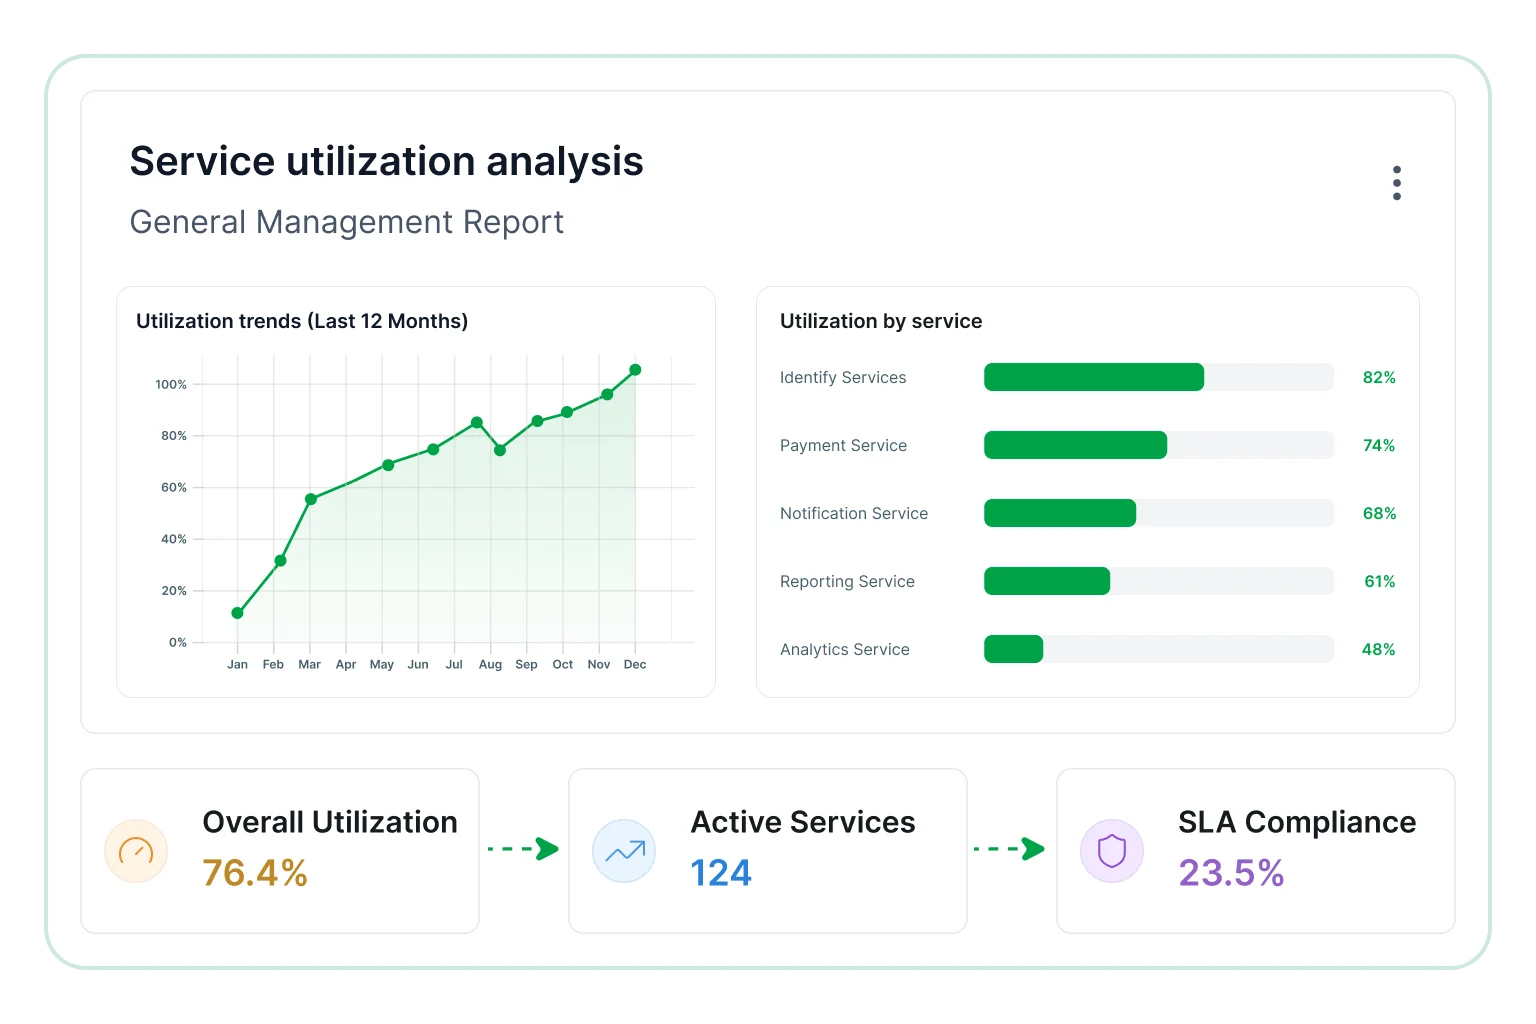
Service utilization analysis

Regional operations comparison

Supports management reviews by showing how performance varies across operating regions.

  • Revenue contribution across regions is broken down.
  • Subscriber concentration by geographic area is illustrated.
  • Variations in churn across regions are highlighted.
  • Service usage levels across locations are presented.
  • Operational performance gaps between regions are identified.
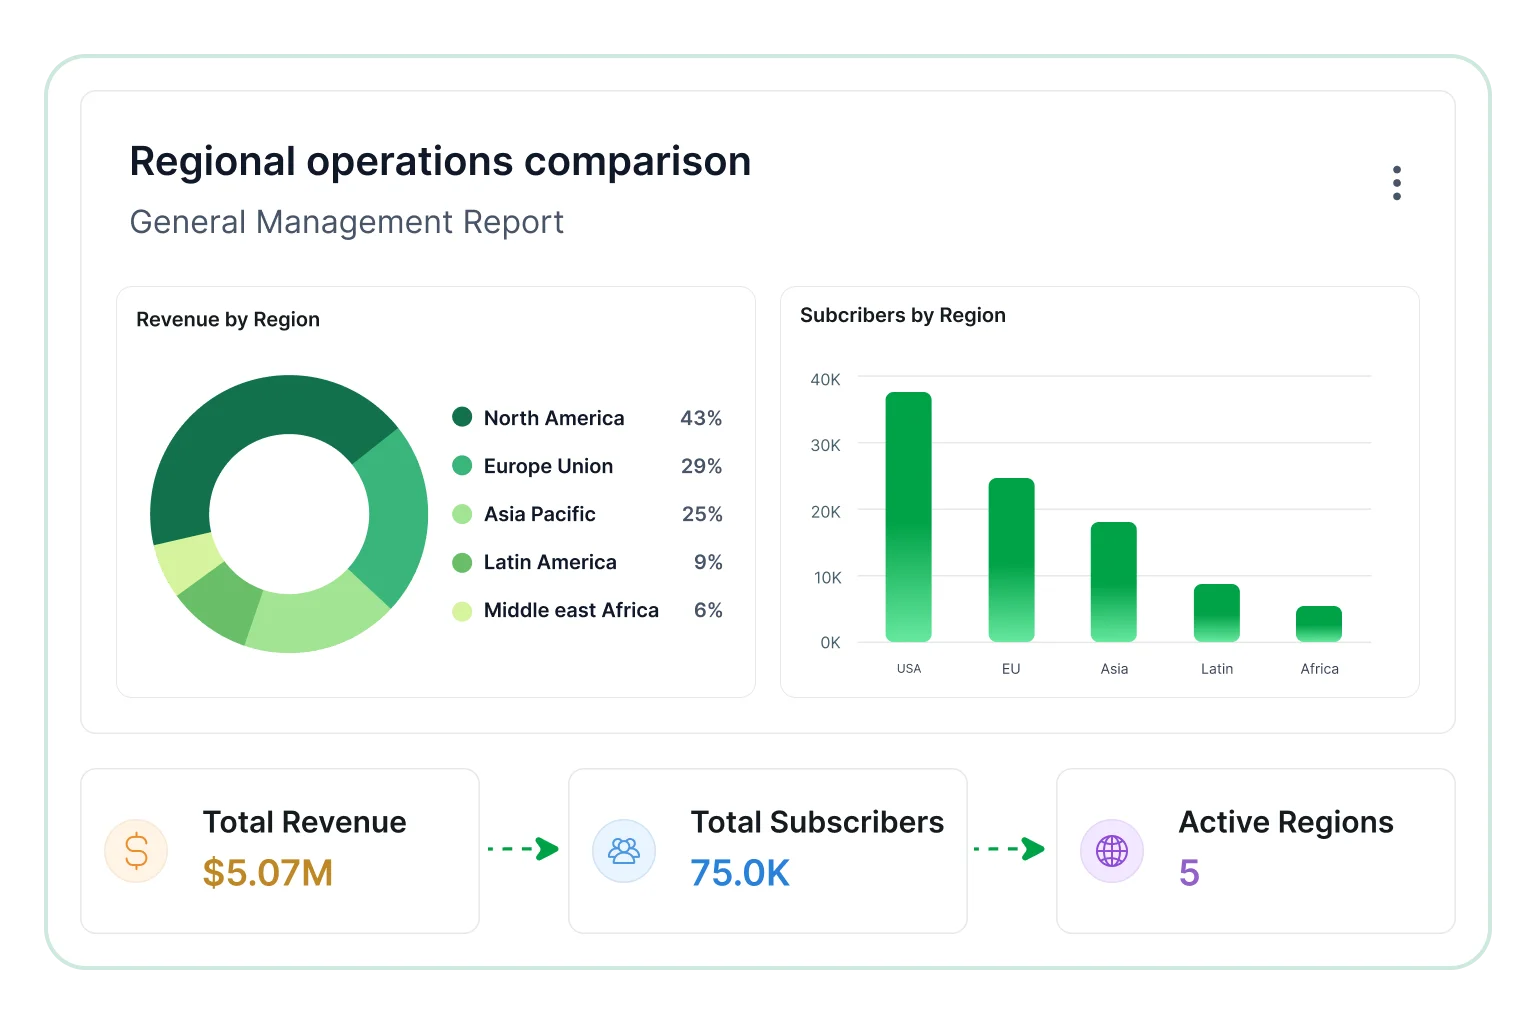
Regional operations comparison
Monitor critical KPIs

Track key metrics

These metrics provide management with a structured, high-level view of organizational health while enabling deeper analysis at regional and service levels to support informed decision-making. 

General management report key metrics
Overview of this report

What is a higher education enrollment & retention report?

This report combines enrollment data, retention trends, dropout insights, and cohort performance into a unified view, helping institutions understand student lifecycle patterns and improve planning.

Faster migration
Faster migration

Modernize existing SSRS reporting without rebuilding reports from scratch.

Stronger security
Stronger security

Protect enterprise reports with secure access and authentication controls.

Easier embedding
Easier embedding

Deliver seamless reporting experiences directly inside your applications.

Better control
Better control

Manage reports, users, and permissions from one centralized platform.

Reduced manual Work
Reduced manual Work

Automate report scheduling, exports, and delivery workflows easily.

Branded reporting experience

Customize the look and feel of reports for each customer.
No credit card required.

Built for your team

Designed for operational reporting teams

Monitor business performance, subscriber activity, operational trends, and regional metrics through structured enterprise reporting. 

Designed for operational reporting teams
Centralized reporting

Centralized reporting

Access business insights from a unified report designed for operational monitoring and performance evaluation.

Executive performance reviews

Executive performance reviews

Track operational KPIs, revenue movement, and business trends across reporting periods.

Secure and role based access

Secure & role-based access

Control report visibility using role-based report permissions to share operational data across teams and departments.

Subscriber and usage monitoring

Subscriber and usage monitoring

Analyze customer activity, churn patterns, and telecom service utilization across categories.

Automated report delivery

Automated report delivery

Schedule recurring report generation and distribute reports across business workflows automatically.

Regional operations visibility

Regional operations visibility

Compare regional performance, usage distribution, and operational activity from a centralized report.
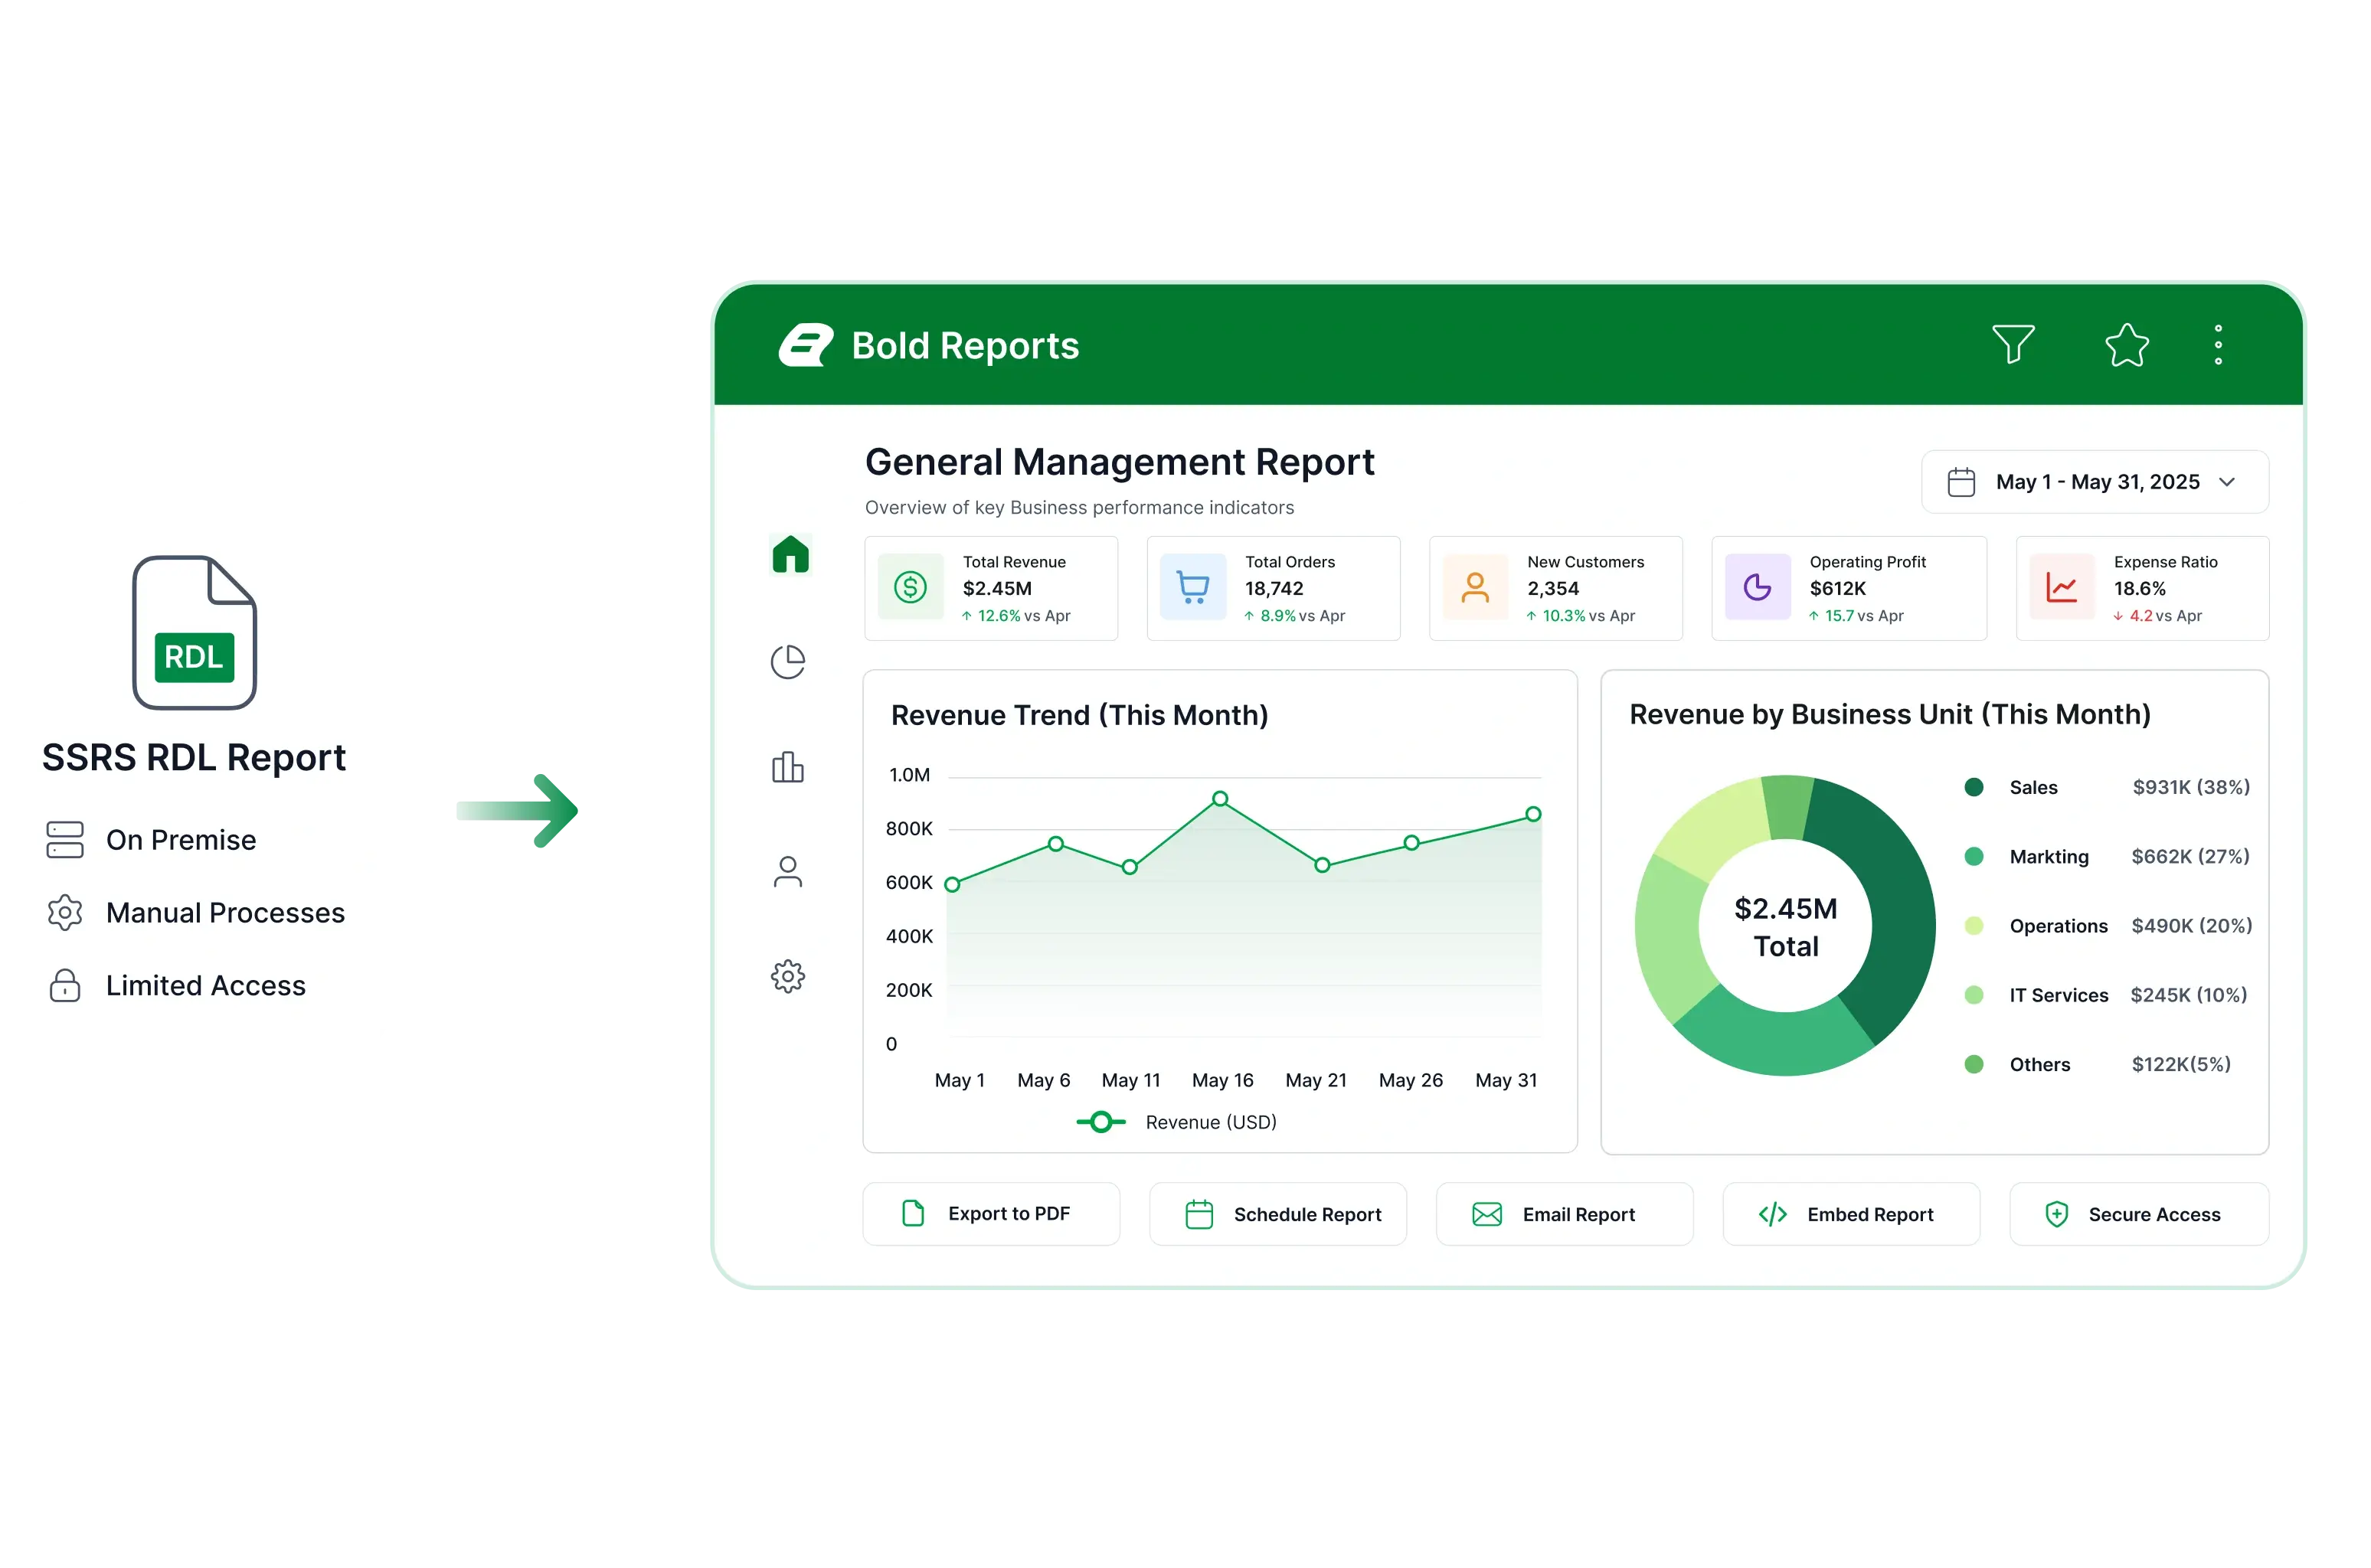
Modernize existing SSRS reports

Advance telecom management reporting workflows

Support existing SSRS RDL reports while modernizing telecom reporting with improved leadership visibility, scheduled delivery, and streamlined workflows for regional and executive teams.

  • Executive reporting access
  • Scheduled reporting
  • Regional reporting support
Advance telecom management reporting workflows
Customize sales reports easily

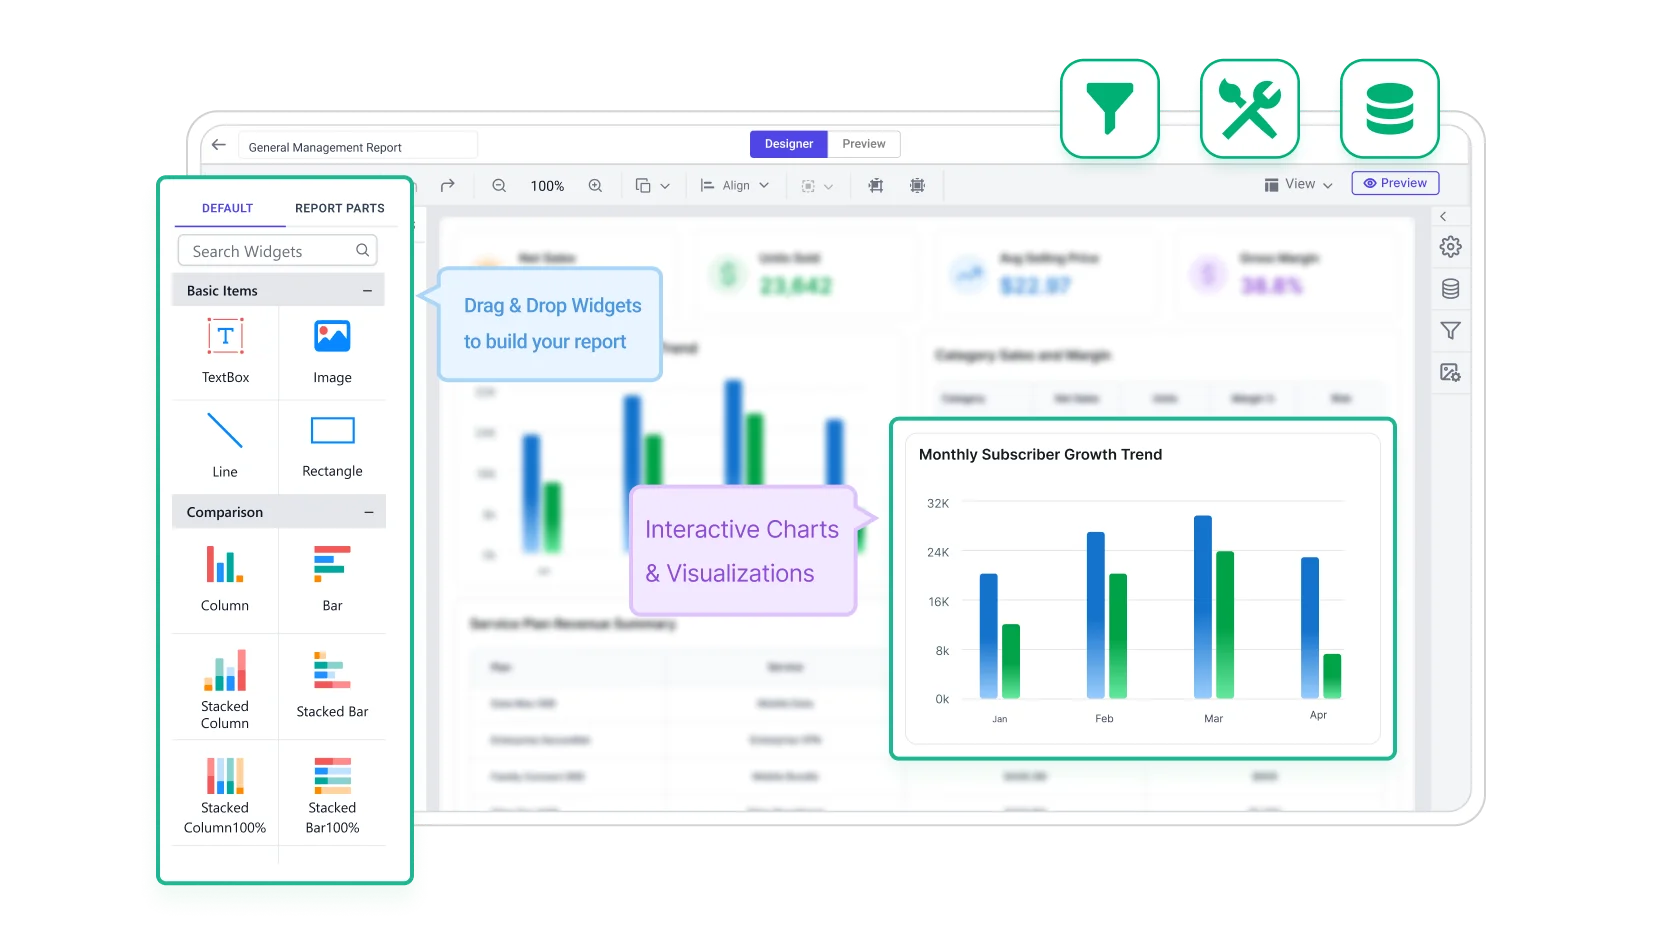
Build & customize

Sales reporting can be configured around KPIs, filters, and recurring delivery requirements. Bold Reports supports export-ready layouts and scheduled outputs for pipeline and revenue use.

Filter icon

Add filter for region, rep, and period.

Configure KPIs icon

Configure KPIs for pipeline and quota.

Drill-down icon

Enable drill down by deal or owner.

Export icon

Export reports in shareable formats.

Schedule recurring report icon

Schedule recurring report delivery.
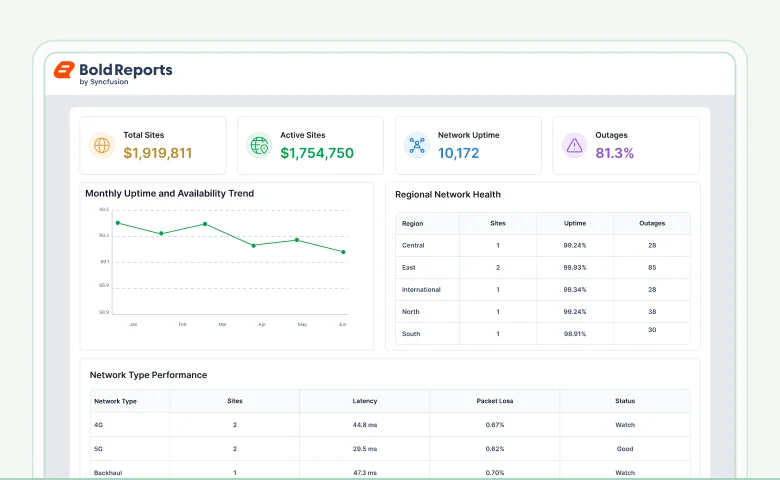
Build and customize general management report

No credit card required.

Templates

General management report templates

Track overall telecom performance across operations, revenue, and service metrics to support strategic decision-making.

Connectors

Data integrations

Connect to over 25+ data sources from files and databases to web services for flexible integration, transformation, and storage, all ready for reporting.

Common questions answered

Frequently asked questions

Learn how telecom data is segmented by time, region, product, and customer group to uncover trends, identify performance gaps, and support more informed decision-making across teams.

Production-ready reports made easy

Turn your data into production-ready reports instantly

Create pixel-perfect, print-ready reports with powerful exporting and zero complexity.

No credit card required.