
TL;DR:
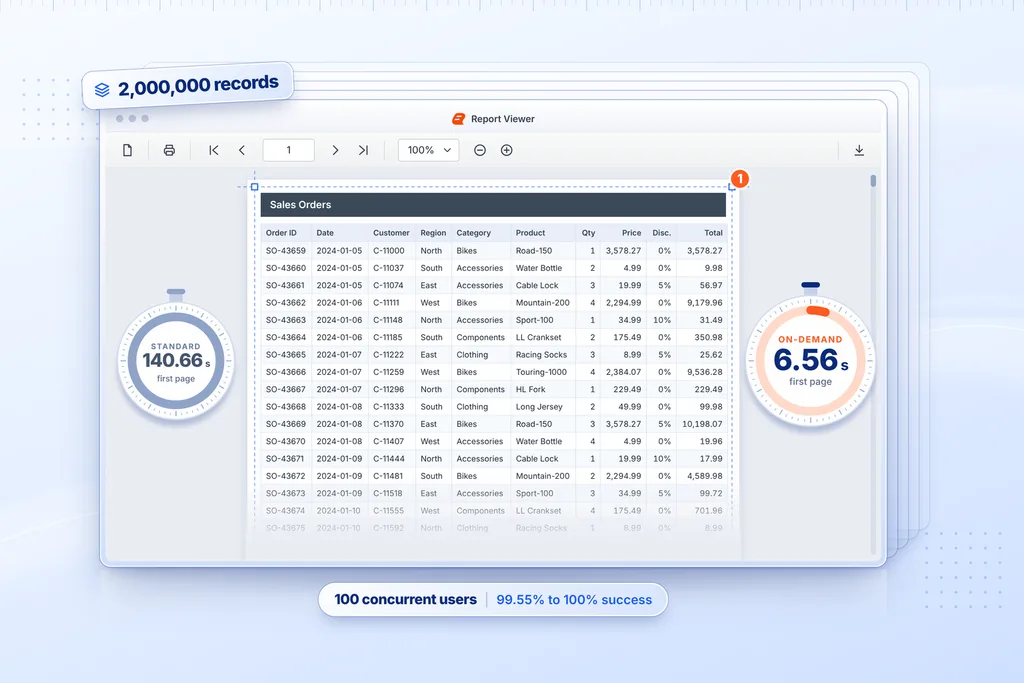
In Bold Reports' published test, a 2-million-record flat table took 140.66 seconds to show page one in standard mode and 6.56 seconds in on-demand mode.
Four PerformanceSetting properties, or the SmartRendering switch in the Report Designer, turn that mode on. They exclude sub-reports, multiple tables, and repeating headers.
The figures cover one flat table, viewing only, so test your own report for completeness, export time, and layout before relying on them.
Introduction
Pixel-perfect reporting at scale means a paginated report keeps its exact layout while the dataset grows into millions of rows. In Bold Reports' published load test, on-demand page creation cut the first page of a 2-million-record table from 140.66 seconds to 6.56 seconds, and 100 concurrent users produced success rates between 99.55% and 100%.
A statement that needs more than two minutes to show page one fails long before anyone checks its margins. That is what standard mode did with 2 million records in a flat, 10-column table, and the same table opened in under seven seconds once on-demand mode was switched on. This post walks through the full test, the four settings that changed the result, and the layout features you give up to get it.
Every figure below comes from Bold Reports' own help documentation, retrieved in October 2026. Treat them as vendor-published results, and read the limits sections before you reuse any of them.
Why does a paginated report slow down as row count grows?
A paginated engine computes layout; it does not stretch a viewport to fit. Every row must be positioned on a page of fixed geometry, so the cost of the first page depends on how much work the engine does before it hands that page over. In Bold Reports' default mode, that work is the whole report.
This fixed-geometry model is what pixel-perfect reporting means in practice: every element has a computed position before anything is drawn.
The ASP.NET Core Report Viewer best-practices documentation describes two default behaviors that compound each other. The Default page-creation mode builds every page before sending the first one to the browser. The default processing engine also fetches all records from the database at once before page creation starts. Row count therefore drives both query time and page-building time, and the user sees nothing until both finish.
A third cost sits inside the table itself. When AutoGrowText is enabled, the viewer measures the dynamic height of each text box cell, and that measurement time scales with the amount of data, per the same documentation. Microsoft's own SSRS performance guidance names hardware, concurrent users, data volume, and output format as the factors that affect report server performance. None of this is specific to one vendor. It is what paginated rendering costs.
The evaluator's question follows: if the first page only needs a few hundred rows, why build the other pages first? On-demand mode exists to remove that wait.
How was the Bold Reports load test set up?
Bold Reports documents two separate tests for its On-Premise Edition on the performance metrics page: a rendering test for large datasets and a concurrent-user test. The two ran on different hosts, so their results answer different questions.
The rendering test used this configuration:
- Host: an Azure virtual machine with 4 vCPUs and 16 GB of RAM
- Report: a flat table with 10 columns
- Setting: on-demand page creation, listed in the documentation as PageCreation set to Background
- Measured: first page time and query execution time, in standard mode and in on-demand mode
The concurrent-user test ran in a Kubernetes environment with 4 vCPUs and 16 GiB of memory and simulated 100 users running the same report. Its parameters are listed in the concurrent-user section below.
One reading note applies to every table below. Bold Reports publishes times as minutes, seconds, and fractions, for example 02:20:66. This post converts each value to seconds, so 02:20:66 becomes 140.66 seconds. The documentation does not state the sample count per row, so each figure should be read as a single published result.
On-demand mode shows the first page in under 11 seconds from 100K to 2 million records
On-demand mode returned the first page in 2.87 to 10.34 seconds at every size from 100,000 to 2 million records. Standard mode needed 11.15 seconds at 100,000 records and 140.66 seconds at 2 million, according to the Bold Reports performance metrics documentation.
| Records | Standard: first page (s) | On-demand: first page (s) | Standard: query (s) | On-demand: query (s) |
|---|---|---|---|---|
| 100K | 11.15 | 3.04 | 1.970 | 0.251 |
| 500K | 36.18 | 2.88 | 3.415 | 3.415 |
| 1M | 77.69 | 10.34 | 5.664 | 0.249 |
| 1.5M | 116.60 | 2.87 | 19.200 | 0.249 |
| 1.7M | 118.16 | 2.87 | 13.156 | 0.266 |
| 2M | 140.66 | 6.56 | 15.197 | 0.255 |
Standard-mode first page time rose with every increase in row count. The gap between the two modes widened from about 3.7 times at 100K to about 21 times at 2M.
On-demand first page time did not follow row count. The 1M run took 10.34 seconds, slower than the 1.5M and 1.7M runs at 2.87 seconds, which is a reminder to treat a single published run as a sample, not a guarantee. Query execution in on-demand mode stayed near a quarter of a second in five of the six rows, consistent with the engine fetching only the first batch of records rather than the full dataset.
Nielsen Norman Group's response-time guidance, which Jakob Nielsen first published in 1993 and the group still repeats, puts about 10 seconds as the limit for keeping a user's attention on the task (Nielsen Norman Group). Against that line, on-demand mode stayed under 10 seconds in five of six rows, and the 1M row at 10.34 seconds sat just over it. Standard mode crossed it at 100K records and never came back under.
One caution applies to the query columns. The documentation reports query time separately and does not say whether first page time includes it, so do not add the two columns together.
Row count barely moves on-demand first page time, and columns add about 0.15 seconds
More rows did not, and doubling columns from 10 to 20 added about 0.15 seconds to the average. The performance metrics page publishes a second data set of 20 runs, from 1,000 to 1 million rows at 10 and 20 columns, and first page time stays between 2.58 and 4.47 seconds in 19 of them.
| Rows | 10 columns: first page (s) | 10 columns: query (s) | 20 columns: first page (s) | 20 columns: query (s) |
|---|---|---|---|---|
| 1K | 3.29 | 0.895 | 3.00 | 0.240 |
| 10K | 2.94 | 0.234 | 3.19 | 0.251 |
| 100K | 2.73 | 0.254 | 3.21 | 0.241 |
| 500K | 4.47 | 0.247 | 2.90 | 0.229 |
| 1M | 2.58 | 0.246 | 3.64 | 0.238 |
The documentation does not name the rendering mode for this table. Its flat profile matches the on-demand results above, so read it as on-demand. The one exception is the 400K row at 10 columns, published as 30.30 seconds against roughly 3 seconds for its neighbors. Excluding that row, the mean first page time is about 3.17 seconds at 10 columns and 3.31 seconds at 20 columns, calculated from the published rows.
That is the practical result for a developer sizing a report. In on-demand mode, the first page depends on the batch the engine fetches, not on how many rows sit behind it. Row count still matters for total pages, export time, and memory, and none of those are measured here. The testing section below lists what to measure yourself.
What happens when 100 users run the same report at once?
Across three runs with 100 simulated users, the success rate ranged from 99.55% to 100%. Bold Reports published the success rate for each run on its performance metrics page: 100% on the first run, 99.55% on the second, and 99.91% on the third.
The documented parameters were:
- Concurrent users: 100, all running the same report
- Ramp-up: 50 seconds, which works out to 2 users starting every second
- Loop: 1 pass per user
- Startup delay: 2 seconds
- Thread lifetime: 700 seconds maximum
- Runtime controller: 480 seconds
- Flow control pass duration: 3 seconds, which regulates the request rate
The environment was a Kubernetes deployment with 4 vCPUs and 16 GiB of memory, the same size as the Azure virtual machine used in the rendering test.
A success rate is not a latency result. The documentation does not publish response times, the report used, the number of requests, the error types behind the missing 0.09% to 0.45%, or which load tool generated the traffic. What the numbers do show is that a 4 vCPU, 16 GiB deployment stayed available while 100 users arrived at a rate of two per second. They do not show how long each user waited.
Four PerformanceSetting properties produce the speedup
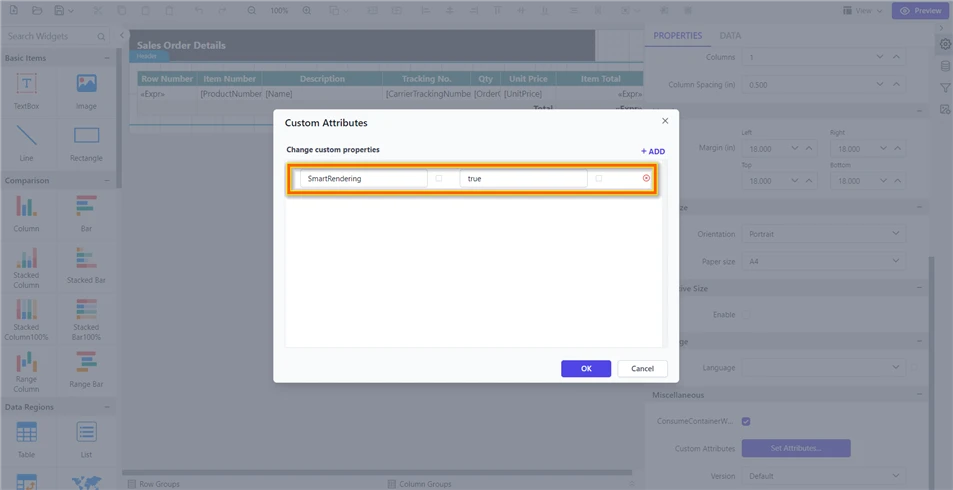
Four PerformanceSetting properties do the work in the ASP.NET Core Report Viewer. The documentation recommends this combination for optimal rendering of large reports: PageCreation set to OnDemand, VirtualEvaluation set to true, AutoGrowText set to false, and FetchLimit set to 1000. Setting the report custom property SmartRendering to true applies the same combination.
- PageCreation controls when pages are built. OnDemand builds the first page and sends it within seconds, then builds each later page when the user navigates to it. Background builds the first page, then builds the rest in the background with a progress bar.
- VirtualEvaluation reuses Tablix cell objects to reduce memory use.
- AutoGrowText set to false stops the viewer from measuring the dynamic height of each text box cell.
- FetchLimit limits the number of records fetched. Bold Reports introduced it in the 6.1 release in April 2024.
Set all four in one initializer. Each documentation sample creates a new PerformanceSetting object, so assigning the property four times would replace the earlier values instead of combining them.
public void OnInitReportOptions(ReportViewerOptions reportOption)
{
    reportOption.ReportModel.PerformanceSetting = new BoldReports.RDL.Data.PerformanceSetting
    {
        PageCreation = BoldReports.RDL.Data.PageCreation.OnDemand,
        VirtualEvaluation = true,
        AutoGrowText = false,
        FetchLimit = 1000
    };
}
You can also set the same combination per report with the SmartRendering custom property in the Report Designer, as the viewer documentation shows.
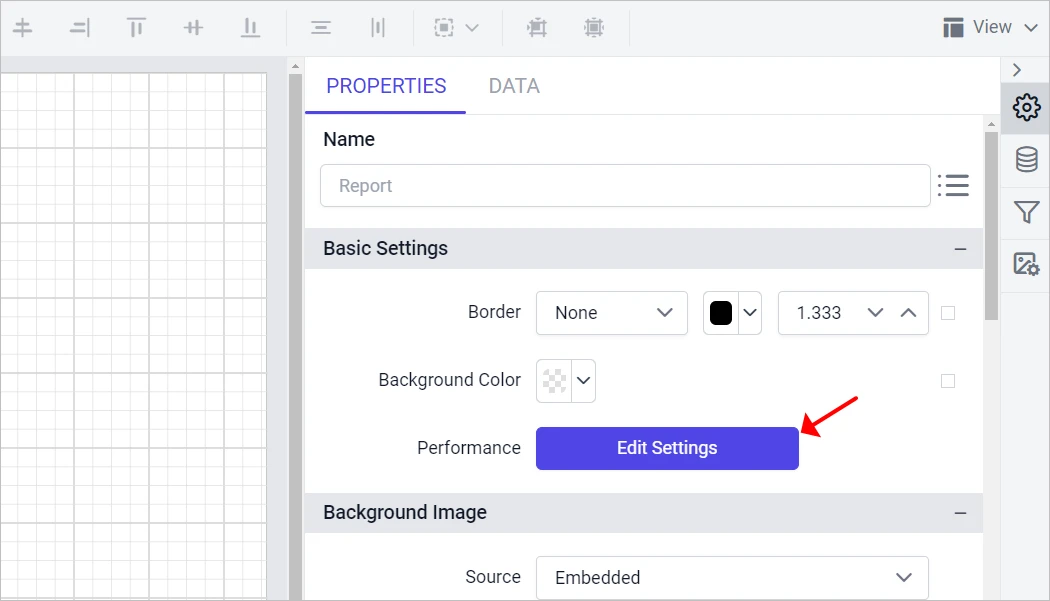
The Designer also has a dedicated panel. Open Report Properties, find Performance Settings under Basic Settings, and click Edit Settings. Switching on SmartRendering there sets AutoGrowText to false, PageCreation to OnDemand, and VirtualEvaluation to true, and enables FetchLimit with a count of 1000. Changing any of those values afterwards switches SmartRendering back to false. The Designer guide lists the defaults as AutoGrowText on, VirtualEvaluation off, and FetchLimit off, so a report you have not touched runs the slow path. See the Performance Settings page of the Designer guide.
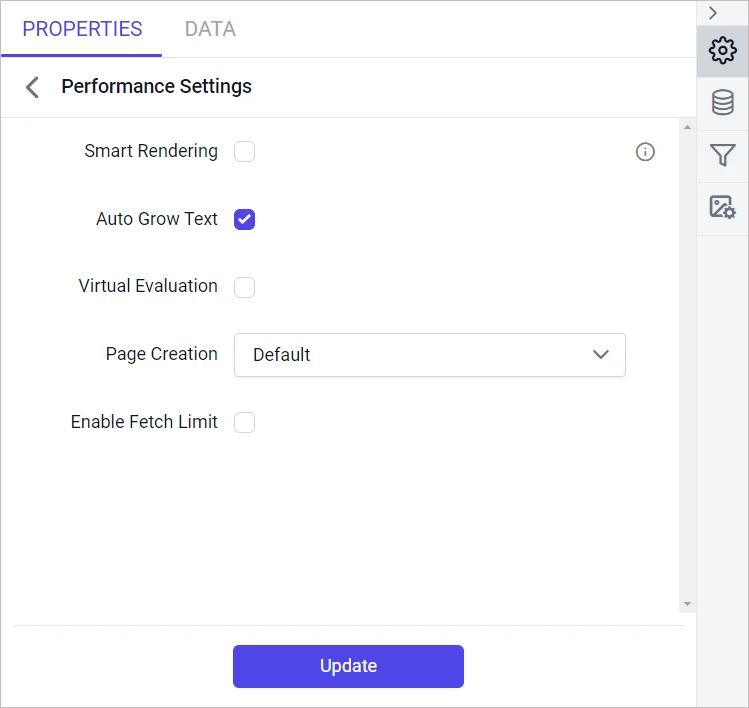
One side effect is documented. With SmartRendering active in OnDemand or Background mode, the parameter panel can freeze while the document is being created, and a progress bar shows at the bottom left of the report. If users need to change parameters mid-render, they click Cancel to stop the rendering, enter the new parameters, and run the report again.
On Bold Reports Server, the same FetchLimit and PageCreation settings are configured in server settings, as the Bold Reports knowledge base article walks through. A separate on-demand data processing engine, currently in beta, fetches the first 1,000 records as a batch and fetches the next batch as users page forward. It is enabled with ProcessingEngine, DataFetchLimitPerBatch, and ExportDataFetchLimitPerBatch.
The skeptical architect's question comes next: does FetchLimit cap the report at 1,000 records, or only batch them? The documentation words it both ways, as a maximum retrieved and as a number fetched at a time. Page to the last page of a test report and compare the record count before you rely on it for a statement or an invoice.
For a screenshot walkthrough of these settings, see Bold Reports' guide to viewing large records in the Report Viewer.
Fast rendering excludes sub-reports, multiple tables, and repeating headers
The Designer guide says the fast path is available for Tablix-based reports only, and the viewer documentation describes it as built for non-grouping reports. The 6.1 release notes mention table group levels with millions of records, so test your own grouping before relying on either reading. The benchmark report was a flat 10-column table, so the 6.56-second result describes that shape. A report with sub-reports, multiple tables, or repeating headers is outside what the documentation says these settings support.
The ASP.NET Core Report Viewer best-practices page lists limitations for two separate mechanisms: the PerformanceSetting properties, and the beta on-demand data processing engine. The table compares them. A cell reading "Not listed" means the documentation does not mention the capability for that mechanism, not that it is supported.
| Capability | PerformanceSetting properties | Beta on-demand data engine |
|---|---|---|
| Repeat table headers | Not supported | Not supported |
| More than one table in a report | Not supported | Falls back to the default engine |
| Nested tables | Not supported | Not listed |
| Images or charts in table cells | Not supported | Rectangle in a cell falls back to the default engine; images and charts not listed |
| Grouping | Column groups not supported | Adjacent groups not supported |
| Sub-reports | Not supported | Not listed |
| Toggle items | Not supported | Not listed |
| Document map or bookmark labels | Not supported | Not listed |
| Aggregations inside the table | Not listed | Not supported |
| Keep together and keep with group | Not listed | Not supported |
| Data sources | Not listed | SQL and PostgreSQL only; Web API and Oracle not supported |
| SQL stored procedures | Not listed | Not supported; query mode only |
The documentation does not say that on-demand mode changes page geometry. It does say that AutoGrowText set to false skips height measurement for text boxes, so size each text box for the longest value you expect and compare the same report in both modes before release. The beta engine also carries a separate export setting, ExportDataFetchLimitPerBatch, which defaults to 100,000 records per batch. The published benchmark measured viewing, not export.
If your layout needs headers on every page, Bold Reports explains how to repeat row and column headers on multiple pages. Measure that report in default mode, because repeating headers fall outside the fast path.
How should you load-test your own paginated reports?
Test your real report at your real data sizes, and measure completeness and layout as well as speed. The published figures cover one flat table, viewing only, on one host size, so they set a reference point and not a promise for your workload.
What the published numbers do not cover:
- Reports with grouping, sub-reports, images, or repeating headers
- Export to PDF, Word, or Excel at these row counts
- Memory and CPU use on the host while rendering
- Response times and error types under concurrent load
- The data source, network distance to it, and the number of runs behind each figure
A test plan that closes those gaps:
- Use the production report definition, with its real grouping, headers, and images, and a copy of production-sized data at 100K, 500K, 1M, and 2M rows.
- Record first page time, time to the last page, total page count, and the record count on the final page. A fast first page means little if the last page is unreachable.
- Render the same report in default mode and on-demand mode, export both to PDF, and compare page 1 and a middle page side by side. This is the pixel-perfect check: the margins, column widths, and page breaks should match.
- Run each size at least five times and report the median, because the published 1M on-demand run shows how far a single result can drift.
- Export at each size and record duration and host memory, since the viewer benchmark does not cover export. Microsoft's guidance on large SSRS reports notes that performance and memory use vary by rendering format, and that PDF and Excel are the slowest.
- Ramp concurrent users the way your production traffic arrives, and record response-time percentiles and error messages, not only a success rate.
The Bold Reports 30-day free trial gives you a way to run steps one through four against your own data.
If users open the same heavy report repeatedly, report caching reduces database load. Test it as a separate variable, so its effect does not blur the on-demand results.
Frequently asked questions about large dataset rendering
- 1.
What does pixel-perfect reporting at scale mean?
Pixel-perfect reporting at scale means a paginated report keeps its fixed page layout, margins, and page breaks while the dataset grows to hundreds of thousands or millions of rows. The goal is that page one and page five hundred render with the same geometry, and that speed does not depend on trading that layout away.
- 2.
How many records can Bold Reports render?
Bold Reports published first page results for tables of up to 2 million records in on-demand mode, with first page times of 2.87 to 10.34 seconds. That figure comes from a flat 10-column table on a 4 vCPU, 16 GB host. Reports with sub-reports, multiple tables, or repeating headers fall outside the documented fast path.
- 3.
Does on-demand mode change how the report looks?
The documentation does not say that on-demand mode changes page geometry, but it does say AutoGrowText set to false skips height measurement for text boxes. Compare the same report in default and on-demand mode as PDF exports, checking page one and a middle page for margins, column widths, and clipped text before release.
- 4.
Which settings should I turn on for a very large report?
Bold Reports recommends PageCreation OnDemand, VirtualEvaluation true, AutoGrowText false, FetchLimit 1000, or the SmartRendering switch, which sets all four. In the Report Designer, open Report Properties, then Performance Settings under Basic Settings, and click Edit Settings. Check your report against the limitations list first.
- 5.
What is the difference between OnDemand and Background page creation?
OnDemand builds the first page and sends it within seconds, then builds each further page when the user navigates to it. Background also sends the first page quickly, but builds the remaining pages behind the scenes and shows progress in a bar. Choose OnDemand to minimize work for unvisited pages, and Background when users usually page forward.
- 6.
How many concurrent users did the load test cover?
Bold Reports ran a 100-user test on a Kubernetes deployment with 4 vCPUs and 16 GiB of memory, ramping at two users per second over 50 seconds. Three runs returned success rates of 100%, 99.55%, and 99.91%. The documentation does not publish response times, so treat the result as an availability signal, not a latency figure.